Highlights
- Goods inflation globally is becoming less benign. China’s price cycle, AI-related supply constraints, and geopolitical disruptions are unlikely to recreate pandemic-style shortages, but they will make goods inflation more positive, uneven, and vulnerable to renewed shocks.
- The pressure will vary by market: Canadian consumers are more exposed to higher prices for electronics, vehicles, and appliances; Americans may initially feel the impact more indirectly through costly infrastructure and business investment; and Europe is particularly vulnerable to price pressures in vehicles and other battery-dependent goods.
- With goods prices providing less offset, services inflation will likely need to fall further than in the previous tightening cycle for inflation to return sustainably to target in the United States, Canada, Europe, and Japan.
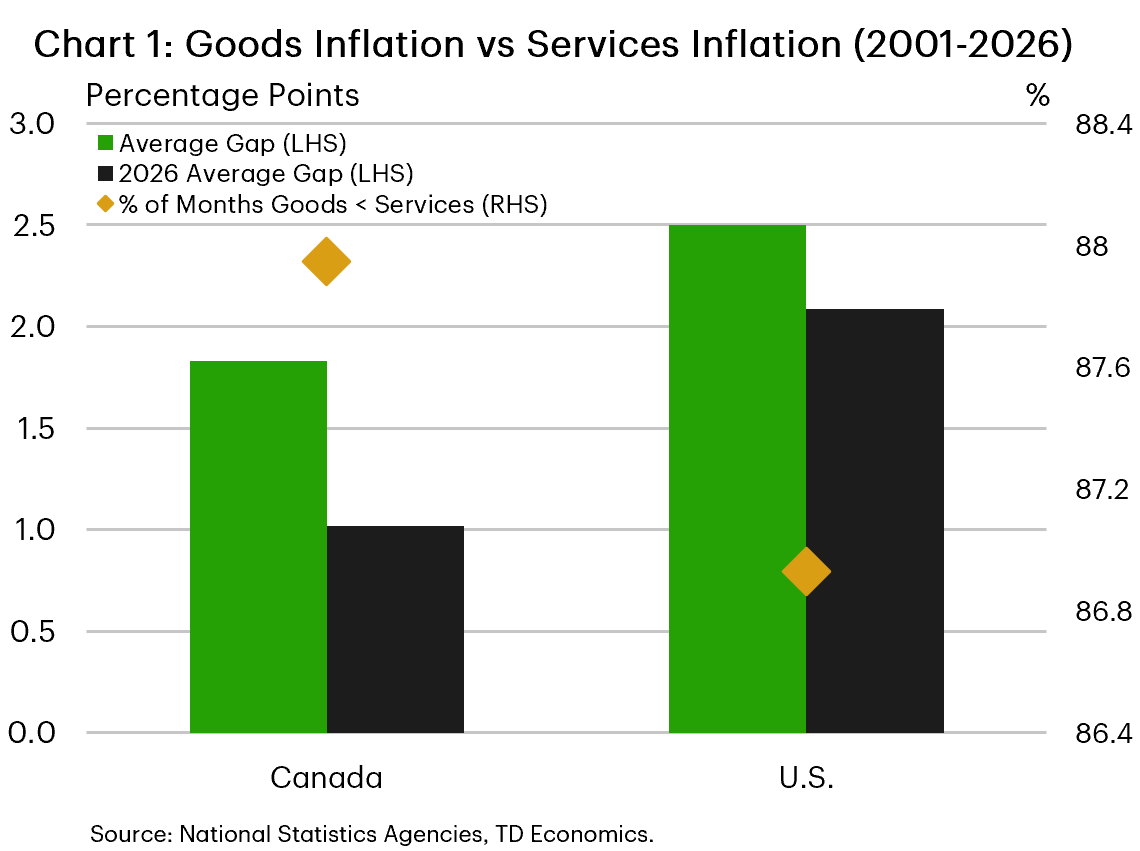 For most of the past several years, goods inflation has helped cool the broader inflation picture. Once pandemic restrictions eased and supply chains normalized, goods prices again benefited from manufacturing productivity, global competition, and favorable commodity cycles. That pattern is not unusual: since 2001, goods inflation has run below services inflation more than 80% of the time in Canada and the United States, with services inflation averaging about 2 percentage points more in both economies (Chart 1).
That support is now fading. As Chart 1 shows, the gap between goods and services inflation narrowed in 2026. Three forces are changing the outlook: China is no longer exporting the same degree of price weakness, AI investment is straining selected technology supply chains, and geopolitical conflict is raising energy and supply-chain costs. None points to a broad return of pandemic-style shortages. Together, however, they suggest that goods prices will provide less disinflationary support against persistent services inflation than they have historically.
The contrast with the recent past is important. From 2023 through 2025, the unwinding of pandemic disruptions pushed goods inflation to very low levels, and goods prices declined for periods in both Canada and the United States. Even excluding energy, core goods prices helped counter inflation elsewhere. In 2026, that support largely disappeared. The sections that follow explain why this change is likely to be more than a short-lived rebound.
China No Longer Exporting Deflation
The shift begins with China. In recent years, weak domestic demand and excess industrial capacity held down Chinese prices and encouraged manufacturers to compete aggressively in export markets. From the end of the pandemic through 2025, producer and export prices generally weakened (Chart 2a). That pattern changed in 2026: consumer inflation returned to positive territory, while export prices rose sharply, increasing 11.8% from a year earlier in July.
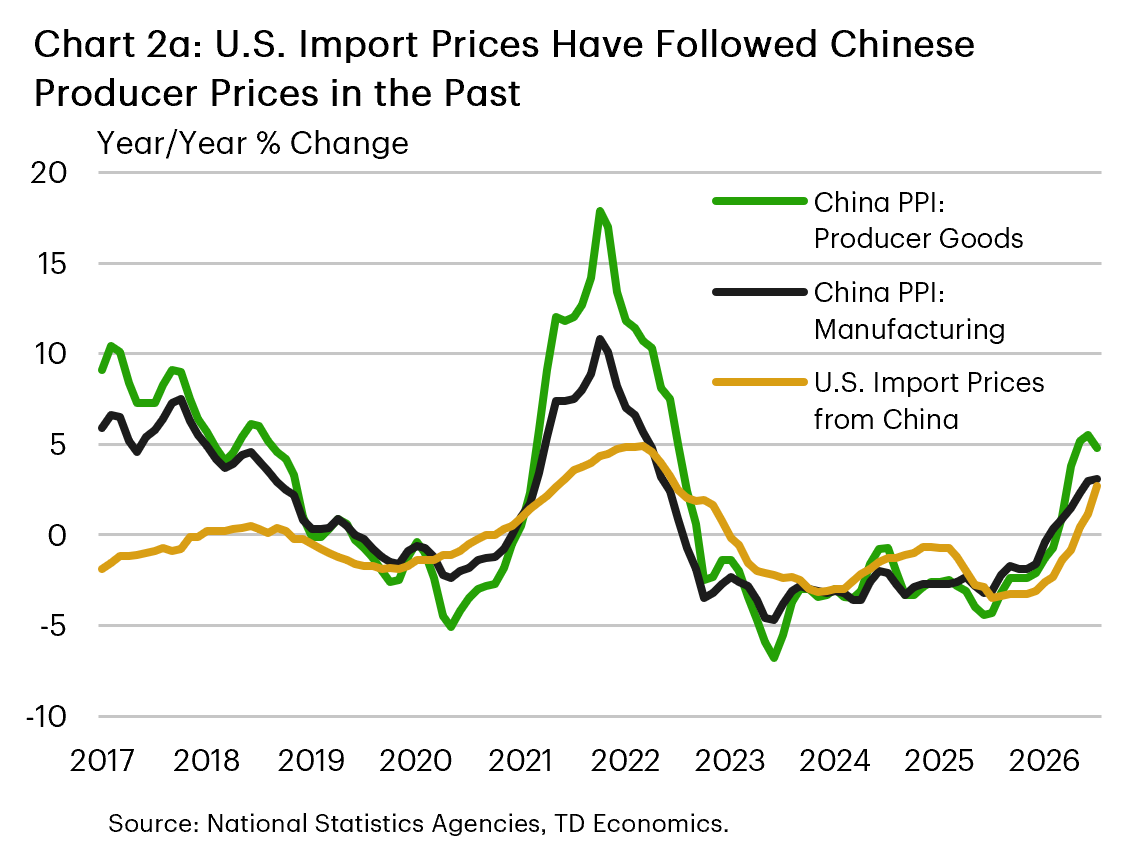
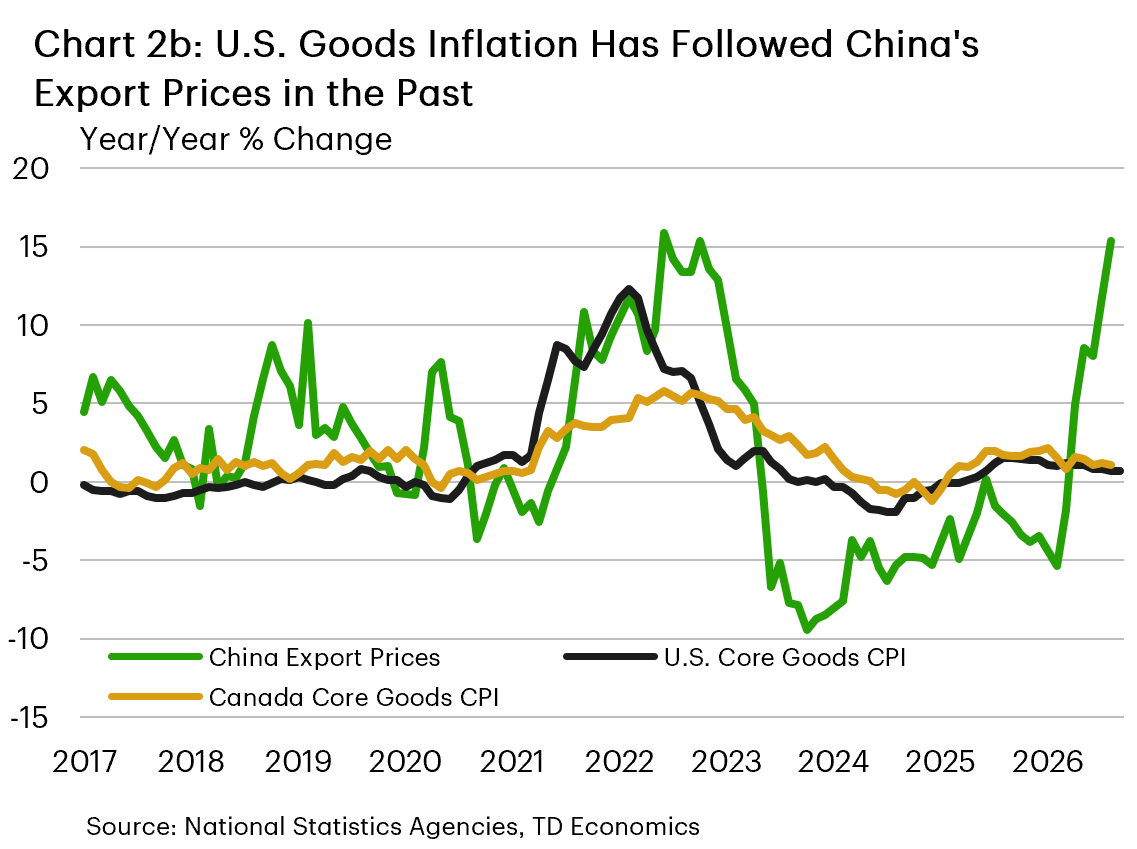
The change matters well beyond China because Chinese goods remain embedded in the consumer and industrial supply chains of major developed economies. During the pandemic, a surge in Chinese export prices coincided with the sharp rise in U.S. core goods inflation (Chart 2b). The current upswing is narrower, more recent, and follows several years of reduced U.S. import dependence on China, so its effect on consumer prices should be smaller and less immediate. Even so, China remains central to global manufacturing, meaning the reversal in its price cycle removes an important source of disinflation for imported goods.
The transmission should occur in stages. Higher Chinese input and factory-gate prices first lift the cost of imported intermediate goods, then feed into domestic producer prices and, as inventories turn over and contracts reset, consumer prices. Exchange rates, tariffs, shipping costs, and retailer margins can delay or dilute the effect, so pass-through will not be one-for-one. But the direction has clearly changed, and strong global investment is adding bottlenecks in the technology inputs supplied by China and other Asian producers.
Technology-Sector Bottlenecks
The AI investment boom is the second source of pressure. This is not a repeat of the generalized semiconductor shortage of 2021. Demand is instead running into limited capacity in a narrower set of high-end inputs.
These include advanced logic chips, high-bandwidth and server memory, advanced packaging, networking and optical equipment, and the power and cooling systems needed to operate data centers. Capacity will expand, but fabrication plants, packaging lines, grid connections, and other supporting infrastructure take years—not months—to build.
The inflationary effects extend beyond equipment purchased directly by technology firms. Because chip and memory producers favor high-margin AI products, capacity for conventional components can become strained. Producers of computers, phones, vehicles, appliances, and industrial machinery may then face higher costs or longer delivery times. The first effects should appear in producer prices and business-equipment inflation. They can later reach consumers through electronic goods, vehicles, appliances, and services that rely on more expensive hardware. The impact will be uneven, but a long investment cycle could make it more persistent than a temporary shipping disruption.
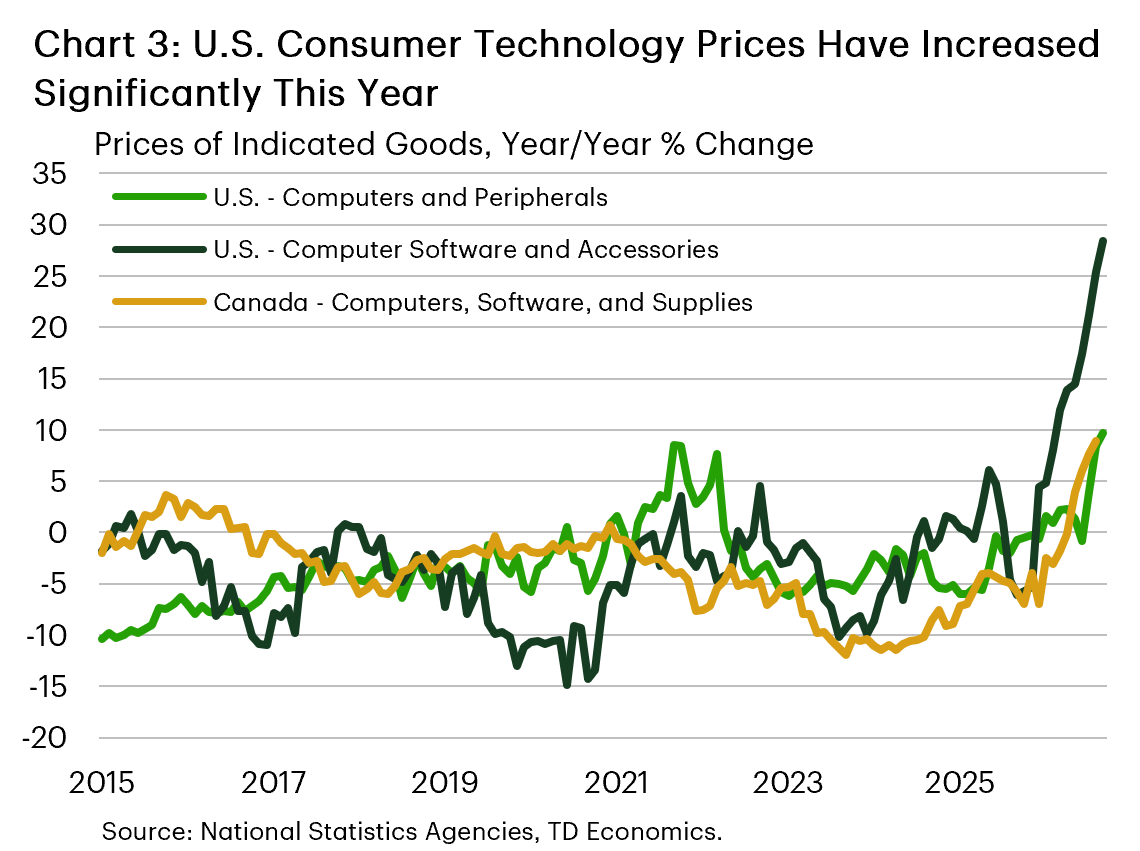 Chart 3 shows that this is already evident in some consumer goods categories in the United States. The recent sharp upward shift in price inflation for computers, peripherals, and software has added about 0.05 percentage points to U.S. CPI inflation over the past year, while it has had a negligible impact in Canada. The lower impact in Canada is in part because of lower inflation for computers and related goods and a somewhat lower share in Canada’s CPI basket, but the effect may also be reaching Canada with a lag, given that the demand surge is concentrated in the United States.
This does not mean all technology goods will become inflationary. Productivity gains, better products, and competition will continue to reduce quality-adjusted prices in many categories. But the AI build-out is raising the floor under selected input prices and making technology-related deflation a less powerful offset elsewhere. Table 1 highlights where exposure is greatest by comparing global supplier concentration with each economy’s import dependence for critical inputs.
Several inputs critical to AI infrastructure and related industrial production come from a small group of exporters. The top three suppliers account for 77% of permanent-magnet trade, 70% of lithium-ion batteries, 57% of integrated circuits, and 56% of semiconductor-manufacturing equipment. China alone supplies 62% of permanent-magnet exports and 58% of battery exports, while integrated-circuit production is concentrated in a small group of East Asian economies. Fertilizers, plastics, transformers, and refined copper have somewhat broader supplier bases and therefore more scope for substitution. Even so, a global market can look diversified while an individual country remains highly exposed to imports.
Import reliance therefore matters as much as global concentration. It shows which economies are most likely to face higher costs when investment accelerates or supply is disrupted. The pattern differs considerably by country and product:
- Canada is especially reliant on imported permanent magnets, integrated circuits, and batteries, leaving its producers more exposed to shortages and cost increases in electronics, vehicles, machinery, and other technology-intensive goods.
- U.S. reliance is more pronounced for transformers, refined copper, and batteries, so bottlenecks can spread beyond the technology sector through power-grid investment, construction, transport equipment, and data-center infrastructure.
- The United States and Japan are important semiconductor producers, yet both still depend on imported materials and manufacturing equipment, leaving domestic production vulnerable to disruptions at upstream stages of the supply chain.
- The European Union relies heavily on imported magnets and batteries but less on semiconductor equipment.
These differences shape where inflation appears first. Shortages of equipment, chips, copper, and transformers should initially raise producer and capital-goods prices. Batteries and magnets have a more direct route into consumer prices through vehicles and electronics, while fertilizer and plastics spread more broadly through food, packaging, and household goods. Geopolitical fragmentation can intensify each of these channels by making supply less flexible and more expensive to secure.
Geopolitical Dislocations Are Diminishing Resilience
Geopolitical fragmentation is the third force making goods inflation less benign. The 2026 interruption of shipping through the Strait of Hormuz is a chief example of this. It raised the cost of oil, gas, petrochemicals, fertilizers, plastics, and transport, and fuel and petrochemical inputs run through nearly every goods supply chain.
The first-round effects appeared in gasoline, diesel, jet fuel, utilities, and freight. Refined-product prices can rise by more than crude oil because the barrel must still be processed, moved, stored, and delivered in the right product mix and location. When refinery outages or reduced runs constrain conversion capacity, refiners cannot quickly turn additional crude into diesel, jet fuel, or gasoline the market needs; limited flexibility to shift yields can make shortages especially acute in one product.
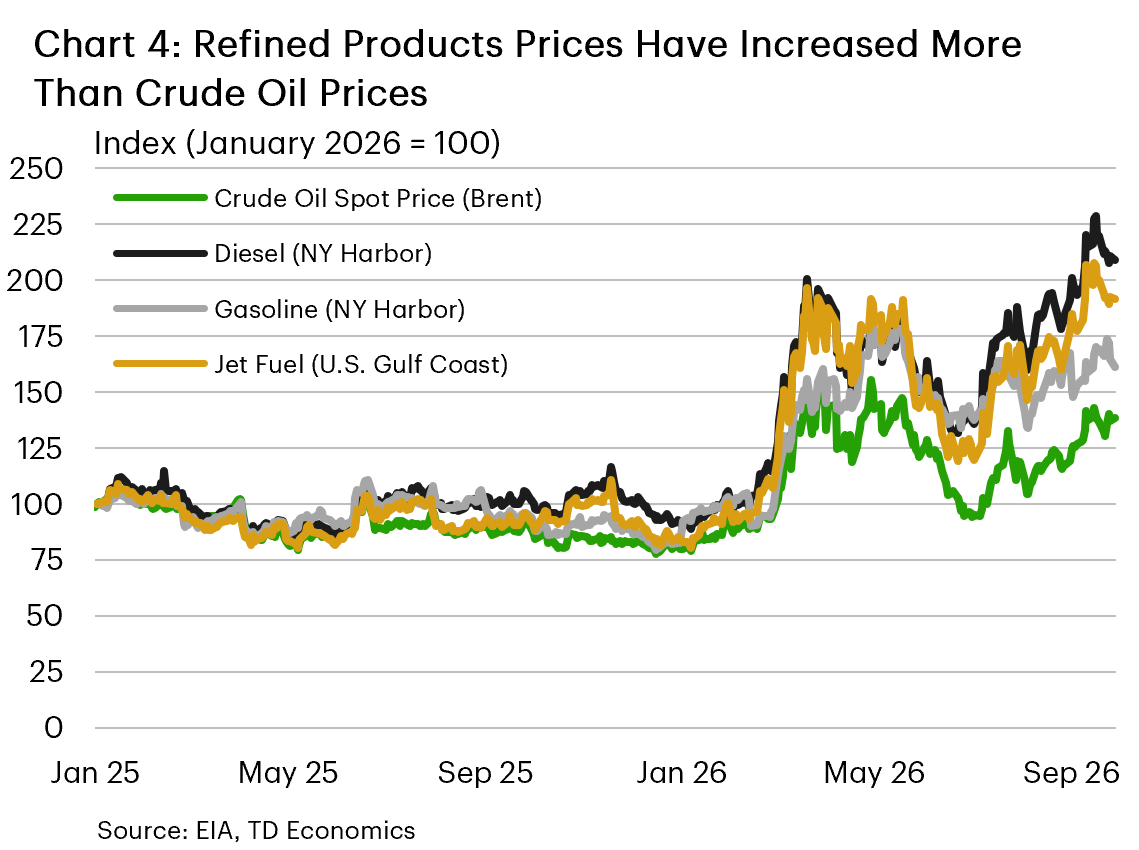 Low inventories then leave less buffer, while disrupted shipping lanes, longer voyages, scarce tanker capacity, higher insurance, and constrained pipelines or terminals raise the cost of moving fuel between regions. Storage also has limits: tanks may be unavailable, in the wrong location, or unsuitable for a required grade, so local prices must rise enough to attract replacement supply. These refining and logistics frictions widen the margin between crude and finished fuels, explaining why Chart 4 shows refined-product prices rising by more than crude oil alone would imply, which we also discuss in our earlier report here. Higher fuel and freight costs then spread to food production, packaging, chemicals, construction materials, and manufactured goods, while plastics and fertilizer prices add a further channel from the same energy shock.
Trade policy is another manifestation of geopolitical fragmentation, with tariffs the most prominent example. Rather than constraining physical supply through blocked routes or damaged capacity, they raise the landed cost of imports and encourage firms to reorganize where and how goods are produced. Companies diversify suppliers, hold more inventory, duplicate production, and move some activity closer to customers. These steps improve security of supply, but they sacrifice some of the scale, specialization, and just-in-time efficiency that held down goods prices during the globalization era. Trade diversion and profit margins can soften the initial impact. Firms may switch to lower-tariff suppliers, reroute goods, or temporarily absorb higher costs. But these offsets are limited and often come with added sourcing, compliance, insurance, and transport expenses.
We spotlight three specific goods categories, totaling around US$1.5 billion in U.S. imports in 2025, to illustrate how tariffs may contribute to higher costs even as they reduce the tariffed exporter’s market share. Chart 5 compares changes in China’s share of U.S. imports with changes in average U.S. import unit values for three product categories subject to tariffs imposed on Chinese goods under Section 301 of the Trade Act of 1974. In all three categories, the share of imports from China declined while average U.S. import unit values increased.
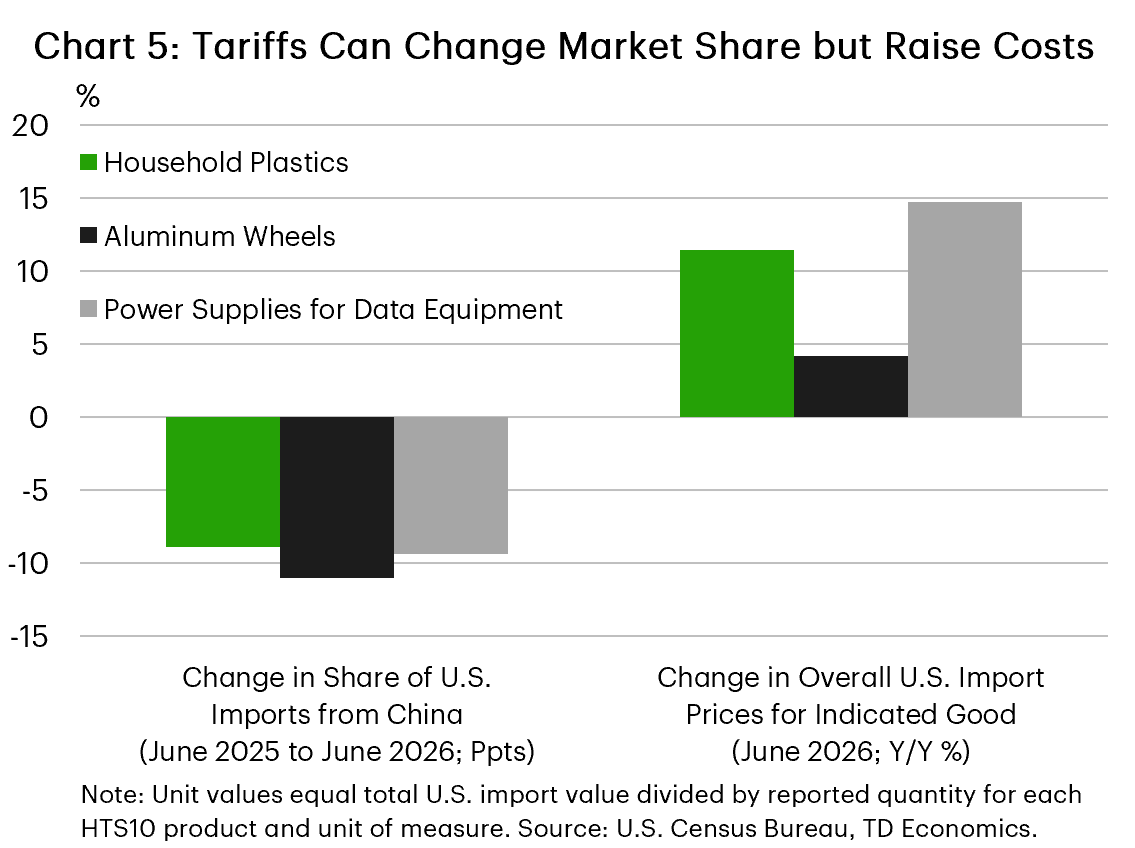 Household plastic articles saw China’s share fall by nearly 9 percentage points while average unit values increased 11.5%. China had been a large, low-cost hub, supplying nearly two-thirds of U.S. imports of these goods. Smaller producers had to expand to meet existing demand and likely could not do so at the same prices.
 - Aluminum road wheels experienced an 11-point decline in China’s share alongside a 4.2% increase in unit values. Compared with household plastic goods, aluminum road wheels are a more specialized industrial product, with tighter quality requirements and greater integration into downstream production.
- Power supplies for data-processing equipment recorded a 9-point loss in Chinese market share even as average unit values climbed almost 15% and overall U.S. imports increased. Strong AI-related demand may also have placed upward pressure on prices for these products, making it difficult to separate the effects of tariffs and trade diversion from broader market conditions. But tariffs likely amplified price pressures that would otherwise have emerged from strong demand.
These patterns are consistent with alternative suppliers not fully replicating China’s combination of scale, cost efficiency, and production capacity. Sourcing appears to have shifted toward higher-cost products or suppliers, although changes in quality and product mix may also have raised average unit values. These examples illustrate that tariffs can successfully redirect trade flows while the associated reorganization of supply chains raises sourcing, logistics, compliance, and production costs. Trade diversion is consequently an additional channel through which inflationary pressure is transmitted.
As contracts reset and inventories are replenished, more of those costs are likely to reach final prices. The result is a goods-price inflation environment that is more volatile and vulnerable to renewed upward shocks. That change matters for central banks because it removes part of the cushion that previously offset sticky services inflation.
A Harder Last Mile for Central Banks
Taken together, these forces point to a less favorable goods-inflation environment than developed-market central banks faced late in the previous tightening cycle. From 2023 through 2025, flat or falling goods prices helped offset persistent increases in rents, wages, and other services. That arithmetic allowed headline and core inflation to fall even while services inflation remained above target. If goods inflation is now modestly positive, the same services reading will produce a higher overall inflation rate (Chart 6).
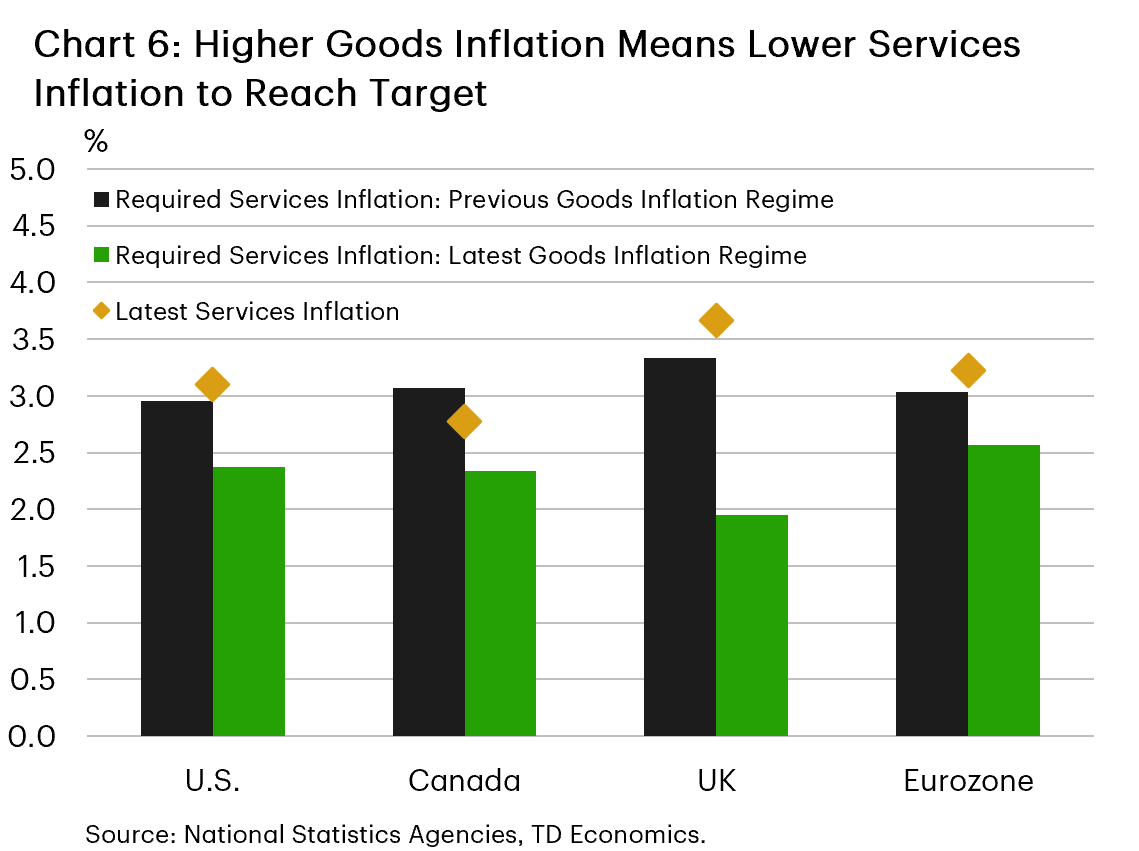 The arithmetic is especially clear. In past periods, including the last cycle, overall inflation could sit near target even with services inflation close to 3% because goods prices provided an offset. If goods inflation contributes positively over the medium term, services inflation must slow further for overall inflation to settle sustainably at target. The same principle applies in Europe, although the recent pressures in services inflation differ. This hurdle poses the largest challenge to price stability in the UK and the U.S., while it is more modest for Canada and the eurozone.
This shift strengthens the case for policy rates to remain higher for longer than they otherwise would. Goods prices can respond relatively quickly to changes in commodity costs, supply chains, and global demand. Services prices move more slowly and depend more heavily on domestic wages because services are generally more labour-intensive. With less disinflation coming from goods, central banks must rely more on slower wage growth and softer labour demand to bring services inflation down. That process is gradual and usually requires restrictive policy to remain in place for longer, limiting the scope for rapid rate cuts.
The broader implication is that the pre-pandemic assumption of persistently low goods inflation is no longer a safe guide. China’s upstream price cycle has turned, AI investment is tightening selected technology inputs, and geopolitical fragmentation is raising the recurring cost of energy and supply-chain resilience. These pressures will not lift every goods category at once, but they make goods inflation higher and more vulnerable to shocks. With less help from traded-goods prices, the final stage of disinflation will be harder and the scope for rapid rate cuts more limited.
Tables
Table 1: Critical AI-Related Goods See
Concentrated Supply and High Import Reliance
| Product Group | Exporter Concentration | Global Exports (USD Billions) | Import Reliance | ||||
| Canada | U.S. | European Union | United Kingdom | Japan | |||
| Permanent Magnets (aka Rare Earth Metals) |
77% | $5 | |||||
| Computer Chips | 58% | $913 | |||||
| Chipmaking Equipment | 56% | $131 | |||||
| Lithium-ion Batteries | 70% | $117 | |||||
| Power Transformers | 42% | $29 | |||||
| Chemical Fertilizers | 36% | $96 | |||||
| Raw Plastics | 34% | $331 | |||||
| Refined Copper and Copper Wire | 37% | $121 | |||||
| Legend | Lower | Higher | |||||
Disclaimer
This report is provided by TD Economics. It is for informational and educational purposes only as of the date of writing, and may not be appropriate for other purposes. The views and opinions expressed may change at any time based on market or other conditions and may not come to pass. This material is not intended to be relied upon as investment advice or recommendations, does not constitute a solicitation to buy or sell securities and should not be considered specific legal, investment or tax advice. The report does not provide material information about the business and affairs of TD Bank Group and the members of TD Economics are not spokespersons for TD Bank Group with respect to its business and affairs. The information contained in this report has been drawn from sources believed to be reliable, but is not guaranteed to be accurate or complete. This report contains economic analysis and views, including about future economic and financial markets performance. These are based on certain assumptions and other factors, and are subject to inherent risks and uncertainties. The actual outcome may be materially different. The Toronto-Dominion Bank and its affiliates and related entities that comprise the TD Bank Group are not liable for any errors or omissions in the information, analysis or views contained in this report, or for any loss or damage suffered.
Download
Share: