U.S. Gasoline Prices: Squeezing Out Every Cent of Decline
Thomas Feltmate, Director & Senior Economist | 647-983-5499
Date Published: August 8, 2022
- Category:
- US
- Commodities & Industry
Highlights
- At their peak, gasoline prices had risen over 50% alongside the sharp spike in oil prices following the onset of the Russia-Ukraine war.
- While prices at the pump have turned lower in recent weeks, structural factors including reduced U.S. refining capacity and increased U.S. exports will likely keep a higher floor on prices.
- Our current forecast assumes WTI hangs near current levels of $85-$90 per barrel through the remainder of this year, which will push the price of gasoline down a bit further to $4 per-gallon, where we expect it to remain through the rest of this year.
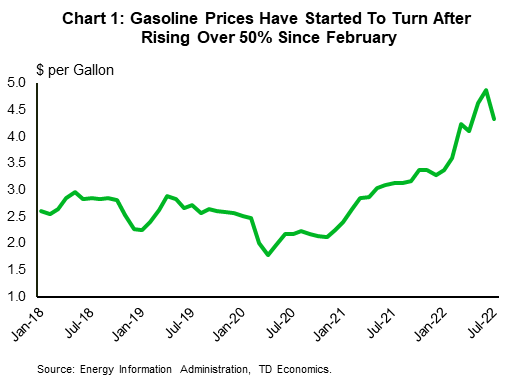
Gasoline prices have been grabbing headlines over the last several months, and rightfully so. At their peak, prices had risen over 50% alongside the sharp spike in oil prices following the onset of the Russia-Ukraine war (Chart 1). However, more recently oil has turned sharply lower – falling by over 25% – while prices at the pump have been slower to come down. It's only in the last few weeks that consumers started to see some reprieve, with the AAA regular gasoline price measure down about 17%.
Gasoline prices are one of the few things that are posted on large signs in clear view, so consumers are constantly reminded of the rising price pressures they're facing on a daily basis. The fact that prices have come down more slowly, and by less than oil has been a point of frustration for many. However, history tells us that this recent "dichotomy" isn't atypical. Gasoline prices have always been quick to move higher when oil jumps, but far slower to follow oil on the way back down. In fact, the asymmetric pricing in fuel prices has become so apparent in recent decades that economists have coined the phenomenon as "rockets & feathers". The main reason for the disconnect stems from market pricing power. When input prices rise, retail gasoline operators' incentives are aligned to raise prices accordingly to preserve margins. On the flipside, when wholesale prices fall, each station can boost its margin by passing on the cost reductions more slowly. In fact, it is not until customers engage in the timely and costly search of finding those stations that offer the lowest possible price that competitive market pricing is eventually restored.
Undoubtedly, we are seeing some of those market dynamics currently playing out. However, there are other factors that will likely keep fuel prices higher than what the historic WTI-gasoline elasticity may otherwise suggest – at least over the near-term.
Factors Keeping Prices Elevated
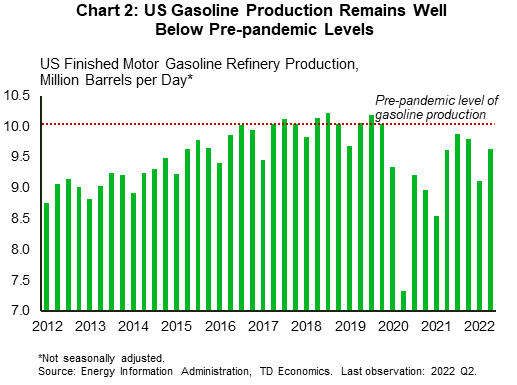
U.S. refining capacity has struggled to get back to pre-pandemic levels because several major refineries have since closed permanently (Chart 2). Estimates suggests that these closures alone have shaved about 5% or 1 million barrels per-day (Mbpd) from U.S. refining capacity. At the same time, several other plants have been temporarily shut down due to hurricane damage and/or retooling for conversions to produce more renewable fuels. Moreover, there are multiple other refineries currently sitting idle (accounting for 1% or 125,000 bpd of gasoline production), having never reopened since shutting down during the early stages of the pandemic.
Unfortunately, the outlook for petroleum refining is unlikely to improve. America is undergoing an energy transition from fossil fuels to renewables. The investment required to either build new refineries or bring back idled plants is so costly, it simply doesn't make economic sense for companies to make those investments. To make matters worse, the refineries that are currently operational are already running near full capacity. Estimates from the Energy Information Administration (EIA) suggest plants are at about 95% capacity. This means there's little, if any, scope to boost production of gasoline or even other refined petroleum products such as propane or jet-fuel.
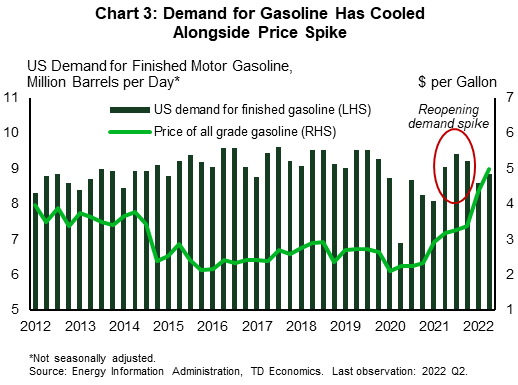
The sluggish recovery in refined product supply has been magnified over the last year by a surge in demand as the U.S. economy reopened (Chart 3). Pent-up demand for vacations, visiting family and friends and increased commuting and business travel resulted in gasoline demand briefly returning to pre-pandemic levels earlier this year. Indeed, we have since seen some pullback in gasoline demand, as higher inflation and rising interest rates have combined to not only slow consumer spending on goods but has also forced households to curtail spending on discretionary services. Consumers have also countered the higher prices at the pump by driving less, and in some cases, switching to more fuel-efficient vehicles.
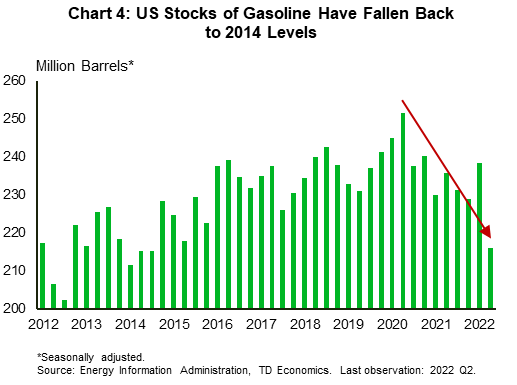
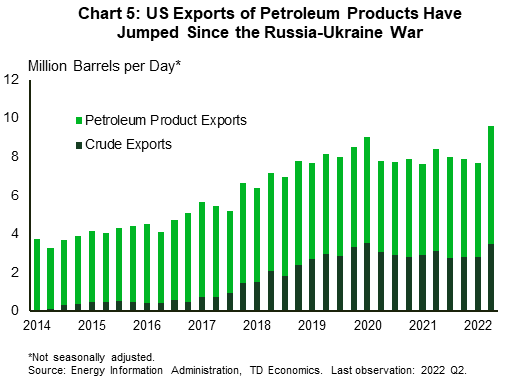
As of June, U.S. production of gasoline sat at just over 9.6 Mbpd, while demand was closer to 8.9 Mbpd. Yet, even with refineries operating in surplus territory, the total stock of gasoline has steadily fallen since early-2022, and now sits at the lowest level since September-2014 (Chart 4). The disconnect stems from increased exports. Since the onset of the Russia-Ukraine war, the U.S. has been exporting increasingly more crude and refined petroleum products to both Europe and Latin America. In fact, exports of refined products have increased by over 1 Mbpd since February of this year – over half of which is gasoline – leading to a meaningful drawdown in gasoline inventories (Chart 5).
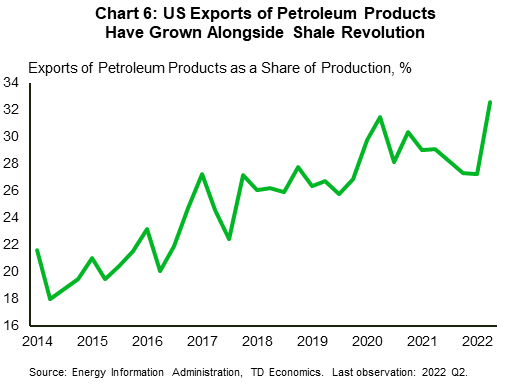
Some have started to call on the Biden Administration to consider a temporary ban on fuel exports in an effort to restore balance in the domestic market. While sound in theory, the move may not have the impact most are hoping for. In recent years, the U.S. has become the world's biggest exporter of refined petroleum products – shipping over 6 Mbpd. Exports of refined products accounted for 28% of total production last year. Temporarily removing such a large share of refiner's demand stream would almost certainly lead to production cuts, ultimately having minimal impact on overall prices (Chart 6).
So Where Does That Leave Us?
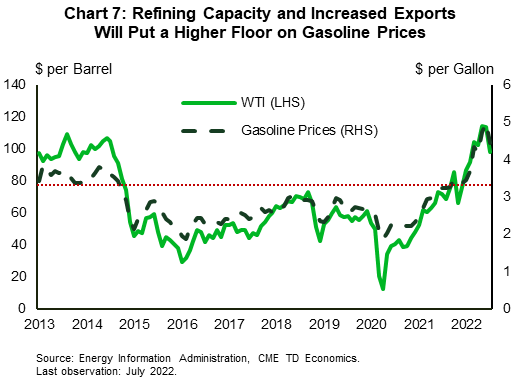
Gasoline prices have already started to come down alongside oil, but the disconnect between WTI and gasoline remains. Back in late-2013, when oil was trading around today's levels of $90-$95 per-barrel, retail gasoline was selling for $3.30 per gallon (Chart 7). Today, that same gallon costs almost a dollar more. This spread is unlikely to narrow much further thanks to both structural changes in the refining landscape as well as increased demand for U.S. petroleum exports. Our current baseline forecast assumes the price of WTI hangs near current levels of $85-$90 per-barrel through the remainder of this year, before drifting a bit lower in 2023 – reaching $80 by year-end. While this will put further downward pressure on gasoline prices over the near-term, prices at the pump will likely level off around $4 per-gallon this year and move only modestly lower ($3.50-$3.75) in 2023.
There are no shortage of risks to this forecast. For starters, a demand-side shock resulting from a U.S. recession would certainly put further downward pressure on oil prices. And given the recent migration of risks, such a scenario cannot be ruled out. In fact, this is the main reason why we have seen some giveback in oil prices more recently. U.S. economic growth has disappointed, recession risks have grown and markets have repriced accordingly. At this point, the only reason oil hasn't moved even lower is because of the abundance of supply-side risks which have put a higher floor on today's oil prices. Of those, perhaps the biggest source of uncertainty stems from the fact that both the U.S. and UK are set to join the EU in imposing a ban on insurance services for ships carrying Russian oil. Without insurance, Russian oil producers will struggle to find carriers willing to ship their product, leading to further supply shortages and renewed upward pressure on oil prices. The U.S. Treasury is trying to preemptively circumvent this issue by having G7 nations and other big buyers of Russian oil impose a price cap on future Russian exports. In doing so, Russian producers would be able to maintain access to shipping insurance, though would be forced to sell oil at a price heavily discounted relative to the market prevailing price. At this point, nothing has been formalized. And with the insurance ban slated to take full effect by December, time is of the essence. That said, even under the optimistic scenario where countries agree on a price cap, there's no guarantee that Russia would comply. In fact, a more plausible scenario is Russia would instead retaliate by taking oil off the market, knowing it would lead to further market turmoil.
Another wildcard is the upcoming hurricane season. With gasoline inventories 10% (or 200,000 barrels) below their five-year seasonal average, and refineries already running near full capacity, unforeseen outages due to storms would likely lead to further spikes in gasoline prices. This was exactly the case last year when Hurricane Ida temporarily removed more than 3 Mbpd of refining capacity for several weeks. The EIA estimates that the outage lifted gasoline prices by as much as 10 cents per-gallon across some parts of the country. Keep in mind, that was in a more balanced market. An outage of that magnitude under today's supply constrained conditions would likely lead to a much bigger spike in prices. The U.S. National Oceanic and Atmospheric Administration predicts that there will be anywhere from 14-21 named storms this coming season. Odds are at least one of them will be powerful enough to cause production disruptions.
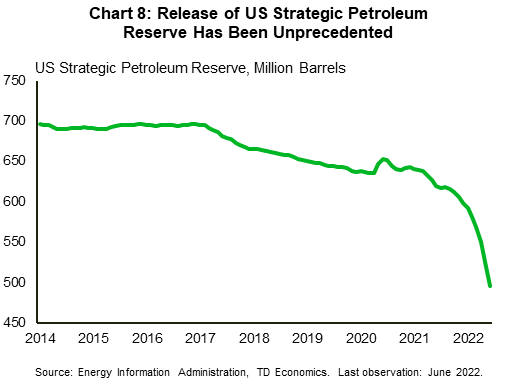
Lastly, both oil and gasoline prices have been held temporarily lower because of the release of strategic reserves by both the U.S. and International Energy Agency (Chart 8). While the U.S. has conducted emergency drawdowns of its Strategic Petroleum Reserves (SPR) before, the current arrangement is the largest ever. The combined international agreements will result in an estimated 260M barrels of supply released to the global market by October. Its impact on prices can't be understated. The U.S. Treasury estimated that the combined effect of the reserve releases reduced gasoline prices by as much as 42 cents per-gallon! While financial markets tend to be forward looking, there's a chance market participants are discounting the idea that there won't be further releases in reserves or a near-term boost in global production. Absent that happening, we could see oil prices move higher over the coming months.
All that to say, there are no shortage of risks on the horizon that could again put upward pressure on oil prices. Indeed, rising odds of a global recession have been the most recent catalyst to push oil prices lower. However, even after discounting for potential demand destruction, the price of oil is currently trading around its pre-war level – highlighting the sizeable risk-premia currently attributed to the supply-side risk factors. While the recent pullback in prices at the pump is certainly a welcome development for consumers, odds are the floor on gasoline prices will be much higher over the near-term than the historical WTI-gasoline demand elasticity would suggest. As a result, gasoline consumption will continue to demand a higher share of household's income, robbing funds that could otherwise be used for other discretionary purchases.
End Notes
- Dallas Federal Reserve, "Crude Oil and Gasoline Prices: An Asymmetric Relationship?" (https://www.dallasfed.org/~/media/documents/research/er/1998/er9801a.pdf)
- IEA, Press Release IEA confirms member country contributions to second collective action to release oil stocks in response to Russia's invasion of Ukraine (https://www.iea.org/news/iea-confirms-member-country-contributions-to-second-collective-action-to-release-oil-stocks-in-response-to-russia-s-invasion-of-ukraine)
- U.S. Energy Information Administration, Hurricane Ida disrupted crude oil production and refining activity (https://www.eia.gov/todayinenergy/detail.php?id=49576)
- U.S. Treasury, The Price Impact of the Strategic Petroleum Reserve Release (https://home.treasury.gov/news/press-releases/jy0887)
Disclaimer
This report is provided by TD Economics. It is for informational and educational purposes only as of the date of writing, and may not be appropriate for other purposes. The views and opinions expressed may change at any time based on market or other conditions and may not come to pass. This material is not intended to be relied upon as investment advice or recommendations, does not constitute a solicitation to buy or sell securities and should not be considered specific legal, investment or tax advice. The report does not provide material information about the business and affairs of TD Bank Group and the members of TD Economics are not spokespersons for TD Bank Group with respect to its business and affairs. The information contained in this report has been drawn from sources believed to be reliable, but is not guaranteed to be accurate or complete. This report contains economic analysis and views, including about future economic and financial markets performance. These are based on certain assumptions and other factors, and are subject to inherent risks and uncertainties. The actual outcome may be materially different. The Toronto-Dominion Bank and its affiliates and related entities that comprise the TD Bank Group are not liable for any errors or omissions in the information, analysis or views contained in this report, or for any loss or damage suffered.
Download
Share: