Florida's Housing Market Cooling After Hot Pandemic Run
Admir Kolaj, Economist | 416-944-6318
Date Published: September 1, 2022
- Category:
- US
- Real Estate
- State & Local Analysis
Highlights
- Home prices in Florida are up 58% from the start of the pandemic, leaving an already strong national showing (+40%) in the dust. However, recent data confirm that Florida's housing market is no exception to the broader housing trends observed across the country, with home sales in the state down 25% year-to-date and price growth turning negative.
- The combination of rapid home price gains during the pandemic and this year's surge in mortgage rates has taken a heavy toll on housing affordability. The steep erosion in the latter suggests that the recent softening in Florida's housing market is likely to continue. Other factors contributing to this narrative include expectations for slower job growth and some easing in the inflow of out-of-state buyers.
- While the erosion in housing affordability can draw comparison to the period preceding the last housing crash, other important factors including the supply pipeline of new units, better lending standards and improved household balance sheets, point to a relatively less severe outcome this time around.
- Our base-case projection calls for a peak-to-trough decline of 10-15% in Florida home prices between the second quarter of this year and mid-2023. A contraction of this scale would pare back part of the pandemic gains, but still leave prices 35-to-42% above pre-COVID levels.
Recent housing market data leave little to doubt that America's housing market is losing steam quickly following a very strong performance during the pandemic. At the national level, existing home sales are down 26% from the start of the year. Meanwhile, price growth has cooled considerably, with the median seasonally adjusted home price pulling back in both June and July. The smaller (and more volatile) new single-family home market shows even more weakness, with sales down 40% from the start of the year and the months' supply of inventory surging near the highest levels on record. These trends are in large part a response to the sharp increase in interest rates through the first half of this year, which took a sad song – that of an already-challenging housing affordability environment – and made it worse.
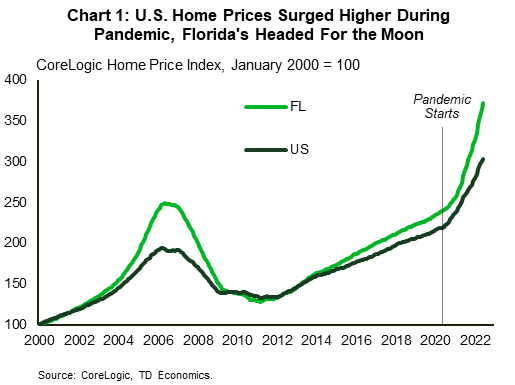
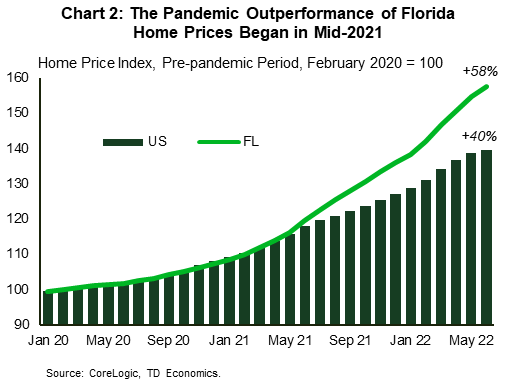
Based on the CoreLogic measure, home prices shot up across all states during the health crisis, but performances varied, ranging from milder increases of 10% and 18% (relative to the pre-pandemic period) in D.C. and New York State respectively, to over 60% in Arizona. Florida's housing market, which contended with an influx of residents from other parts of the country, ran hotter than most (Chart 1). Home prices in the Sunshine State are up 58% from the start of 2020 – the second strongest showing behind Arizona, leaving the national gains (+40%) in the dust. Note that Florida's outperformance in price growth vis-à-vis the nation is something that has developed only in the past twelve months or so (Chart 2).

The rapid price gains of the past two years bring to memory the frenzied housing market of the early 2000s, although in annualized growth terms, the pandemic run-up in home prices has actually been faster than the growth experienced during the early 2000's (Chart 3). During the housing boom of the early2000's, home prices in Florida surged by 150% in a span of six years versus a milder 90% nationally. However, the hangover from the Global Financial Crisis (GFC) was similarly outsized for the Sunshine State, with home prices crashing roughly 50% peak-to-trough in a span of about four and a half years, versus 30% nationally. With the housing market now slowing and some price retrenchment on deck, it is important to consider how Florida's housing market will fare through the remainder of this year and into 2023. Will it follow a similar pattern and underperform the national, or will it hold up better this time around? We believe that despite some concerning metrics, especially around affordability, several mitigating factors should help prevent a similar painful outcome as that suffered during the last housing crash. However, we certainly see scope for home prices in Florida to head lower and pare back part of their pandemic gains in the quarters ahead.
Florida's Housing Market is Turning the Page
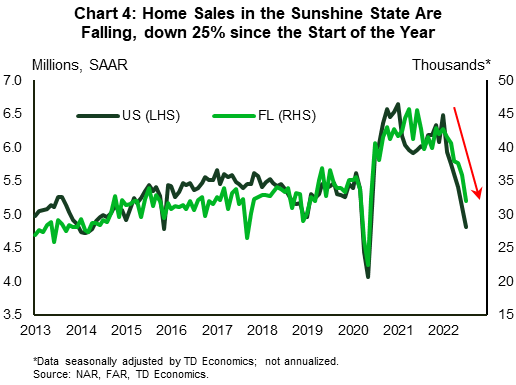
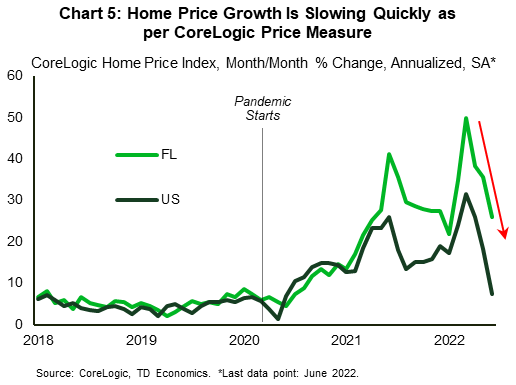
Florida's housing market is no exception to the broad housing trends observed across the country recently and is cooling too. Home sales activity has headed lower over the last several months, mimicking what we've seen at the national level (Chart 4). As of July, home sales in the Sunshine State were down about 25% from the start of the year. Price growth, while still strong in year-over-year terms, is also decelerating quickly – a trend echoed by several home price measures (Chart 5).
Signs of softness are also seeping through to the rental market. Available market data show that rental vacancy rates for multifamily units have increased moderately across many parts of the state relative to their pandemic lows. At the same time, rent growth, while still in double digit territory (year-on-year), is losing steam quickly across many urban centers, including Jacksonville and Naples where the trend has been relatively more pronounced.
More Weakness in the Cards
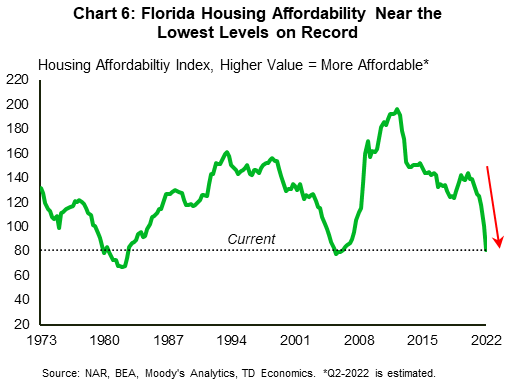
Several indicators suggest that the softening trend in Florida's housing market is poised to continue in the quarters ahead. Key among these is the sharp deterioration in housing affordability. Florida's housing affordability index has deteriorated by an estimated 42% (vs. 34% nationally) relative to the level recorded at the fourth quarter of 2019, and now stands at the lowest level since mid-2006 (Chart 6). This is among the worst showings in recorded history with data stretching back to the 1970s. Up until the start of this year, the strong run-up in home prices, which outstripped income growth by a large degree, was the key driver behind the deterioration in affordability. Over the last several months, however, surging mortgage rates have played a more central role.
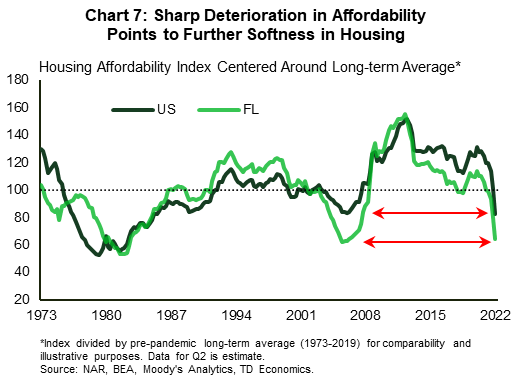
The deviation in Florida's housing affordability index from its long-term historical trend points to a similar deterioration to that preceding the GFC. This time around, however, the deterioration has happened much more quickly. What's more, similar to the pre-housing crash period, the worsening of conditions in Florida is more pronounced than nationally (Chart 7). Ultimately, this sharp pullback in affordability means that fewer prospective buyers will find homeownership attainable under current conditions. A reduced pool of buyers, in turn, points to additional sales weakness in the months and quarters ahead.
One factor that can help lead to improved homebuying conditions is the potential for some giveback in mortgage rates. The inspiration for this comes from the fact that thirty-year mortgage rates eased a bit over the summer, falling from 5.8% toward the end of June to around 5.1% in the first half of August. However, factoring this into the affordability metric over the near-term does not meaningfully reverse the steep deterioration that has occurred over the last several quarters. This suggests that the support from the recent pullback in rates will be limited in scope. More importantly, given our view of a softish landing, we don’t anticipate any significant additional relief in 30-year mortgage rates over the near-term. In fact, rates have already migrated higher to around 5.5% most recently. Overall, this means that low affordability is likely to remain a key challenge to higher housing activity for some time. What's more, with prices for many other goods and services projected to continue rising at an above-average clip ahead, hot inflation outside of the 'shelter' component is poised to continue biting at consumers' wallets too, further challenging households from a financial perspective. We eventually expect housing to find some better footing in the second half of 2023 and early 2024 – a period when we anticipate a mild downtrend in mortgage rates.
Previous Accelerator Factors to Lose Some of their Luster
Some of the factors that helped supercharge activity in Florida's housing market over the recovery phase are also expected to lose some of their luster. Job growth in Florida has continued to run at an impressive rate of 6% annualized pace in recent months (thanks in part to a very strong outturn in July). However, with the labor force participation rate already above its pre-pandemic peak, and the labor market already very tight – the unemployment rate sits at 2.7%, the same low level as before the pandemic – job growth is poised to slow in the year ahead. We anticipate job growth to decelerate to a 2-3% pace later this year and further below this range later in 2023 as the regional and national economies cool.
The inflow out-of-state buyers is also likely to abate. The are several reasons for this:
- An above-average erosion in housing affordability is a key factor. Before the pandemic, purchasing a home in Florida may have entailed a steep discount relative to many other areas across the region and country. With price growth during the pandemic the second strongest behind only Arizona, that dynamic has changed. For example, home prices in areas like the New York metro (up 20% from February 2020), where a large contingent of out-of-state buyers came from last year, have grown much more gently over the pandemic period compared to Florida (+58%), leading to some meaningful erosion in the affordability 'premium' that existed before the pandemic. The strong run-up in mortgage rates this year is also poised to be a hurdle for existing homeowners looking to unload their out-of-state property and buy into the Florida market, because doing so would likely mean facing a much higher mortgage rate compared to that on their existing property.
- Eased COVID-19 restrictions are likely to play an added role on this front. With virtually all areas across the country now wide open for some time, the perceived advantage of moving to Florida earlier in the pandemic to indulge in fewer COVID restrictions has been wiped out.
- Finally, the state's homeowner insurance crisis, marked by high and growing costs (insurance premiums in Florida are nearly three times the national average) is likely an added factor that may put off some would-be buyers at the margin.
- To be clear, the net inflow of out-of-state buyers in Florida is still expected to remain positive, supported by the many other advantages that the state may offer (i.e., better weather, no state income tax, etc.), but it is likely to slow. Redfin data suggest that this trend may already be taking a foothold in Miami. While the latter remains a very popular destination, fewer out-of-state homebuyers are now looking to move to Magic City compared to a year earlier (see here).
Sunshine State Due for Retrenchment in Home Prices
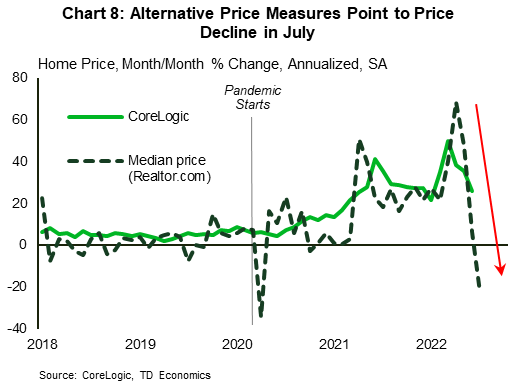
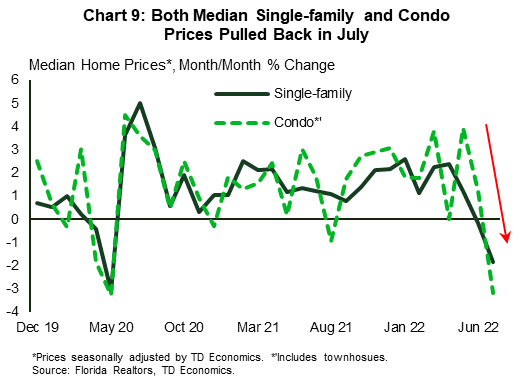
According to the CoreLogic price measure, home price growth continued to run at a double-digit (annualized) rate in Florida as of June, but it did cool meaningfully compared to the March-April period (refer back to Chart 5). Other timelier price measures point to even more weakness (Chart 8 and 9). These dynamics are expected to extend further, with home price growth in the Sunshine State projected to trend into negative territory over the next few quarters. Underpinning this view is the fact that alongside expectations for a less supportive demand, more inventory is expected to hit the market in the months ahead. Active listings in the Sunshine State have increased notably over the last several months (Chart 10). Digging deeper into the data reveals that a growing share of listings are showing reductions in the listing price.
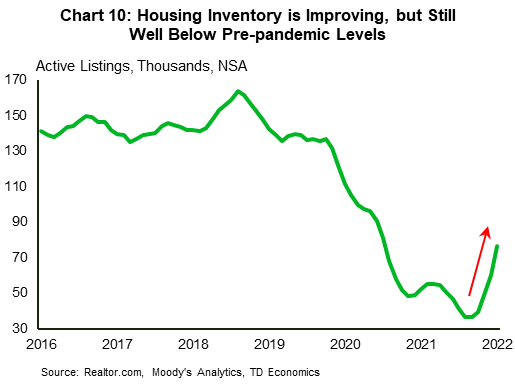
Similar to the national picture, the recent increase in housing inventory in Florida is largely the result of sellers deciding to list their properties amidst a weakening housing market. Following an unexpectedly strong pandemic run that has significantly bolstered owners' equity positions, and weakening price expectations ahead, the last few months have offered an incentive for sellers to try and realize gains. Financially stretched investors, especially those carrying variable debt, are also likely to have added to the tally. Florida is a very popular market among real estate investors, so we expect this feature to continue playing a role in driving up inventories as economic growth slows. The arrival of new units to market will also play a role in boosting inventory as more construction projects are completed, but as we explain in the upcoming section, the resulting negative impact on prices should be less pronounced this time around.
All told, altered supply-demand conditions are poised to favor some pullback in home prices in the Sunshine State. Our base-case projection calls for a peak-to-trough drop of 10-15% between the second quarter of this year and mid-2023.
Several Factors Should Limit the Downside
The upper end of the expected pullback in Florida home prices (-15%) would imply roughly double the peak-to-trough contraction that we anticipate for home prices nationally. Even a contraction in the 10-to-15% range would still leave Florida home prices well above pre-pandemic levels – respectively 42% and 35% higher. At first glance, this may seem to be at odds with sharp deterioration in affordability that resembles the days preceding the housing crash. There are three main distinctions to highlight between the two periods, all of which should help significantly limit the downside this time around.
First and foremost is the labor market backdrop. The current challenges on the demand side represent a squeeze on affordability from rising interest rates and the sharp increase in prices. This is different from the severe negative pressures that occurred during the Great Recession as a result of widespread job losses and the accompanying negative feedback loop between the housing sector and the labor market. Recall that our outlook for Florida is for slower but still positive job growth ahead. However, should the national and state economies enter a more pronounced downturn than what's currently anticipated, this is one factor that would mark some more downside risk for the forecast.
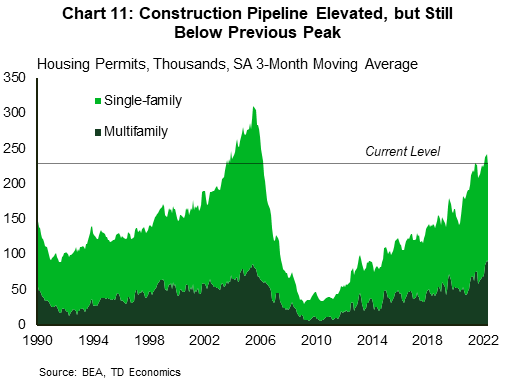
Second is construction activity. The pace of homebuilding, while elevated is still below pre-Great Recession levels in nominal terms (Chart 11). More importantly, is it further below the previous peak when adjusted for population, with the state's population now roughly 20% larger compared to 2006. The delays in bringing product to market, as a result of labor shortages and supply chain disruptions, will help limit some of downside pressures in the near-term. In addition, given the underbuilding that followed the last housing crash, housing inventories in Florida, while rising recently, are doing so from much lower levels. This should help limit the potential for housing inventories to reach highly excessive levels.
Finally, lending standards over the last several years have been much tighter than what they were in the early 2000s. This means that homeowners should have a better ability to hang on to their properties and avoid distressed selling than in the past. The fact that households are currently carrying much lower debt levels relative to incomes versus the pre-GFC period, should also help in this regard.
All of these mitigating factors are not to say that some areas within the state won't experience outsized price declines. As a rule of thumb, those areas that have seen the sharpest deteriorations in affordability, have a lot of residential inventory in the pipeline and have an outsized investor presence are at greater risk or recording more pronounced price declines as conditions weaken.
Bottom Line
Housing market data show that the Sunshine state is no exception to the recent cooling that has gripped the overall U.S. housing market as a result of a steep deterioration in housing affordability. The latter foretells a continuation of the weakening sales trend. Amidst the reduced demand backdrop and increasing inventories, home prices are also expected to give back some portion of their pandemic gains.
Several important factors sit in much better place today than they did in the last housing market crash – the supply pipeline of new units, lending standards, household leverage and a still decent near-to-medium term labor market outlook – all of which should help limit the downside this time around. Our base-case forecast calls for Florida home prices to fall between 10 and 15% peak-to-trough between the second quarter of this year and mid-2023. This would still leave prices well above pre-pandemic levels. The potential for the economic outlook to deteriorate much more than currently anticipated remains a downside risk.
Disclaimer
This report is provided by TD Economics. It is for informational and educational purposes only as of the date of writing, and may not be appropriate for other purposes. The views and opinions expressed may change at any time based on market or other conditions and may not come to pass. This material is not intended to be relied upon as investment advice or recommendations, does not constitute a solicitation to buy or sell securities and should not be considered specific legal, investment or tax advice. The report does not provide material information about the business and affairs of TD Bank Group and the members of TD Economics are not spokespersons for TD Bank Group with respect to its business and affairs. The information contained in this report has been drawn from sources believed to be reliable, but is not guaranteed to be accurate or complete. This report contains economic analysis and views, including about future economic and financial markets performance. These are based on certain assumptions and other factors, and are subject to inherent risks and uncertainties. The actual outcome may be materially different. The Toronto-Dominion Bank and its affiliates and related entities that comprise the TD Bank Group are not liable for any errors or omissions in the information, analysis or views contained in this report, or for any loss or damage suffered.
Download
Share: