U.S. Financial Markets Getting Stressed Out
James Orlando, CFA, Director & Senior Economist | 416-413-3180
Brett Saldarelli, Economist | 416-542-0072
Date Published: June 2, 2022
- Category:
- US
- Financial Markets
Highlights
- Financial markets have experienced a bout of volatility over 2022, as investors digested the compounding impact of
emerging geopolitical risks, high inflation, and rising interest rates. - We track a number of indicators, including equity markets, credit spreads, and global currencies to compare the current
risk-off event with historical episodes. - Though volatility over the last few months has been significant, the current episode is more closely aligned with historical
instances of economic growth recalibration rather than an outright recession.
Talk of recession has dominated news headlines. Whether it be the rise in food and fuel prices that is bringing back memories of the 1970s and 80s, or the fear that the Fed will make a policy error as it executes on the fastest hiking cycle since 1994, the risks to the global economy and financial markets have risen swiftly. Thus far, we have seen equities flirt with bear market territory, bond yields rise sharply, and major global currencies tumble versus the safe-haven U.S. dollar.
The most obvious area of market stress is within equity markets, as the S&P 500 suffered a peak-to-trough decline of 18.7% over 2022. Though the decline has been swift, it parallels recent episodes of financial market corrections that were not followed by recessions (Table 1). Both the 2018 trade war and 2015 oil price shock, where the S&P 500 declined by 19.8% and 14.2%, respectively are similar in magnitude to the recent performance of the S&P 500. Strong comparisons can also be drawn to the Asian Financial Crisis of 1998 and the Sovereign Debt Crisis of 2011. The former saw multiple stock indexes in Asia decline by more than 60%, which led to losses in the S&P 500 of 19.3%. Similarly, during the Sovereign Debt Crisis, economic uncertainty surrounding highly indebted European economies resulted in the S&P 500 declining by 19.4%. The point here is that there are numerous instances where equities have sold-off to a similar extent as what has occurred over the last few months without a U.S. recession.
Table 1: Historic S&P 500 Declines
| Non-Recessions | ||||
| Year | Peak-to-trough, %, Closing Value | Date of Peak | Date of Trough | Number of Days Between Peak and Trough |
| 1933 | -33.9 | 18/07/1933 | 14/03/1935 | 604 |
| 1962 | -28.0 | 12/12/1961 | 26/06/1962 | 196 |
| 1966 | -22.2 | 09/02/1966 | 07/10/1966 | 240 |
| 1987 | -33.5 | 25/08/1987 | 04/12/1987 | 101 |
| 1998 | -19.3 | 17/07/1998 | 31/08/1998 | 45 |
| 2011 | -19.4 | 29/04/2011 | 03/10/2011 | 157 |
| 2015 | -14.2 | 21/05/2015 | 11/02/2016 | 266 |
| 2018 | -19.8 | 20/09/2018 | 24/12/2018 | 95 |
| 2022 | -18.7 | 03/01/2022 | 19/05/2022 | 136 |
Table 2: Historic S&P 500 Declines
| Recessions | ||||
| Year | Peak-to-trough, %, Closing Value | Date of Peak | Date of Trough | Number of Days Between Peak and Trough |
| 1929 | -86.2 | 16/09/1929 | 08/07/1932 | 1026 |
| 1937 | -54.5 | 10/03/1937 | 31/03/1938 | 386 |
| 1945 | -6.9 | 07/03/1945 | 26/03/1945 | 19 |
| 1948 | -20.6 | 15/06/1948 | 13/06/1949 | 363 |
| 1953 | -14.8 | 05/01/1953 | 14/09/1953 | 252 |
| 1957 | -20.7 | 15/07/1957 | 22/10/1957 | 99 |
| 1960 | -13.4 | 05/01/1960 | 25/10/1960 | 294 |
| 1970 | -36.1 | 29/11/1968 | 26/05/1970 | 543 |
| 1973 | -48.2 | 11/01/1973 | 03/10/1974 | 630 |
| 1980 | -17.1 | 13/02/1980 | 27/03/1980 | 43 |
| 1981 | -27.1 | 28/11/1980 | 12/08/1982 | 622 |
| 1990 | -19.9 | 16/07/1990 | 11/10/1990 | 87 |
| 2001 | -49.1 | 24/03/2000 | 09/10/2002 | 929 |
| 2008 | -56.8 | 09/10/2007 | 09/03/2009 | 517 |
| 2020 | -33.9 | 19/02/2020 | 23/03/2020 | 33 |
In fact, when recessions have occurred, the decline in equity markets has been much more severe. Over the last three recessions (2020, 2008, and 2001), the average stock market decline was -47%, with a range of -33.9% to -56.8% (Table 2). We would have to go back to the Federal Reserve’s pre-inflation targeting regime to find periods were equities declined less than 20% during a recession.
Specifically, we would highlight the recessions in 1980 and 1990, where the S&P 500 declined by 17.1% and 19.9%, respectively. Though we are forced to go back quite far to pull this comparison, both time periods were plagued by significant increases in inflation and commensurately high policy rates from the Federal Reserve. Though these instances are important to note, the high inflation time period of the 1970s and 1980s saw four different recessions. When we strip-out the 1980 sell-off, the average equity market decline over those recessions was a substantial -37%. All told, comparing the level of stress in financial markets today to past episodes does not yet indicate an economy on the brink of recession.
The U.S. Dollar is Up, But Less Than in Past Recessionary Episodes
Financial market volatility is apparent in foreign exchange markets, which have generally seen the U.S. dollar appreciate against the currencies of its major trading partners (Chart 1). The trade-weighted greenback is up 4.6% versus advanced economy currencies (over 2022). This appreciation compares to an average of 14.6% during the last three U.S. recessions.
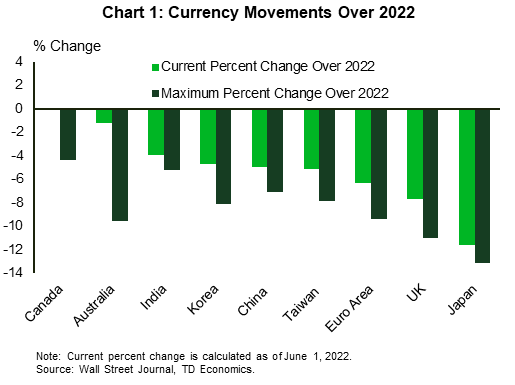
The most noteworthy move has been against the Japanese yen, which has depreciated by 11.6% against the U.S. dollar so far this year, with a peak-to-trough decline of 13.1%. Historically, the yen has been a safe haven in times of financial turmoil, appreciating by 29.2% during the Global Financial Crisis and 19.6% over the European Sovereign Debt Crisis. However, with the Bank of Japan’s relative dovishness and the economy’s reliance on energy imports, the yen has lost favor in the minds of traders.
Furthermore, the euro has depreciated by 6.4% over 2022, with the currency hitting a low of 1.04 USD/EUR. This depreciation is much less than the 18.9% experienced during the Sovereign Debt Crisis. Given the uncertainty surrounding the economic outlook in Europe, talk of the euro going to parity is rising which would require a further 6.6% depreciation. Elsewhere, the British pound has depreciated by 7.7% this year (peak-to-trough 11.0%), which is greater than the 8.3% percent during the Sovereign Debt Crisis. The recent depreciation pales in comparison to the pound’s 17.9% depreciation in the wake of the Brexit referendum.
Credit Spreads Have Not Deteriorated as Much as Equity Prices
The volatility inherent in equity markets over the first half of the year has not been fully transmitted to corporate credit spreads. Spreads have moved higher from the start of the year, but remain well below the levels reached over recent episodes of financial stress, including the 2020 global pandemic, the 2015 oil price shock, and the 2011 Sovereign Debt Crisis. Moreover, spreads are in line with their long-run averages (Chart 2). In the investment grade space, the BBB spread has increased by 63 basis points to 1.70%, only 22 basis points off its average over the last 10 years.
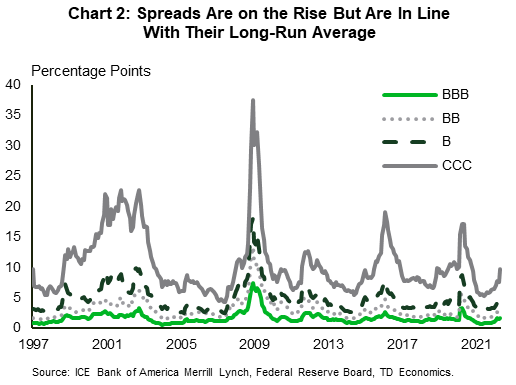
More notable increases can be found in the non-investment grade space. The CCC spread has increased by 320 basis points to 9.64%, while the single-B spread has risen by 130 basis points to 4.53%. Even still, both spreads are 89 and 42 basis points below their historical averages.
Across the pond, a different story is emerging. Credit default swaps have been trending upwards since the beginning of the year and currently rest above their long-run averages. The iTraxx Crossover Index, which is comprised of non-investment grade firms had recently jumped to levels that were on par with the 2015 oil price shock, though they still remain at lower levels that what occurred during the European Debt Crisis.
Bottom Line
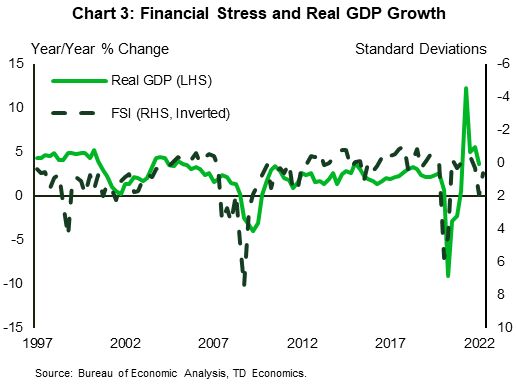
Taking all of the financial market movements together, our Financial Stress Index shows that the current stress is a one standard deviation event (Chart 3). Though the index is elevated compared to history, it does not yet point to an imminent recession. In fact, the index is still below the levels of the Sovereign Debt Crisis, the trade war of 2018, and recent recessions.
What the index does point to is a slowing in economic growth. With inflation elevated, interest rates rising, and markets under stress, this argues for economic growth below 2% over the second half of 2022 and into 2023. Though it doesn’t point to recession yet, a further deterioration in markets or another shock to the global economy should be closely monitored, as the economic buffer to handle any additional adverse events is eroding.
Disclaimer
This report is provided by TD Economics. It is for informational and educational purposes only as of the date of writing, and may not be appropriate for other purposes. The views and opinions expressed may change at any time based on market or other conditions and may not come to pass. This material is not intended to be relied upon as investment advice or recommendations, does not constitute a solicitation to buy or sell securities and should not be considered specific legal, investment or tax advice. The report does not provide material information about the business and affairs of TD Bank Group and the members of TD Economics are not spokespersons for TD Bank Group with respect to its business and affairs. The information contained in this report has been drawn from sources believed to be reliable, but is not guaranteed to be accurate or complete. This report contains economic analysis and views, including about future economic and financial markets performance. These are based on certain assumptions and other factors, and are subject to inherent risks and uncertainties. The actual outcome may be materially different. The Toronto-Dominion Bank and its affiliates and related entities that comprise the TD Bank Group are not liable for any errors or omissions in the information, analysis or views contained in this report, or for any loss or damage suffered.
Download
Share: