U.S. Financial Conditions: Tighter, But Not Tight
Thomas Feltmate, Director & Senior Economist | 416-944-5730
Paul Kim, Economic Analyst
Date Published: November 3, 2026
- Category:
- U.S.
- Financial Markets
Highlights
- U.S. financial conditions have tightened but remain accommodative by historical standards, with the recent move driven mainly by higher market volatility.
- Economy-wide credit remains readily available despite widening corporate spreads, with no signs of tighter bank lending standards.
- Our baseline assumes one more Fed hike by year-end, followed by an extended pause. If financial conditions fail to tighten further and growth and inflation remain firm, additional hikes may be needed.
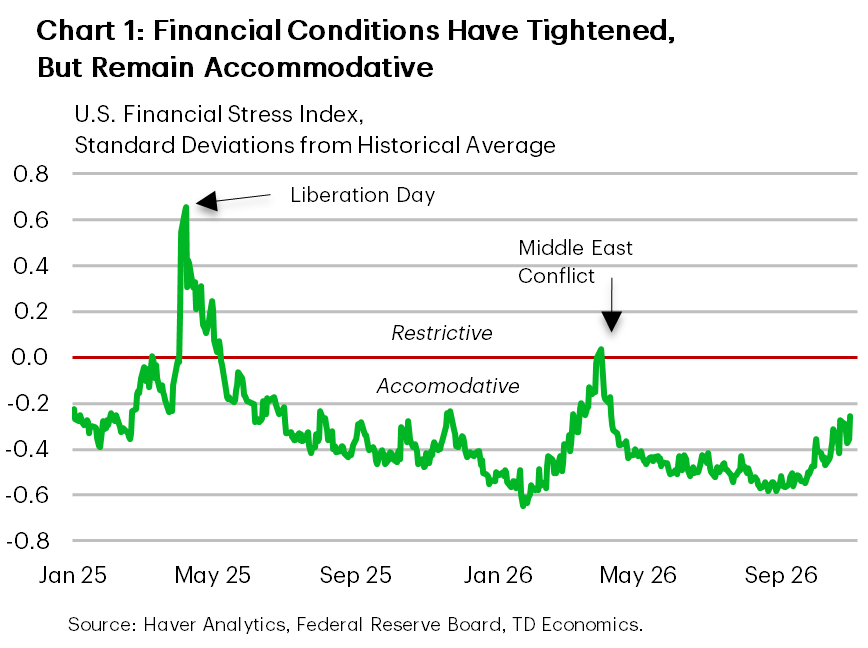
U.S. financial conditions have tightened in recent weeks, though they remain loose by historical standards. At current levels, we estimate that overall financial conditions are roughly one-third of a standard deviation below its historical average (Chart 1). The key watchpoint, however, is not the level but the shift in sentiment. Treasury yields have risen sharply in recent months as stronger growth prospects, persistent inflation pressures, and higher oil prices have prompted investors to reassess the outlook for Federal Reserve policy. The repricing on short-term rates has weighed on equities, particularly small-cap stocks, interest-rate-sensitive sectors, and parts of the AI and semiconductor complex. At the same time, concerns about AI valuations have resurfaced as investors scrutinize the economics of data-center construction, chip demand, and AI infrastructure financing. Credit conditions, by contrast, have tightened only modestly: investment-grade and non-investment-grade corporate spreads have widened by 10-20 and 90 basis points, respectively, but remain low by historical standards
How we measure financial stress
There is no shortage of metrics for assessing financial conditions, but individual indicators can be volatile and may provide conflicting signals. A principal component approach helps address these limitations by combining information from a broad range of market indicators into a single summary measure. In simple terms, the principal component identifies the co-movement—or “common factor”—across the underlying variables that explain the largest share of their overall variation. The resulting index is designed to capture the underlying degree of systemic stress while filtering out idiosyncratic movements in any one segment of the market.
Our financial stress index (FSI) draws on twelve variables spanning corporate credit spreads, household funding conditions, bond and equity market volatility, and an estimate of the term premium on the U.S. 10-year Treasury1. The common factor extracted from these measures is standardized so that a reading of zero corresponds to average historical conditions, with readings above or below zero expressed as standard deviations from that norm.
Viewed over the past several years, financial conditions have remained notably accommodative, apart from a brief tightening around Liberation Day and the risk-off episode that followed the onset of the Middle East conflict. Since January 2025, our FSI has averaged roughly one-third of a standard deviation below its historical norm—close to its current level. This period of relatively loose conditions coincided with an easing bias from the Federal Reserve and a significant AI-driven repricing in equity markets.
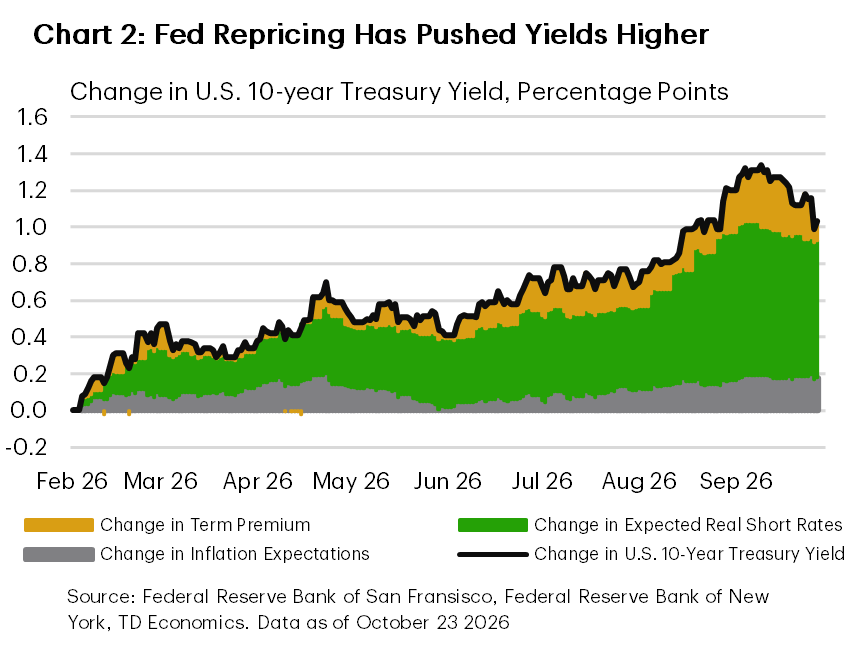
More recently, persistent inflation pressures, the lingering effects of the oil shock, and signs of firmer economic activity have prompted a hawkish shift in the policy outlook. Markets have moved from pricing two Federal Reserve rate cuts by year-end to anticipating an additional 50 basis points of tightening by September 2027. This repricing of the near-term policy path has been the principal driver of the rise in longer-term Treasury yields (Chart 2). However, because the level of Treasury yields is not generally viewed as a clean measure of financial stress, it doesn’t enter FSI measures directly. Instead, its effects are captured indirectly through higher household and corporate borrowing costs and any resulting impact on equity valuations.
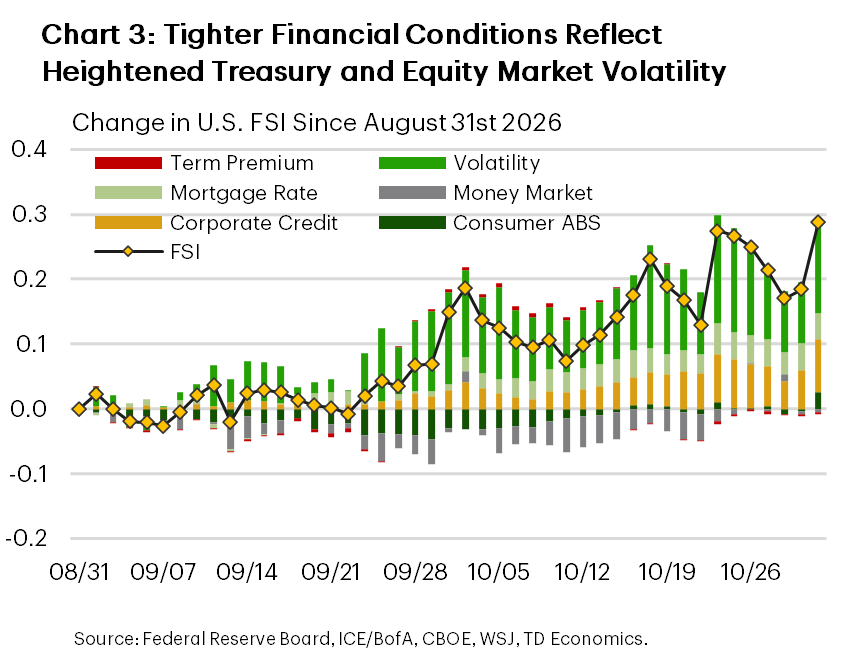
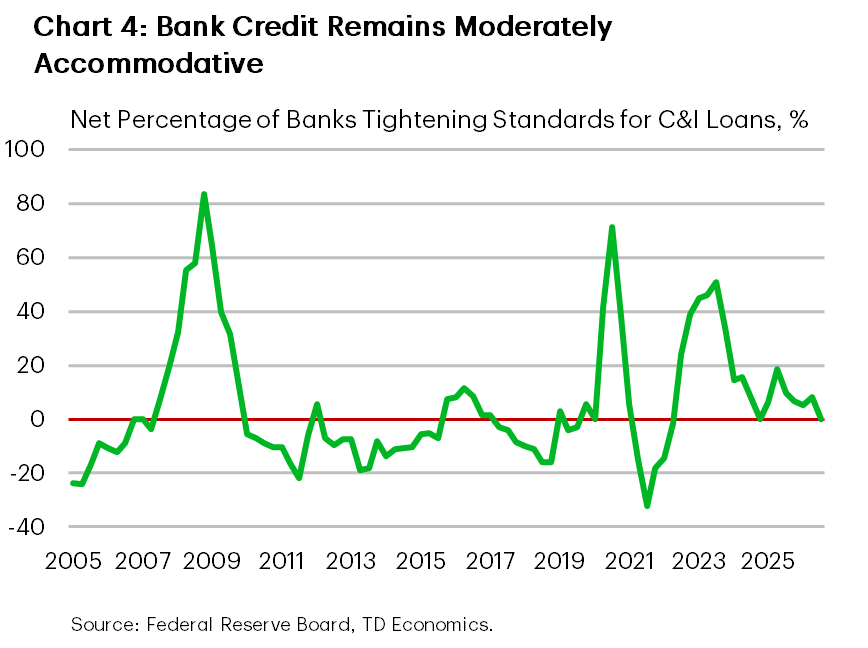 Over the past two months, our FSI has risen from a low of -0.6 to -0.3 as of October 30th, pointing to a modest tightening in financial conditions. A decomposition of the index shows that two-thirds of the move reflects higher volatility in equity and bond markets, as measured by the VIX and MOVE indexes, respectively (Chart 3). The remainder is attributable to some widening in credit spreads, although both investment-grade and non-investment-grade corporate spreads remain relatively tight by historical standards—suggesting credit availability from a capital-markets standpoint remains quite accommodative. Importantly, banks aren’t pulling back either. According to the Federal Reserve’s Senior Loan Officer Survey, C&I lending standards are currently easier than the midpoint of their historical range since 2005 (Chart 4). The key takeaway is that the recent tightening has been primarily driven by greater uncertainty rather than by the level of interest rates itself. That uncertainty spans several factors, including the outlook for inflation and growth, fiscal deficits, Treasury supply, and the future path of monetary policy.
Why this tightening cycle may be different
Past tightening cycles show that financial conditions do not move in lockstep with the policy rate (Chart 5). During the post-pandemic cycle, the lower bound of the federal funds rate rose from 0% in early 2022 to 5.25% by July 2023, while our FSI increased by 0.2 points to 0.4, moving above its historical average. Much of the tightening reflected wider spreads on consumer asset-backed securities—particularly those backed by credit-card and auto loans—and the sharp rise in the 30-year fixed mortgage rate.
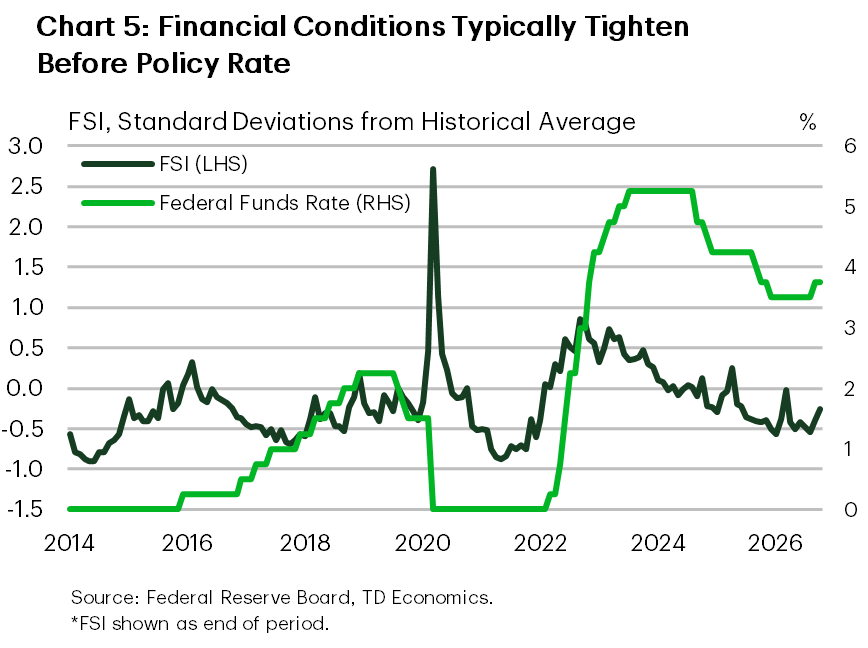 Because longer-term borrowing costs reflect the expected path of short-term rates, a hawkish shift in Fed expectations can tighten financial conditions before any policy move. Indeed, our FSI rose sharply ahead of the first post-pandemic rate hike as markets priced a rapid increase in the policy rate. Equity and Treasury-market volatility accounted for a significant share of the move, underscoring the importance of expectations in shaping financial conditions.
Financial conditions peaked around the regional-banking turmoil in March 2023 and began easing before the policy rate reached its peak. The Fed delivered three additional hikes, but conditions became increasingly accommodative as the economy remained resilient and earnings expectations improved. The 2015–18 normalization cycle followed a similar pattern: much of the tightening occurred near the start of the cycle and gradually reversed even as the Fed continued to raise rates.
Those episodes may not be a reliable guide to the current cycle. In each case, Fed tightening began from highly accommodative settings as stronger growth created room to normalize policy. Today’s shift is a sharp reversal from easing, with policy already restrictive. It also coincides with unusually strong private-sector demand for capital and mounting concerns about global debt, which have kept yields elevated. Although credit spreads remain narrow by historical standards, their recent widening suggests investors are demanding greater compensation for refinancing and debt-service risks as borrowing costs remain high.
The central questions are how high rates will need to rise and how long they will need to remain elevated. The answers will ultimately depend on the evolution of the data, particularly the extent to which tighter financial conditions slow demand and alleviate underlying inflation pressures. Our baseline forecast assumes one more hike by year-end, followed by an extended pause. Implicit in the outlook is a further tightening in financial conditions, helping to ease demand-side pressures and bring inflation back toward the Fed’s 2% target. But if that doesn’t materialize and the incoming data instead point to continued economic resilience and persistent inflation pressures, additional rate hikes may be required, extending the tightening cycle.
End Notes
- The Financial Stress Index includes twelve variables: corporate bond spreads (A-rated, BBB-rated, and non-investment-grade bonds relative to the 10-year U.S. Treasury); securitized credit spreads (credit-card and auto-loan ABS relative to the 5-year Treasury, and MBS relative to the 10-year Treasury); financial and non-financial commercial paper spreads; the 30-year fixed mortgage spread; the 10-year Treasury term premium; and equity- and Treasury-market volatility (VIX and MOVE, respectively).
Disclaimer
This report is provided by TD Economics. It is for informational and educational purposes only as of the date of writing, and may not be appropriate for other purposes. The views and opinions expressed may change at any time based on market or other conditions and may not come to pass. This material is not intended to be relied upon as investment advice or recommendations, does not constitute a solicitation to buy or sell securities and should not be considered specific legal, investment or tax advice. The report does not provide material information about the business and affairs of TD Bank Group and the members of TD Economics are not spokespersons for TD Bank Group with respect to its business and affairs. The information contained in this report has been drawn from sources believed to be reliable, but is not guaranteed to be accurate or complete. This report contains economic analysis and views, including about future economic and financial markets performance. These are based on certain assumptions and other factors, and are subject to inherent risks and uncertainties. The actual outcome may be materially different. The Toronto-Dominion Bank and its affiliates and related entities that comprise the TD Bank Group are not liable for any errors or omissions in the information, analysis or views contained in this report, or for any loss or damage suffered.
Download
Share: