Don't Expect Any Further Boost to
Spending from Covid-Era Excess Deposits
James Marple, Senior Economist, AVP | 416-982-2557
Faisal Faisal, CFA, Manager, Economic Risk | 416-983-1738
Date Published: March 6, 2024
- Category:
- U.S.
- Financial Markets
- Consumer
Highlights
- A sharp rise in household deposits in the aftermath of the pandemic has supported U.S. consumer spending over the past two years.
- The impulse to spending from 'excess deposits' is now in the rear-view mirror. For most income groups, deposits are at or below their pre-pandemic trend. While deposits are still elevated for the highest income quintile, these households are the least likely to spend them.
- Rising policy rates and slowing inflation have led to a sharp increase in 'real' (inflation adjusted) deposit rates. Deposit rates on terms of three months and longer have seen the greatest increases. Higher interest rates further reduce the likelihood that remaining 'excess deposits' are spent.
- Even as the Federal Reserve begins cutting interest rates later this year, term deposit rates are likely to remain above inflation and continue to gain market share, keeping this pool of saving from turning into spending.
Generous fiscal stimulus, expansive monetary policy, and reduced spending due to lockdowns led to a sharp increase in personal deposits in the aftermath of the Covid-19 pandemic. From the fourth quarter of 2019 through to the first quarter of 2022, households added a combined $5 trillion to checking and saving deposits, a staggering 54% increase.1 These deposits were a key source of the strength observed in consumer spending and the resilience of economic growth over the past two years.
Since hitting this peak in 2022, household deposits have fallen by $1.5 trillion (or 10%), but remain about $1 trillion above the pre-pandemic trend.2 Scratching beneath the surface, almost all of the remaining excess deposits are held by households in the top 20% income bracket, while more than half are held by the top 1%.3 Research shows that high-income households treat deposits the same as other financial assets and spend very little of them.
At the same time, higher interest rates reduce the likelihood that deposits are spent. The interest rate paid on deposits with terms of three months or more has risen in lockstep with the federal funds rate, which, at 5%, is well ahead of the current inflation rate. The Federal Reserve is likely to begin cutting its policy rate later this year, but only if inflation continues to cooperate. As such, term deposits will continue to earn positive rates of return that encourage saving over spending.
Deposits not so excessive anymore
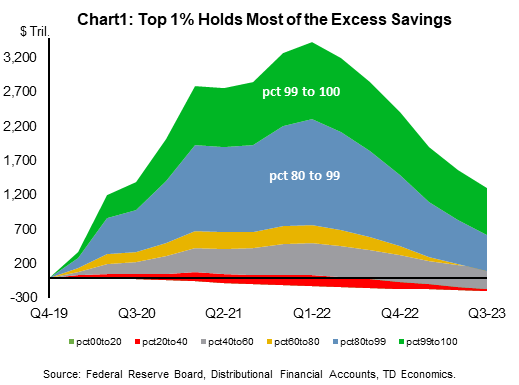
Deposits remain above their pre-pandemic trend, but they are not widely held. Indeed, for the lower half of the income distribution, deposits are below the pre-pandemic trend. Only the top 20% of income earners still hold meaningful above-trend deposits. The biggest gap is with the top 1% of households, which is 30% higher than its pre-pandemic trend. (Chart 1).
For lower income households, targeted fiscal transfers were an important driver of rising deposits. These transitory income supports allowed lower-income households to maintain consumption but, as such, have been drawn down. The increase in deposits for higher income households, on the other hand, was due entirely to a pullback in discretionary spending.4 This foregone consumption represents an increase in household wealth. Research shows that individuals at the top end of the income and wealth spectrum spend very little of any increase in net worth, implying scant additional spending impetus from remaining excess deposits.
Deposit rates above inflation encourage saving over spending
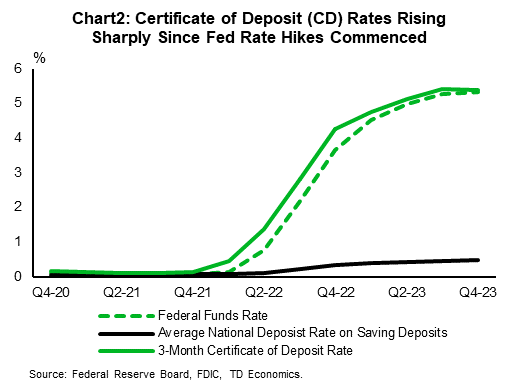
The rise in deposit rates is likely to finish the job of ensuring that what is left of 'excess deposits' remains out of circulation. The increase in interest rates this cycle has been particularly rapid. From the zero-lower bound in February 2022, the federal funds rose to 5.5% in August 2023, where it has remained since. At roughly the same time, inflation has slowed from a peak over 9% to just over 3%. The combination implies a rapid return to positive real deposit rates.
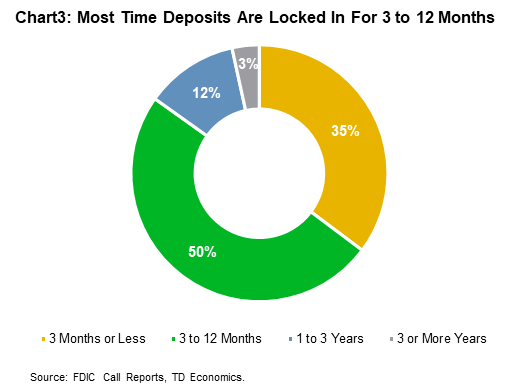
With rates on term deposits moving up in lockstep with the federal funds rate (Chart 2), households have been adjusting their holdings. Large time deposits – accounts with more than $100,000 that pay higher rates the longer the maturity – are up nearly 65% since that first Federal Reserve rate hike. Roughly 50% of these deposits have maturities of three to twelve months, while 15% have maturities of more than one year (Chart 3).5
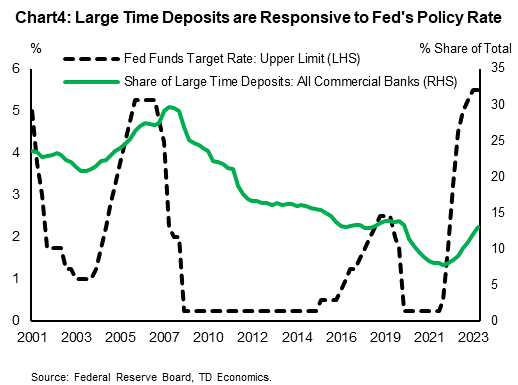
The Federal Reserve is expected to begin cutting interest rates later this year, but not quickly and only if inflation continues to cooperate. As such, term deposits are likely to continue to earn more than inflation. Historically, term deposits continued to gain share well into past rate cutting cycles (Chart 4). There is little reason to think that this time will be any different. This continued shift will further reduce the amount of deposits immediately available for spending.
Bottom Line
The increase in deposits since the pandemic helps explain the resilience in consumer spending over the past two years. This support now appears to be in the rear-view mirror. Remaining excess deposits are held mainly by the top twenty percent of the income distribution who have a very low propensity to spend them. Even as the Federal Reserve begins to lower rates later this year, term deposits will likely continue to pay positive real returns, encouraging households across the income spectrum to lock these savings away.
End Notes
- To put this into context, it took ten years from 2009 to 2019 to achieve the same increase in deposits.
- The amount of excess deposits is sensitive to the sample period covered. Our counterfactual pre-pandemic linear trend covers the 2015 to 2019 period, applied bottom-up on each income bracket.
- Households with income of at least $1.6 million a year in 2020, according to the Congressional Budget Office.
- Batty et al.. "Wealth Inequality & Covid-19: Evidence from the Distributional Financial Accounts." FEDS Notes 2021, (August 30, 2021). https://www.federalreserve.gov/econres/notes/feds-notes/wealth-inequality-and-covid-19-evidence-from-the-distributional-financial-accounts-20210830.html
- Data sourced from quarterly FDIC bank call reports, and aggregated by bankregdata.com.
Disclaimer
This report is provided by TD Economics. It is for informational and educational purposes only as of the date of writing, and may not be appropriate for other purposes. The views and opinions expressed may change at any time based on market or other conditions and may not come to pass. This material is not intended to be relied upon as investment advice or recommendations, does not constitute a solicitation to buy or sell securities and should not be considered specific legal, investment or tax advice. The report does not provide material information about the business and affairs of TD Bank Group and the members of TD Economics are not spokespersons for TD Bank Group with respect to its business and affairs. The information contained in this report has been drawn from sources believed to be reliable, but is not guaranteed to be accurate or complete. This report contains economic analysis and views, including about future economic and financial markets performance. These are based on certain assumptions and other factors, and are subject to inherent risks and uncertainties. The actual outcome may be materially different. The Toronto-Dominion Bank and its affiliates and related entities that comprise the TD Bank Group are not liable for any errors or omissions in the information, analysis or views contained in this report, or for any loss or damage suffered.
Download
Share: