East Coast Metro Housing Affordability: Keeping Score on a Partial Recovery
Admir Kolaj, Economist | 416-944-6318
Date Published: September 1, 2026
- Category:
- U.S.
- Real Estate
- Consumer
- State & Local Analysis
Highlights
- The post-pandemic deterioration in housing affordability was severe. Despite widespread improvement since late 2023, conditions remain strained nationwide and across the 12 East Coast metros examined in this report.
- Miami and New York stand in a class of their own, with estimated mortgage payments accounting for 39% and 36% of median family income, respectively. Boston’s mortgage burden also remains elevated.
- The deterioration that occurred during the pandemic was not confined to the more expensive markets and was especially pronounced for southern metros. Charlotte and Orlando rank furthest below their 2000-2019 affordability norms, with Miami and Atlanta close behind, while Tampa has also lost considerable ground. Others like Baltimore, D.C. and Virginia Beach have held up comparatively better.
- Further improvement will likely be gradual. The Federal Reserve is unlikely to take rates lower anytime soon, keeping long-term rates elevated. This means income growth will need to do most of the work, helped along by the potential for the return of more typical home-price growth.
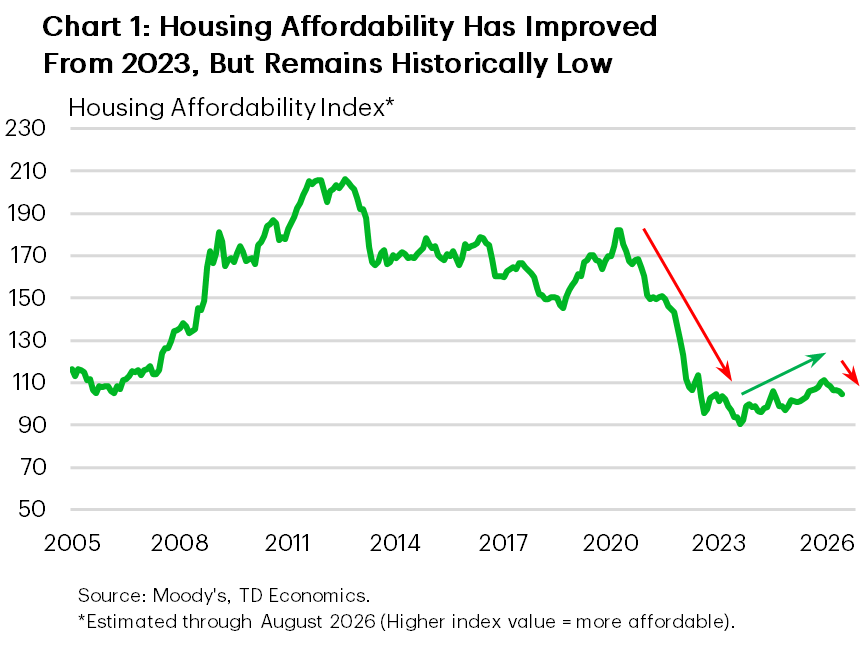
The sharp deterioration in U.S. housing affordability following the pandemic is well documented. Home prices increased rapidly between 2020 and early 2022, while the subsequent sharp rise in mortgage rates delivered a second blow to buyers. Household incomes also increased, but not enough to offset the higher financing burden.
Nationwide affordability has improved somewhat from its 2023 trough, but some of that progress has been unwound alongside the push higher in mortgage rates this summer (Chart 1). The latest national reading remains 17% below its long-term average, 27% below the 2000–2019 average, and 34% below its pre-pandemic level. While the national series is estimated through August, the metro comparisons end in Q2 2026, the latest period available consistently across the full cohort.
The national picture conceals substantial regional variation. Along the East Coast, affordability remains below historical norms, but the severity of the deterioration and pace of the recovery differ substantially across the 12 major East Coast metros examined in this report.
Measuring Affordability
The affordability index used in this report follows a standard approach to assessing whether a family earning the median income can afford the mortgage on a median-priced existing single-family home. The measure assumes a 20% down payment, a 30-year fixed mortgage rate, and a qualifying ratio of 25%, meaning that the principal and interest payment cannot exceed 25% of median family income.
The index extends back to 1973 and allows changes in affordability to be traced to three principal drivers: home prices, family income and mortgage rates. A higher index value indicates improved affordability, while a lower value indicates deterioration.
The analysis places particular emphasis on the 2000 to 2019 average that preceded the pandemic. This period more closely reflects the housing and financing environment households have experienced over the past few decades and captures several distinct phases, including the housing-bubble buildup, the subsequent correction and the pre-pandemic recovery. The full historical average from 1973 remains useful for longer-run context but is arguably less relevant as it includes earlier periods with substantially different inflation and interest-rate environments.
East Coast Metro Housing Affordability Scorecard
Parsing through the numbers of the affordability scorecard in Table 1, four broad conclusions emerge.
- Affordability remains below the two-decade pre-pandemic norm in all 12 metros. Southern metros appear to have been more impacted. Charlotte and Orlando record the largest shortfalls, at 40%, followed by Miami and Atlanta at 39%. Tampa is 36% below this benchmark. Baltimore has held up best, although its affordability index is still 25% below the 2000–2019 average. The full historical comparison offers a slightly different ranking. Miami remains furthest below its long-term average, followed by Charlotte and Orlando. Atlanta, by contrast, fares considerably better against the full historical benchmark than against the 2000–2019 average.
- The post-pandemic deterioration was widespread and severe. At the Q4 2023 trough, affordability ranged from 40% below its pre-pandemic level in Baltimore to 50% below in New York. Tampa, Miami and Atlanta also experienced large declines.
- There has since been a partial recovery. Affordability improved across all 12 metros between late 2023 and the first half of 2026, led by Tampa, Atlanta and Jacksonville. However, the recovery has been much more limited in New York.
- Current mortgage burdens vary substantially. The estimated mortgage payment on a median-priced single-family home ranges from 19% of median family income in Baltimore and Atlanta to 39% in Miami. New York follows at 36%, while Boston’s burden remains elevated at 30%.
Table 1: East Coast Housing Affordability Scorecard
| Housing Affordability Index | Mortgage Payment as a % of Family Income. Latest Level (Q2 2026) |
|||||
| % Change Latest Available Reading (Q2 2026) |
vs. Long-term Avg. (1973-2026) | vs. Pre-pandemic Contemporary Avg. (2000-2019) |
vs. Pre-pandemic Period (Q4-2019) | Post-pandemic Trough (Q4-2023 vs. Q4-2019) |
Recent Recovery (vs. Q4-2023) |
|
| U.S. | -17% | -27% | -34% | -41% | 13% | 22 |
| Boston | -28% | -31% | -42% | -47% | 10% | 30 |
| New York | -28% | -31% | -48% | -50% | 3% | 36 |
| Philadelphia | -21% | -30% | -42% | -46% | 8% | 20 |
| Baltimore | -25% | -25% | -34% | -40% | 9% | 19 |
| D.C. | -19% | -26% | -33% | -42% | 15% | 23 |
| Virg. Beach | -14% | -26% | -36% | -43% | 12% | 20 |
| Charlotte | -34% | -40% | -38% | -45% | 14% | 22 |
| Atlanta | -20% | -39% | -36% | -48% | 22% | 19 |
| Jacksonville | -23% | -34% | -35% | -46% | 20% | 22 |
| Orlando | -33% | -40% | -36% | -46% | 19% | 27 |
| Tampa | -26% | -36% | -35% | -49% | 26% | 23 |
| Miami | -41% | -39% | -40% | -48% | 16% | 39 |
Why Has the Recovery Varied?
Mortgage rates tend to move broadly in tandem across the country. They explain much of the shared deterioration and part of the subsequent recovery, but not why some metros have improved more than others.
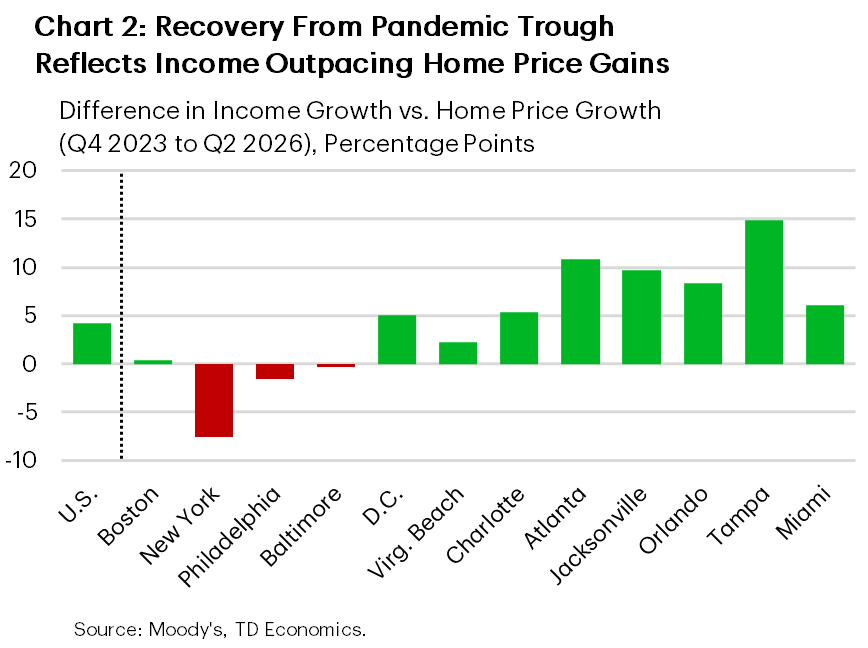
Recent differences are better explained by home prices and income. The strongest recoveries generally occurred where prices flattened or declined while family income continued to rise. Tampa, Jacksonville and Atlanta stand out most clearly on this front, with Orlando showing a similar pattern, but to a lesser degree. By contrast, prices continued to outpace income in New York and Philadelphia (Chart 2, Table 2).
The longer post-pandemic period reveals an even starker contrast. Median single-family home prices are up 82% in New York and 70% in Miami from Q4 2019 to Q2 2026, far outpacing income. Meanwhile, Baltimore and the D.C. metro experienced much smaller price-income imbalances and have held up better as a result.
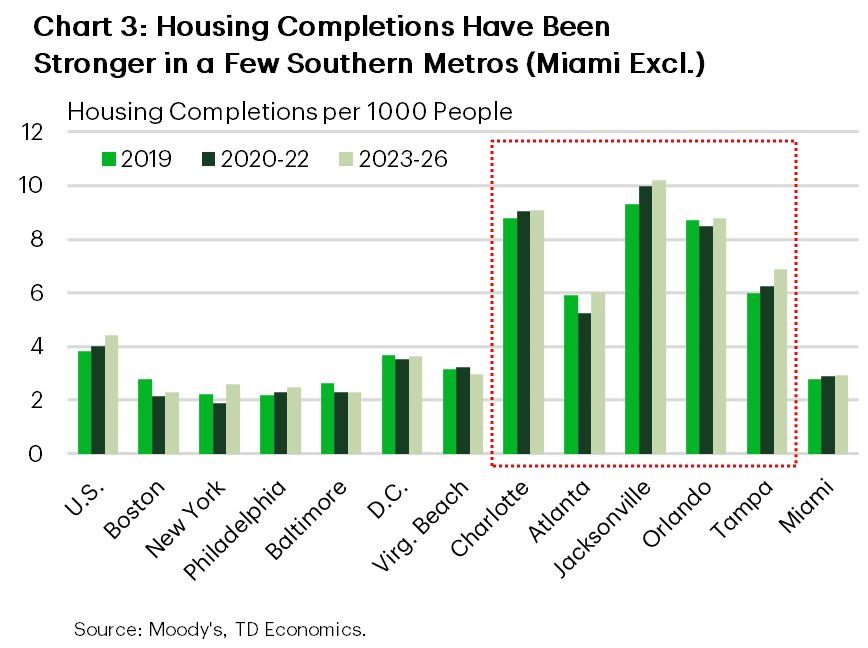
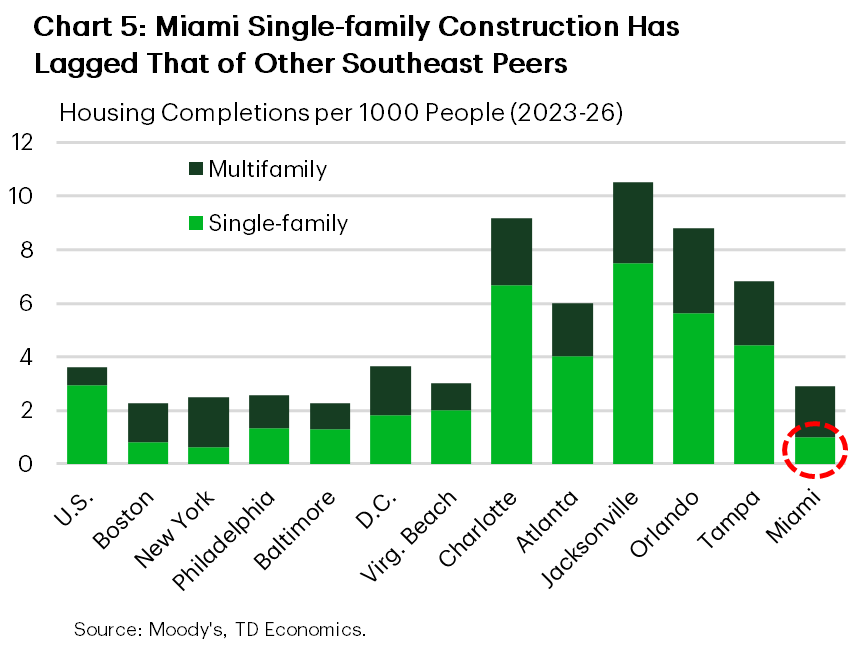
Home construction has also been much stronger relative to population in parts of the Southeast than in the Northeast (Chart 3). Stronger homebuilding can help ease price pressure, although some new supply, particularly multifamily housing, is geared toward the rental market. Existing market slack, migration and household formation also influence the ultimate effect on prices. Nevertheless, the stronger supply response across many Southeast metros has likely provided a larger release valve than in the more constrained Northeast.
Miami: The Lasting Effects of an Outsized Price Shock
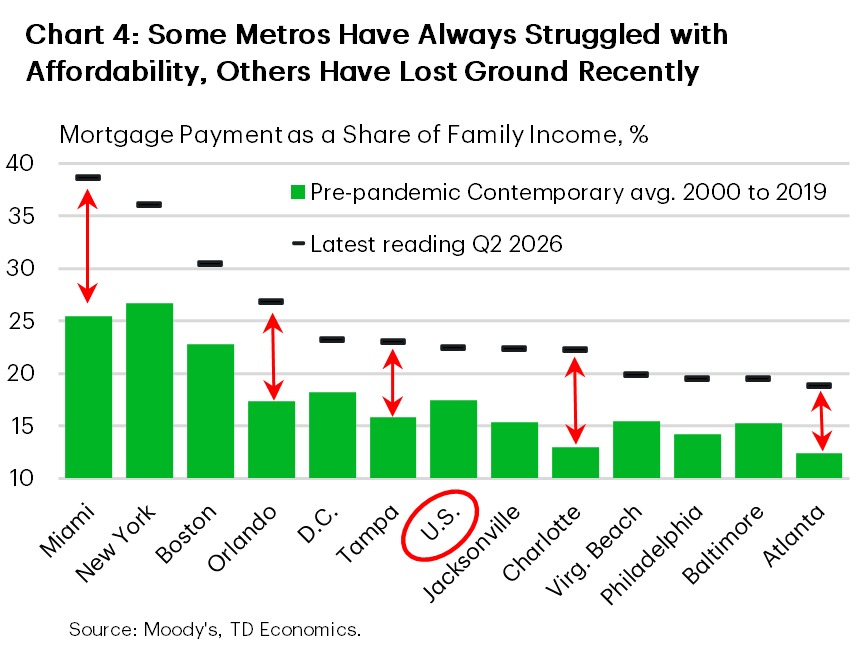
Miami has the highest current mortgage burden in the group, with payments on the median-priced home consuming approximately 39% of median family income. It is also 39% below its two-decade pre-pandemic housing affordability norm and records the largest shortfall relative to the index’s full historical average (Table 1, Chart 4).
The principal driver has been an outsized home-price increase. Miami’s median single-family price is up 70% from Q4 2019 to Q2 2026 compared with 48% nationally, while income has failed to keep pace (Table 2). Moreover, above-average income gains may partly reflect an influx of higher-income households, meaning the metro-wide median may overstate the improvement experienced by established residents.
The affordability index points to a moderate recovery since late 2023. However, the measure does not capture property taxes, homeowners’ insurance or private mortgage insurance, all of which can materially affect the cost of purchasing a home in Florida.
A broader measure from the Atlanta Fed provides useful context. This measure leans more toward the experience of buyers making smaller down payments, which may more closely resemble the circumstances facing some first-time buyers. It assumes a 10% down payment (rather than 20% as in the standard index), and incorporates taxes, homeowners’ insurance and private mortgage insurance. Under these different assumptions, Miami has experienced a more limited affordability recovery recently, while total modeled ownership costs remain elevated at 56% of household income.
Within the Atlanta Fed framework, property insurance has recently moved in a favorable direction in the Miami metro. This is consistent with signs that Florida’s insurance market is beginning to stabilize, including new insurer entries and a rate reduction from Citizens Property Insurance. Insurance nevertheless remains an important part of Miami’s affordability challenge, with premiums still representing a meaningful component of monthly ownership costs.
Miami’s homebuilding response has also been weaker than elsewhere in Florida. Moreover, much of the completed supply has been multifamily housing geared toward renters. This has offered less direct support to the single-family ownership market captured by the main affordability index (Chart 5).
New York: A Structural Problem That Became Much Worse
The estimated mortgage payment on the median-priced single-family home in the broader New York metro now accounts for 36% of median family income, second only to Miami and well above its 19% pre-pandemic level. New York’s affordability index is 31% below its two-decade pre-pandemic norm and has become significantly less affordable relative to its immediate pre-pandemic position (Table 1, Chart 4).
Home prices have been the principal source of strain. The New York metro recorded the largest cumulative increase in median single-family prices in the sample, at more than 82% since Q4 2019, slightly ahead of Miami, while income growth was considerably more restrained. Prices also continued to outpace income after Q4 2023, significantly limiting the recent recovery (Table 1 & 2).
Affordability has improved by only 3% from the 2023 trough – the weakest recovery in the group. The supply side has provided little relief: single-family completions per capita remain low, while recent permitting activity points to little near-term improvement. Structural land constraints, regulatory barriers and persistent demand continue to support prices.
Table 2: Housing Affordability - Components of Change
| % Change | Post-pandemic Period (Q2 2026 vs. Q4 2019) |
Recent Recovery (Q2 2026 vs. Q4 2023) |
||||
| Home Prices | Income | Mortgage Rate* | Home Prices | Income | Mortgage Rate* | |
| U.S. | 48 | 32 | 73 | 6 | 11 | -12 |
| Boston | 60 | 29 | 10 | 10 | ||
| New York | 82 | 29 | 18 | 11 | ||
| Philadelphia | 66 | 30 | 13 | 12 | ||
| Baltimore | 44 | 28 | 10 | 10 | ||
| D.C. | 43 | 28 | 4 | 10 | ||
| Virg. Beach | 54 | 33 | 7 | 10 | ||
| Charlotte | 61 | 36 | 5 | 11 | ||
| Atlanta | 60 | 38 | 0 | 11 | ||
| Jacksonville | 58 | 40 | 4 | 13 | ||
| Orlando | 56 | 36 | 0 | 8 | ||
| Tampa | 62 | 42 | -1 | 13 | ||
| Miami | 70 | 39 | 3 | 9 | ||
Boston Remains Structurally Expensive
Boston’s mortgage burden stands at approximately 30% of median family income, making it the third highest among the East Coast metros examined. This compares with 18% before the pandemic. Meanwhile, the latest affordability reading is 31% below its 2000–2019 average (Table 1, Table 3).
Home prices increased at almost double the rate of income over the full post-2019 period. More recently, income growth has moved broadly in line with price growth, with lower mortgage rates accounting for the bulk of the improvement in affordability (Table 2).
Housing completions are also among the lowest in the group, and much of the delivered supply is concentrated in multifamily properties typically geared toward the rental market (Chart 5). Recent permitting data suggest that new single-family supply will continue to offer only limited support.
Philadelphia’s Shock Is Larger Than Its Current Ranking Suggests
Philadelphia’s latest mortgage burden, at approximately 20% of median family income, is well below Miami, New York or Boston. Its post-pandemic deterioration, however, was among the largest in the group.
The latest index remains 30% below its two-decade pre-pandemic average and 42% below its immediate pre-pandemic level (Q4 2019). Home prices increased much faster than income after Q4 2019 and continued to outpace income following the 2023 trough, limiting the recent recovery (Table 1, Table 2 and Chart 2).
Philadelphia also has a low housing-completion rate relative to its peers, offering little supply-side relief. Its current mortgage burden remains comparatively moderate, but its long-standing affordability advantage within the Northeast has narrowed. Recent single-family permitting activity has trended lower and remains below the national rate, suggesting that supply will provide little help in narrowing that gap over the medium term.
Baltimore, the D.C. Metro and Virginia Beach Have Held Up Better
Baltimore, the D.C. metro and Virginia Beach experienced less affordability deterioration than most of the group.
Baltimore compares most favorably against the pre-pandemic benchmark, although affordability remains 25% below the 2000–2019 average. The D.C. metro and Virginia Beach follow, both at 26% below their norms. Current mortgage burdens range from 19% of median family income in Baltimore to 20% in Virginia Beach and 23% in the D.C. metro.
These metros benefited from comparatively restrained home-price appreciation and supportive, albeit at or below-average, income growth. Their relative resilience does not appear to have been driven by unusually strong construction. Among other things, softer home-price growth in Baltimore likely reflects weaker demographic conditions, while in D.C. it likely reflects outsized price gains in the two decades prior to the pandemic and more recently federal-sector headwinds, including federal workforce reductions.
Charlotte and Atlanta: Rapid Growth Came at a Cost
Charlotte and Atlanta remain less burdensome compared to Miami, New York and Boston, but both have lost much of the affordability advantage they enjoyed before the pandemic.
Charlotte’s affordability index is 40% below its 2000–2019 average, tied with Orlando for the largest shortfall in the group. Atlanta is 39% below this norm, despite comparing relatively well with its much longer historical average. This contrast underscores how sharply both markets have deteriorated relative to the conditions households experienced during the two decades before the pandemic.
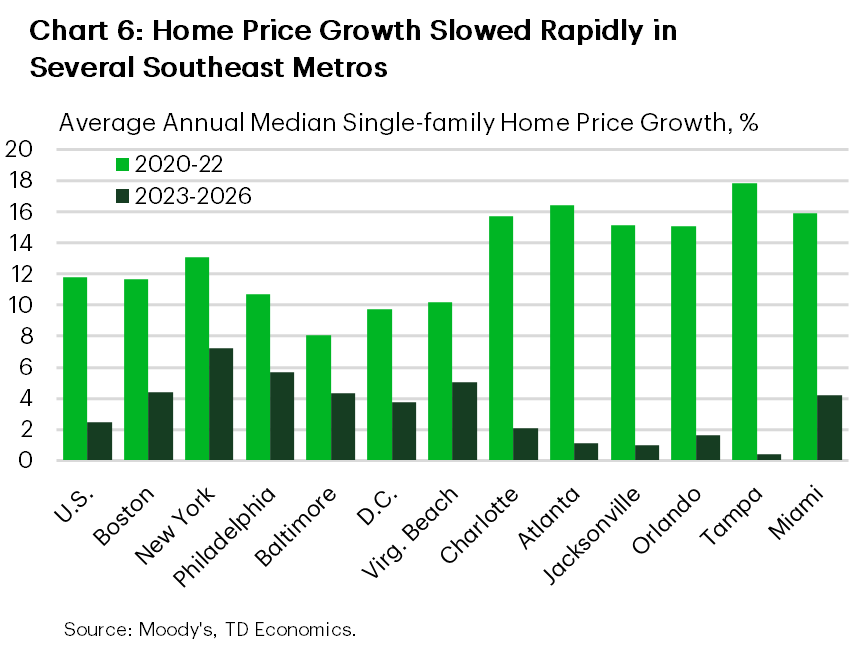
Income growth after 2019 was insufficient to offset much stronger home-price appreciation (Table 2). The recent picture is more encouraging. Price growth has slowed, particularly in Atlanta, while incomes have continued to rise, allowing both markets to regain some lost ground (Chart 6).
A stronger construction response likely contributed to the moderation in home price growth. Over time, Charlotte and Atlanta have completed considerably more housing relative to population than most Northeast metros, while a recent softening in population growth has likely aided the cooling in conditions.
Restrictions on purchases by large institutional investors could further reduce competition at the margin in Atlanta, a notable destination for investor activity. However, recent permitting activity points to shrinking construction pipelines in both metros, suggesting that the recent improvement in housing affordability may lose some of its luster.
Jacksonville: Florida’s Relative-Value Market
Jacksonville has the lowest mortgage-payment burden among the four Florida metros, at 22% of median family income, following one of the stronger recent affordability recoveries.
Jacksonville also has one of the highest housing-completion rates in the cohort, suggesting that the supply response has helped keep prices in check. Home prices have recorded little growth since late 2023, while income has continued to rise at a pace slightly faster than the national rate.
Jacksonville nevertheless remains 34% below its contemporary pre-pandemic affordability norm and 35% below its Q4 2019 position. It is therefore best described as a relative-value market rather than an affordable one.
Tampa and Orlando: Florida’s Affordability Challenge Extends Beyond Miami
Florida’s four major metros share a common pattern: a severe post-pandemic deterioration followed by a pronounced, albeit partial, recovery.
Orlando ranks among the furthest below its two-decade pre-pandemic norm, with the latest index 40% below the 2000–2019 average. Tampa is 36% below its norm. These readings confirm that Florida’s affordability deterioration extends well beyond Miami, even though current mortgage burdens remain lower in Tampa and Orlando.
Both metros experienced large pandemic-era home-price shocks. More recently, prices have been broadly flat while incomes continued to advance. Tampa consequently recorded the strongest recovery in the 12-metro cohort, with Orlando and Jacksonville also posting meaningful gains (Tables 1 and 2, Chart 6).
The rebound coincided with a responsive supply environment. Like Jacksonville, Orlando and Tampa completed considerably more housing relative to population than Miami.
Even after the recent improvement, mortgage payments consume approximately 27% of median family income in Orlando and 23% in Tampa, compared with 17% and 15%, respectively, before the pandemic. Not only are mortgage burdens above prior norms and somewhat above the national average, but within the Florida context, property insurance remains an important added expense not captured by standard financing metrics.
Table 3: Mortgage Payment as a Share of Family Income
| Metro | Long-term Avg. | Pre-pandemic Contemporary Avg. | Pre-pandemic | Post-pandemic Trough | Latest Reading |
| 1971 to Q2 2026 | 2000 to 2019 | Q4 2019 | Q4 2023 | Q2 2026 | |
| U.S. | 20 | 17 | 15 | 26 | 22 |
| Boston | 24 | 23 | 18 | 33 | 30 |
| New York | 28 | 27 | 19 | 37 | 36 |
| Philadelphia | 16 | 14 | 11 | 21 | 20 |
| Baltimore | 16 | 15 | 13 | 21 | 19 |
| D.C. | 20 | 18 | 15 | 27 | 23 |
| Virg. Beach | 19 | 15 | 13 | 22 | 20 |
| Charlotte | 15 | 13 | 14 | 26 | 22 |
| Atlanta | 17 | 12 | 12 | 23 | 19 |
| Jacksonville | 19 | 15 | 15 | 27 | 22 |
| Orlando | 20 | 17 | 17 | 32 | 27 |
| Tampa | 19 | 16 | 15 | 29 | 23 |
| Miami | 25 | 25 | 23 | 45 | 39 |
Affordability Will Improve, but Only Gradually
The next phase of the housing cycle should bring further improvement, but a return to pre-pandemic affordability remains unlikely over the medium term.
The recent rise in mortgage rates has already reversed some of the improvement recorded between late 2023 and the first half of 2026, as shown by the national index estimated through August (refer back to Chart 1). With markets still pricing some additional Fed tightening by year-end, the monetary backdrop is unlikely to provide meaningful near-term relief. Even if lower inflation eventually allows longer-term yields to trend lower, a return to the unusually low mortgage-rate environment seen during the pandemic remains unlikely.
Income growth and more typical home-price appreciation will therefore need to do more of the work. For the latter, adequate housing supply will be crucial, since stronger purchasing power without additional construction can be capitalized into higher prices.
Several Southern markets have historically completed more housing relative to population than the Northeast. More recently, however, permitting activity has weakened, pointing to a softer construction pipeline. Even so, the pipeline generally remains stronger than in the Northeast and, alongside a softer demographic backdrop, should help keep home-price growth more closely aligned with underlying fundamentals.
In the Northeast, softer demographic growth should limit demand pressure, but construction would still need to rise substantially to reverse years of affordability erosion. Current permitting activity suggests that such a response is unlikely over the medium term.
The construction trend has also softened nationally, with housing permits moving lower amid elevated interest rates and soft demand. While new-home inventories remain historically elevated, new homes represent only a small share of the market. Once the much larger existing-home segment is considered, housing availability remains relatively constrained, with resale inventories barely in balanced territory.
Bottom Line
Housing affordability remains strained across a dozen large East Coast metro areas examined in this report. Under typical financing assumptions (20% down payment, 25% qualifying ratio) Miami has the highest current mortgage-payment burden relative to median family income, followed by New York and Boston. Affordability has improved across the group since late 2023, although more timely national data indicate that some of this progress has since unwound at the margin as mortgage rates moved higher through the summer.
Despite the partial recovery since late 2023, every metro remains substantially less affordable than immediately before the pandemic. New York has experienced the largest deterioration relative to its pre-pandemic stance (Q4 2019), followed by Philadelphia, Boston and Miami. But perspective matters. Benchmarking current conditions against the broader 2000 to 2019 average — a period that better reflects the housing conditions buyers were accustomed to before the pandemic — reveals that southern metros have been more heavily affected. Miami, Charlotte, Orlando and Atlanta fare worse from this point of view, even as the latter three have recorded some of the strongest improvement in recent years. By contrast, Baltimore, Virginia Beach and the D.C. metro appear to be faring much better.
Further improvement ahead is likely to be gradual. With mortgage rates expected to remain elevated, income growth will need to carry most of the load provided that home prices appreciate at a more typical pace, as expected. A sustained supply response would help, particularly in the Northeast, but subdued permitting suggests that construction pipelines will remain thin and that housing affordability will remain challenged for some time.
Disclaimer
This report is provided by TD Economics. It is for informational and educational purposes only as of the date of writing, and may not be appropriate for other purposes. The views and opinions expressed may change at any time based on market or other conditions and may not come to pass. This material is not intended to be relied upon as investment advice or recommendations, does not constitute a solicitation to buy or sell securities and should not be considered specific legal, investment or tax advice. The report does not provide material information about the business and affairs of TD Bank Group and the members of TD Economics are not spokespersons for TD Bank Group with respect to its business and affairs. The information contained in this report has been drawn from sources believed to be reliable, but is not guaranteed to be accurate or complete. This report contains economic analysis and views, including about future economic and financial markets performance. These are based on certain assumptions and other factors, and are subject to inherent risks and uncertainties. The actual outcome may be materially different. The Toronto-Dominion Bank and its affiliates and related entities that comprise the TD Bank Group are not liable for any errors or omissions in the information, analysis or views contained in this report, or for any loss or damage suffered.
Download
Share this: