Global Trade Disrupted:
Early Impacts of U.S. Tariffs
Vikram Rai, Senior Economist | (416)-923-1692
Date Published: November 5, 2025
- Category:
- U.S.
- Trade
- Commodities & Industry
Highlights
- The dramatic increase in U.S. tariffs in 2025 has led to volatility in the trade data that makes it difficult to analyze trends. Despite these distortions, there is early evidence that underlying growth in U.S. imports has slowed.
- The U.S. has seen a modest narrowing of its trade deficit with its largest and most consistent trading partners: Europe, China, Canada, and Mexico. But its overall trade deficit is little changed as the deficit with the rest of the world has increased.
- China’s exports have shifted away from the U.S. and towards other countries this year.
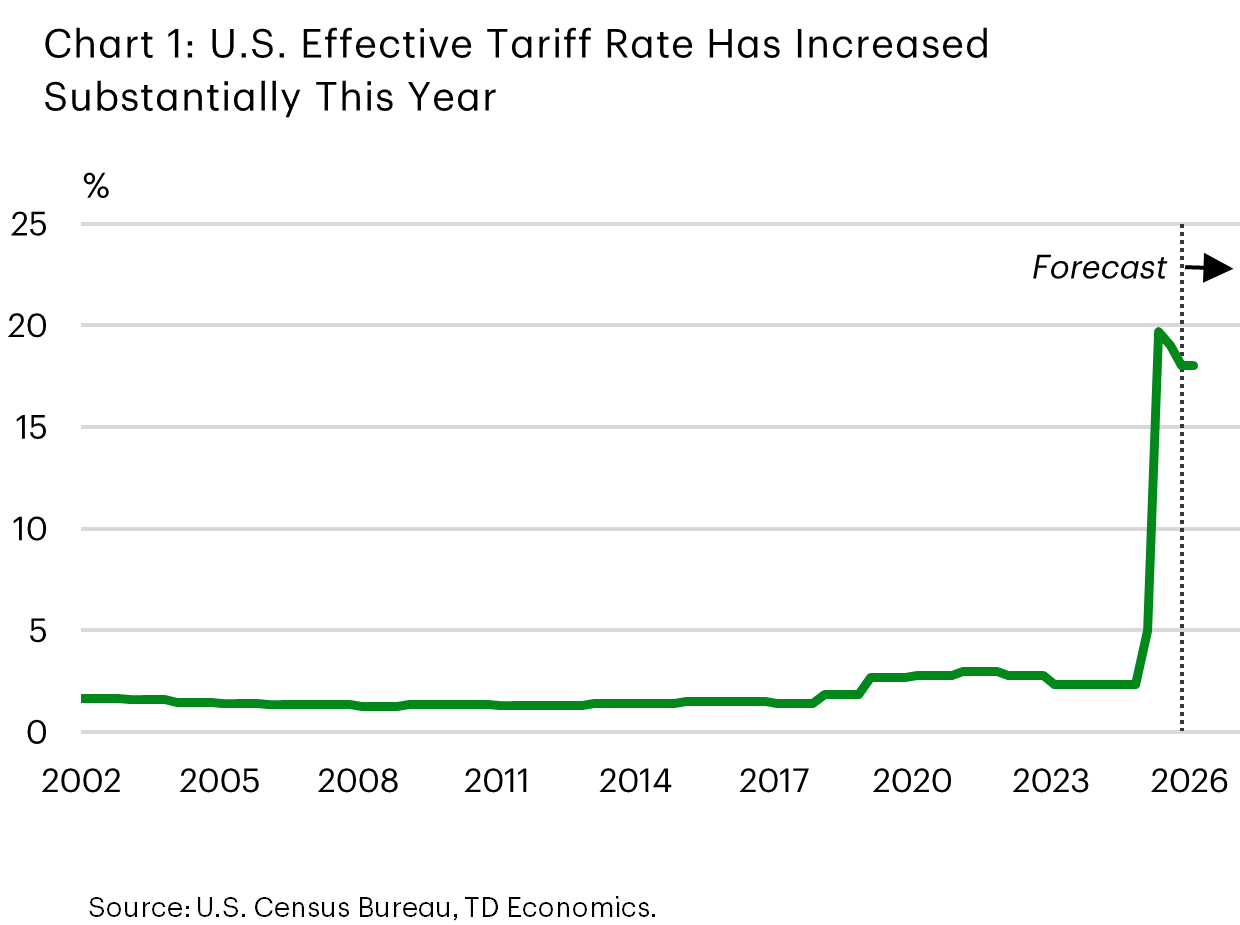
The last time the global economy was adjusting to escalating trade tensions and major new import tariffs between major economies, in 2018, the primary issue was U.S. tariffs on China. In 2025, trade tensions are more broad-based and U.S. tariffs are much higher. The U.S. effective tariff rate increased from under 5% in 2024 to around 17% in the latest data (Chart 1). U.S. tariffs on imports from virtually all its trading partners have increased, not only on China.
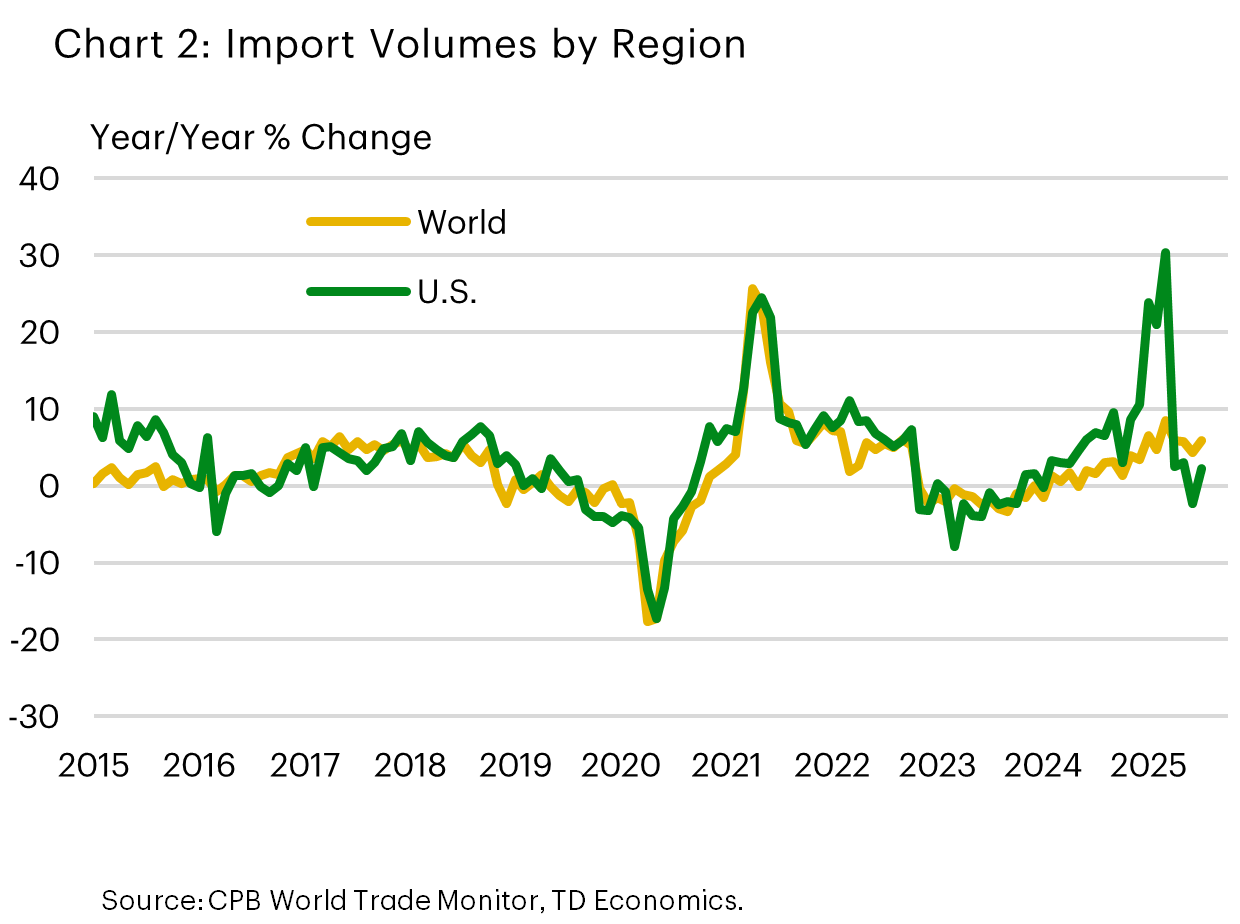
President Trump was clear on his tariff plans in the election, and U.S. businesses rushed to import goods early in 2025 to get ahead of U.S. tariffs. Import volumes surged early in 2025 as a result. Import growth softened through the second quarter with tariffs in place, as shown in Chart 2.
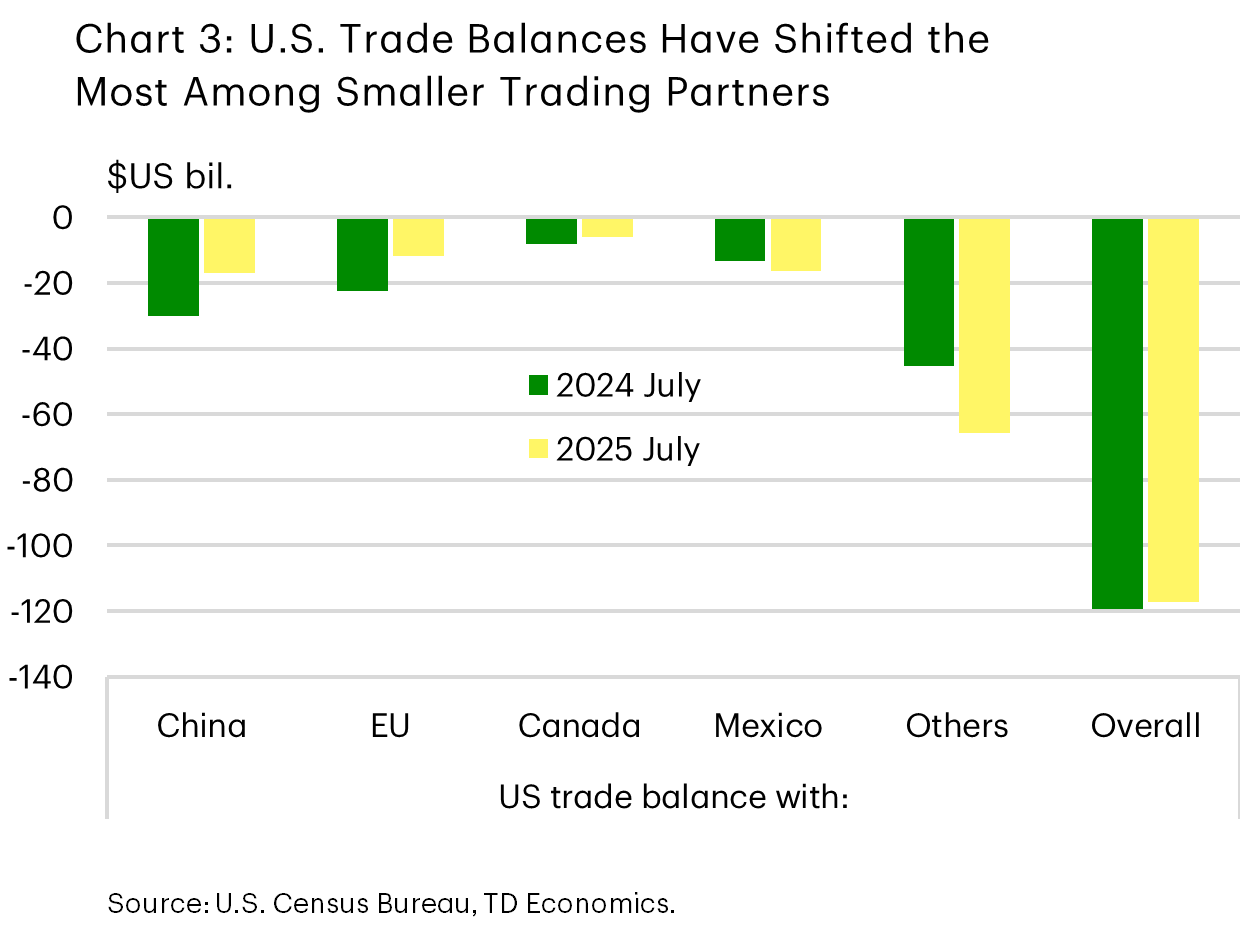
Not surprisingly, U.S. tariffs have also shifted trade balances by region. The U.S.’s trade deficit with China and EU and Canada have all narrowed slightly – consistent with President Trump’s desired goal. But the overall deficit has narrowed very little due to a significant expansion in deficits with “other” countries (Chart 3).
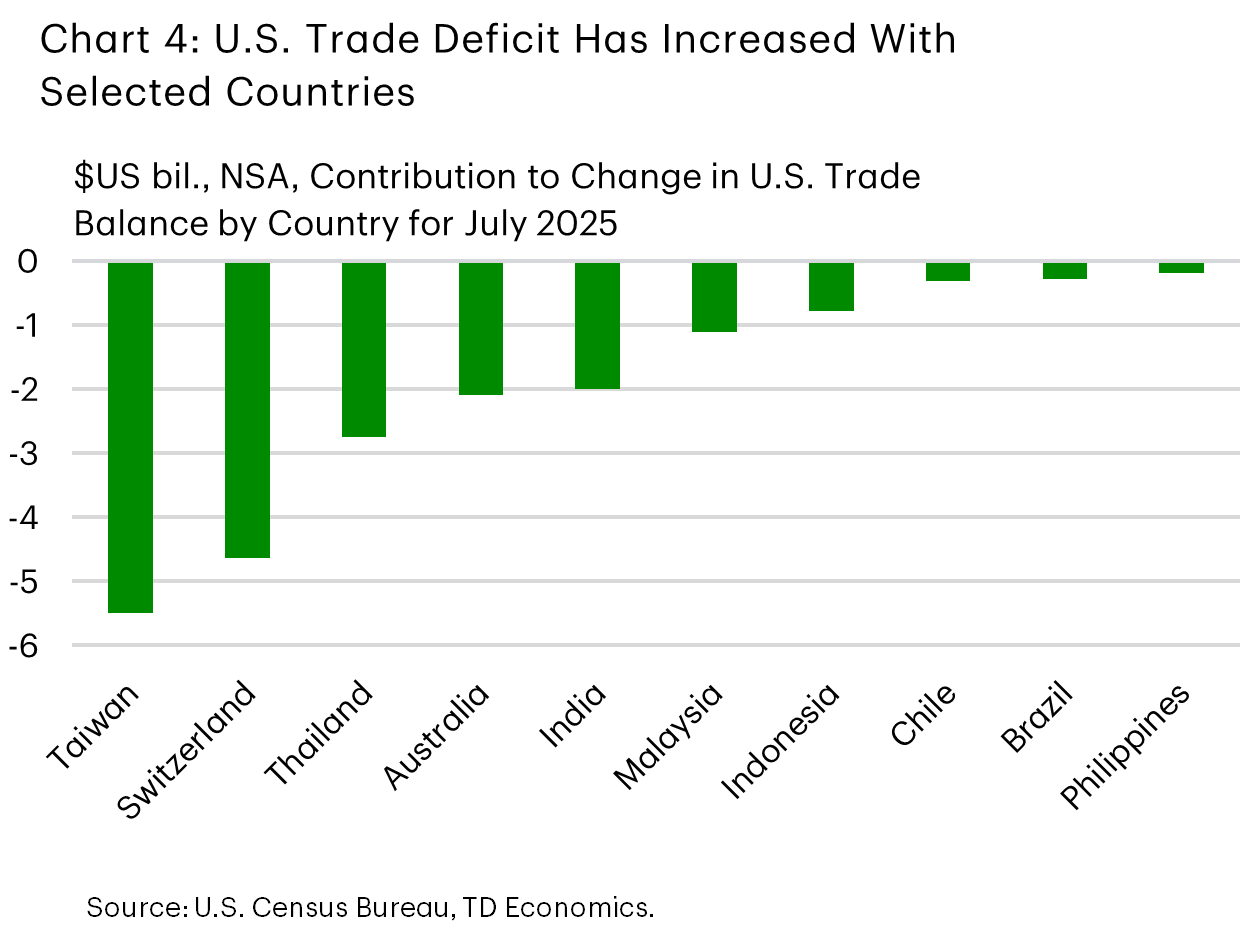
Which countries are in this group? It’s a busy picture, but we can still see in Chart 4 that Switzerland and Taiwan were the largest contributors in the latest data. Two very different aspects of how the tariff shock is shaking out explain this – the imports from Switzerland reflect a temporary surge of commodities (such as gold) imports in July 2025, while the increase in Taiwan comes from manufactured goods and machinery and equipment. These are the two sides are the tariff shock we see manifesting in the U.S. data: a flight to safety, and a rush to stockpile goods before it’s too late.
Global trade is still flowing, but some directions have changed
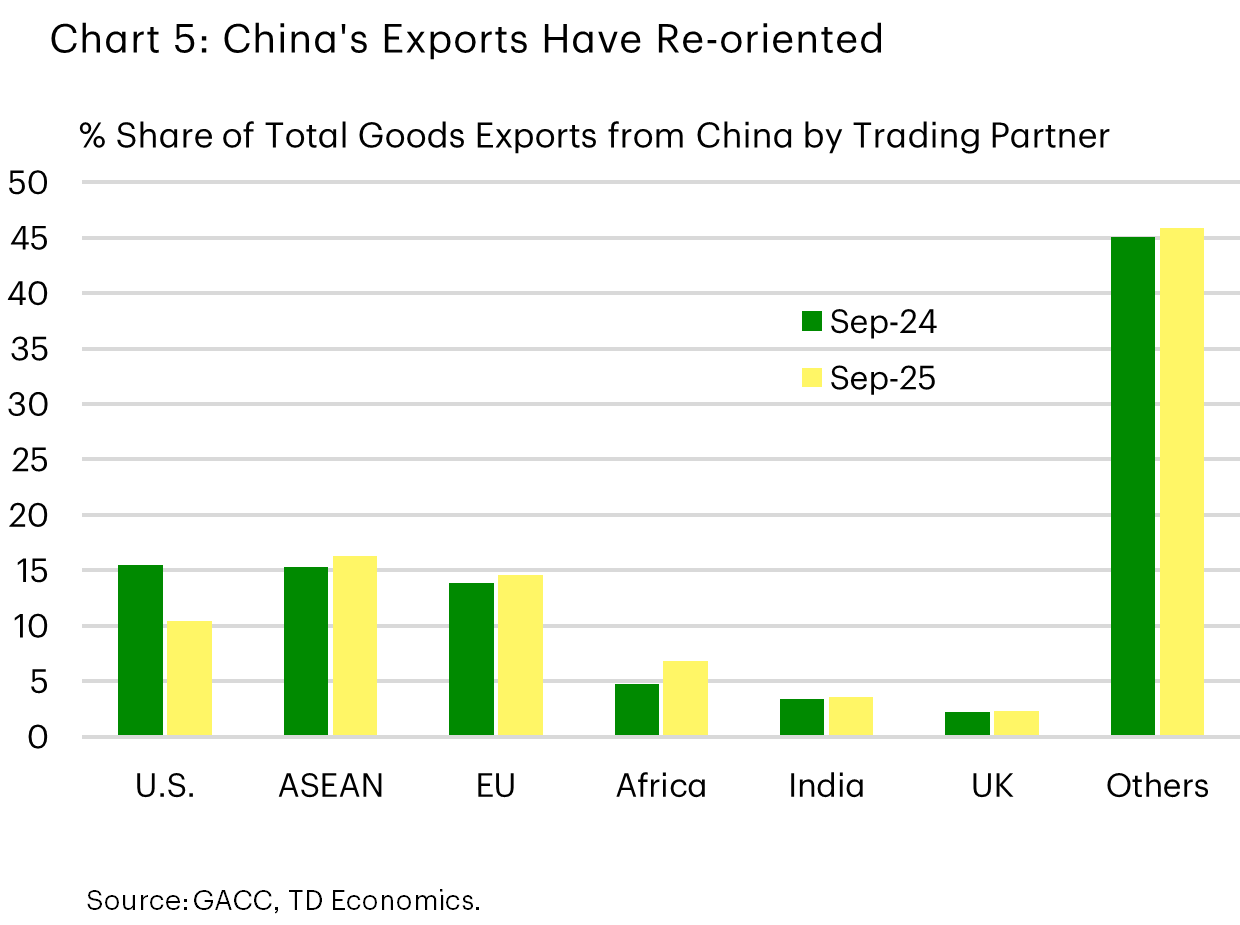
The U.S. data is volatile, between the rush to import ahead of tariffs and the surge in gold imports. These developments tell us that the dust has yet to settle and we don’t yet know how U.S. trade has changed in the long run. The government shutdown has also delayed the release of the latest U.S. trade data, with the most recent available data detail through July. But Chinese data is available through September, where we see changes which look to be more fundamental. Chart 5 shows that there has been a noticeable drop in the share of China’s exports which are going to the U.S. in 2025, matched by increases in the share of its exports to the EU, Africa, ASEAN, and other countries, largely in Asia.
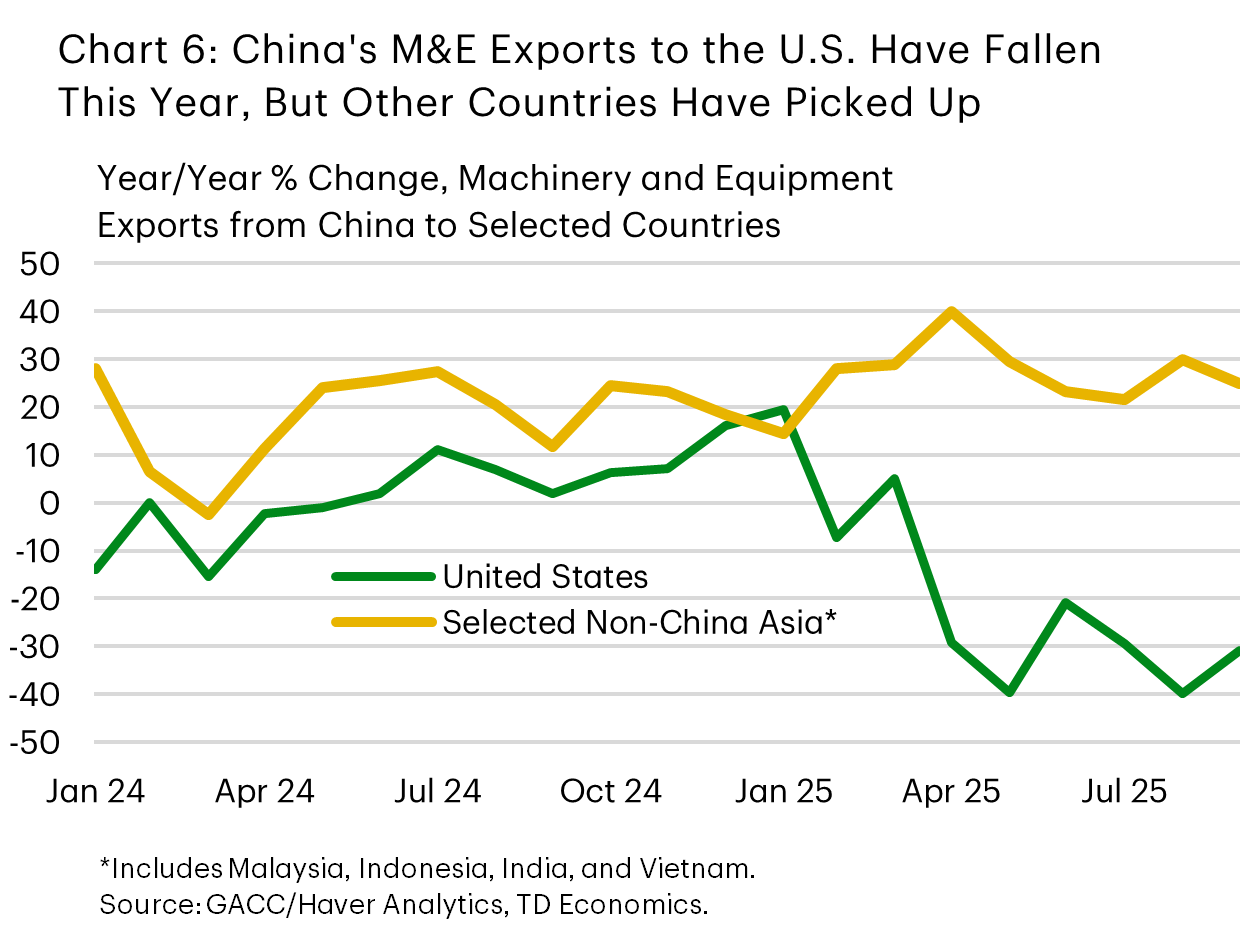
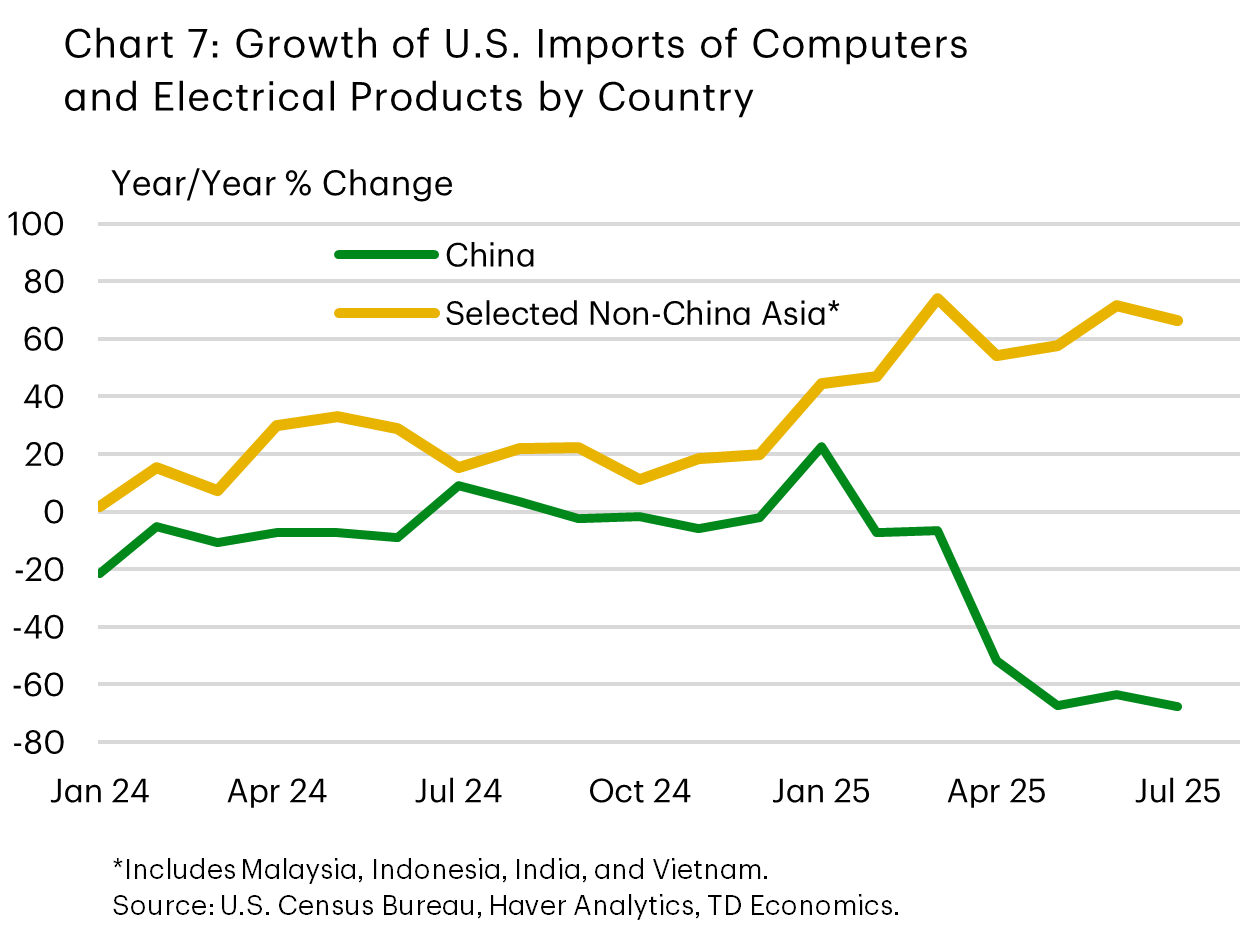
This has happened while China’s overall export growth has accelerated in 2025. The large fall in exports to the U.S. is more than offset by growth in other markets, especially Africa and Asia. We question if this is sustainable – Charts 6 and 7 shows that many of the same economies to which China has increased its exports have all seen high growth in their exports to the U.S., particularly in computer and electronic products. While the data cannot conclusively confirm that this is so-called “trans-shipping” instead of a real shift in the location of manufacturing activity, the timing suggests a link. China’s data also showed that investment faltered in the third quarter of 2025, which could foreshadow lower production of manufacturing goods for export in the coming months.
Last time, we learned the economy takes time to respond to tariffs
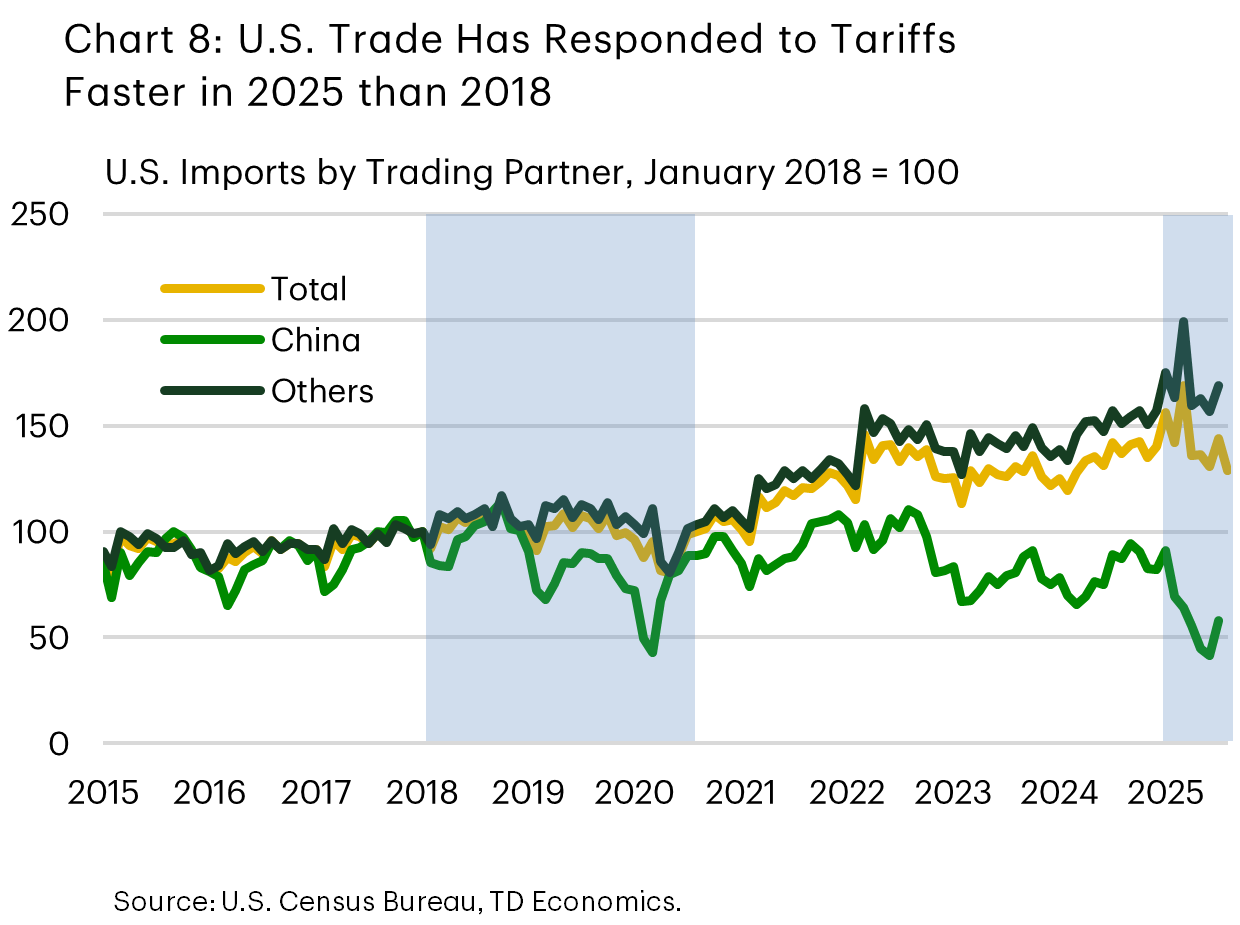
In 2018, when the U.S. substantially increased import tariffs, the reaction in global trade was delayed, as shown in Chart 8. U.S. tariffs on China began ramping up in the second half of 2018, and U.S. import growth continued to slow even throughout 2019. The reallocation of global trade in this case was gradual.
The adjustments in 2025 have been larger and appeared in the data earlier. U.S. imports from China and all other trading partners entered a downward trend after a pre-tariff surge this year.
What we are watching for
Global trade has only just begun to adjust to the new tariff reality. Over the coming year, if tariffs remain in place at or around their current levels, we will be watching for the continued re-orienting of global trade away from the U.S. It is also a critical question whether China’s seemingly successful diversification is truly diversification or a temporary divergence that will be tempered by future changes in trade policy or loose momentum.
Disclaimer
This report is provided by TD Economics. It is for informational and educational purposes only as of the date of writing, and may not be appropriate for other purposes. The views and opinions expressed may change at any time based on market or other conditions and may not come to pass. This material is not intended to be relied upon as investment advice or recommendations, does not constitute a solicitation to buy or sell securities and should not be considered specific legal, investment or tax advice. The report does not provide material information about the business and affairs of TD Bank Group and the members of TD Economics are not spokespersons for TD Bank Group with respect to its business and affairs. The information contained in this report has been drawn from sources believed to be reliable, but is not guaranteed to be accurate or complete. This report contains economic analysis and views, including about future economic and financial markets performance. These are based on certain assumptions and other factors, and are subject to inherent risks and uncertainties. The actual outcome may be materially different. The Toronto-Dominion Bank and its affiliates and related entities that comprise the TD Bank Group are not liable for any errors or omissions in the information, analysis or views contained in this report, or for any loss or damage suffered.
Download
Share: