Highlights
- The divergence between U.S. inflation as measured by the CPI and PCE deflator is typically marginal but has recently
widened to its highest recorded level. - The main factor causing the divergence is the higher weight that the CPI assigns to categories that are currently experiencing
higher inflation levels, such as shelter costs. - The lack of uniformity in inflation measures, particularly to this degree, will complicate the ability of the Federal Reserve
to definitively say that inflation has turned.
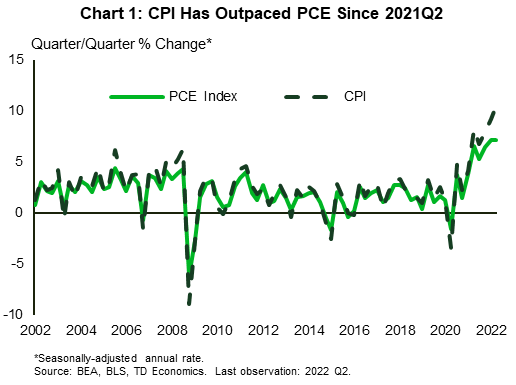
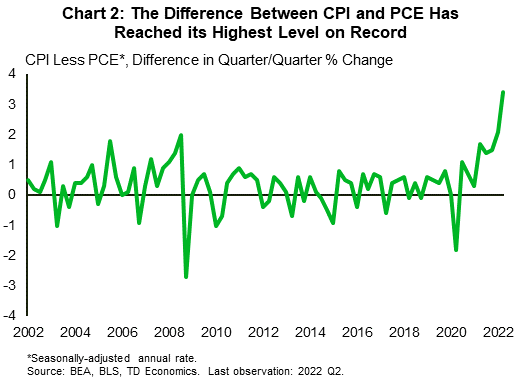
In the current macroeconomic environment, every new inflation data release is combed through with an eagle eye to gauge how it might influence the Federal Reserve’s stance on monetary policy. The two main price indexes used to measure inflation are the Consumer Price Index (CPI), distributed by the Bureau of Labor Statistics (BLS), and the Personal Consumption Expenditure (PCE) Price Index, distributed by the Bureau of Economic Analysis (BEA). The Federal Reserve’s preferred index is the PCE measure, but it monitors CPI as well. Historically the two measures of inflation seldom deviate by large margins, but that has changed in 2022 (Chart 1). As of the second quarter of 2022, the quarter-over-quarter (q/q) change in CPI (seasonally adjusted at annual rates) was a full 3.4 percentage-points above the same period change in PCE – the highest difference on record (Chart 2). So, why do these two measures deviate at all, and what is causing the current unprecedented divergence between the two? Well, there are several differences between the two indexes that can be broken down into four categories: formulaic, scope, weight, and other.
The formulaic differences arise from the fact that CPI uses an index formula which only updates item weights biannually (but moving to annual updates in 2023), while the PCE index updates item weights every quarter. Advocates of using the PCE index, the Fed among them, say that constant updates to item weights better capture substitution effects, whereby consumers switch products due to relative price differences. This is also one of the reasons why CPI is traditionally higher, as it does not capture the switch to cheaper products which might be occurring.
Differences in scope are the most consequential in terms of the overall effect on the differences between PCE and CPI because they have a domino effect on other differences, such as relative weighting. CPI uses a narrower definition of consumer expenditures and only considers urban expenditures made directly by consumers. In contrast, PCE considers expenditures made by urban and rural consumers as well as expenditures made on their behalf by third parties. An example of this would be healthcare insurance providers, who purchase prescription drugs on behalf of patients.
Healthcare related expenditures are the predominant source of divergence between PCE and CPI originating from this category, largely due to the inclusion of third-party expenditures in PCE. The BEA does not publish party-specific expenditure data, but we can tell by the difference in weights that PCE expenditures are far larger. The CPI weight for healthcare services is currently 7% (based on 2019-2020 data) while the PCE index weight for healthcare services for the same time period was more than twice that amount (16.8%).
Weighting differences are the byproduct of the data differences that arise between the two indexes. Each index uses the data it collects to calculate the relative share of consumer spending each item represents, and from this the relative impact of price changes on the overall inflation measures. Data sources for each index vary, with CPI using Consumer Expenditure (CE) data and PCE using the National Income and Product Accounts (NIPA) Personal Consumption Expenditure data. The CE data is collected directly from consumers, whereas the NIPA data is collected from businesses, which can result in discrepancies between the two price measures. Another major source of weighting differences comes from the differences in scope previously discussed. A significant example is the effect that including third-party expenditures in the PCE index has on the relative weights assigned to other categories. Shelter and to a lesser extent energy prices are two of the categories that are typically assigned lower weights in PCE than CPI as a result, which can lead to noticeable differences between the aggregate indices (Table 1). Looking at the top weighted item categories for PCE, you can see that Healthcare services are the highest weighted category, even beating out Housing which is nearly equivalent in scope to the heavily weighted CPI Shelter category. In addition, we see that other categories such as Financial services & insurance as well as Pharmaceutical & other medical products make the top ten for the PCE index, in large part owing to the inclusion of third-party expenditures. We also see that energy related categories such as Household fuels & utilities and Motor fuel make it into the top ten for CPI but are assigned lower relative weights for PCE. It is apparent that the differences in scope between PCE and CPI creates a notable divergence in weights between the two indexes.
Table 1: Highest Weighted Item Categories for PCE and CPI
| PCE Index | CPI | ||
| Item | Weight % | Item | Weight % |
| Healthcare services | 16.8 | Shelter | 32.9 |
| Housing | 15.9 | New & used motor vehicles | 9.2 |
| Financial services & insurance | 8.1 | Food at home | 8.2 |
| Food & beverages purchased for off-premises consumption | 7.6 | Medical care services | 7.0 |
| Food services & accommodations | 6.4 | Food away from home | 5.2 |
| Pharmaceutical & other medical products | 3.9 | Household furnishings & operations | 4.8 |
| Motor vehicles & parts | 3.7 | Household fuels & utilities | 4.6 |
| Recreation services | 3.6 | Motor fuel | 3.8 |
| Transportation services | 3.0 | Communication | 3.7 |
| Furnishings & durable household equipment | 2.7 | Education | 2.7 |
The leftover differences collected in the ‘other’ category are mostly due to measurement differences. These include the techniques used to seasonally adjust the data as well as item-level price measurement differences. Seasonal adjustment differences are nuanced because both the BEA and the BLS have used the Census Bureau’s X-13 process since 2018, but their scope differences affect the number and type of series which are being seasonally adjusted. The two agencies also differ in terms of when they revise previous years’ data. The BLS revises in February while the BEA revises in October, although revision coverage for both agencies is the same, covering the previous five years. Historically the ‘other’ category accounts for a small portion of the differences between PCE and CPI, though it has noticeably risen since the onset of the pandemic.
Recent Developments and Cause of Historical Divergence
The past 18 months have witnessed a sustained period of elevated inflationary pressure in which CPI rose far higher than PCE. This occurred for two main reasons. The first is that PCE underweights shelter costs relative to CPI due to its inclusion of third-party expenditures. During periods in which housing prices and rents rise rapidly, such as they have recently, CPI will rise by more than PCE. In the lead-up to 2008, we saw a similar result with CPI outpacing PCE, although the volatility of fuel prices at the time somewhat obscured the effect on the aggregate indexes. In the current environment, fuel prices have been rising in concert with shelter costs, which has been a major factor in the record level of divergence between CPI and PCE.
The difference between the two indexes was further enhanced by the fact that the pandemic drove up health-related third-party expenditures as well as the demand for durable goods, which placed downward pressure on the relative weight of shelter (referred to as housing in PCE). In 2021, the weight of housing in PCE declined by 1.3 percentage-points, driving it lower than it was in 2019 despite the rapid growth in house prices seen in 2021. In contrast, the weighting for shelter in CPI was raised by 0.5 percentage-points at the start of 2022 based on 2019-2020 expenditure data. In a few months’ time when the BLS begins to update weights annually, the first update will likely see the weight of shelter increase further as it reflects 2021 expenditures. This means that the divergence between CPI and PCE may grow further before returning to its long run average level.
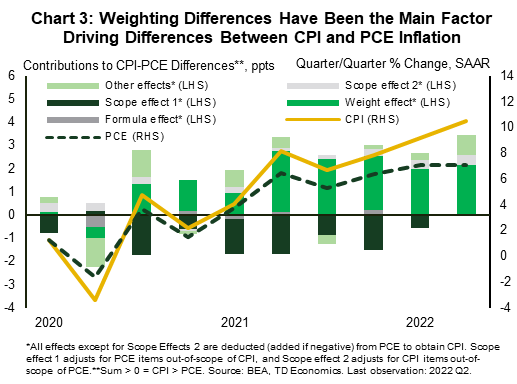
In the second quarter of 2022, weight differences between CPI and PCE accounted for nearly two-thirds of the differences in their aggregate indexes with shelter and fuel related expenditures making up the lion’s share of the wedge. Since 2015, the weight differential for shelter between PCE and CPI has added 0.5 percentage-points annually to overall CPI, but in 2022 it has more than doubled (Chart 4). In addition to lower assigned weighting, there are further differences between the definitions and measurement methods used by each price index which contributes to the housing-related divergences between PCE and CPI.
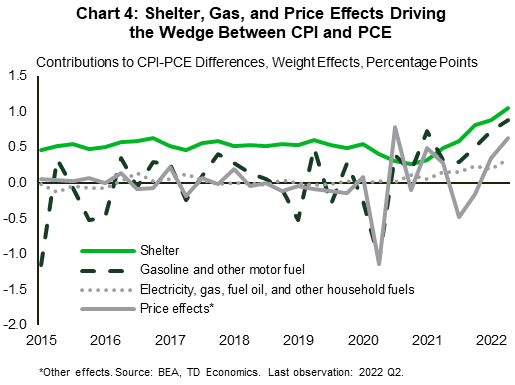
The second reason for the divergence is due to the difficulty of reconciling measurement differences in the current inflation environment. Individual item level measurement differences alone accounted for roughly one-fifth of the aggregate price index differences in the second quarter of 2022. The items which contributed to this the most were gasoline and air transportation expenditures. Historically, these differences, referred to as ‘price effects’, have been negligible on average, however in the past two years they have become increasingly volatile. The volatility in price effects closely followed fuel price volatility in 2020, but as inflation broadened to other categories so too did the volatility in the price effects of other categories. The elevated state of inflation has exacerbated the item-level measurement differences between CPI and PCE which has contributed to the current unprecedented divergence between the two price indexes.
Implications For the Federal Reserve
Since the year 2000, the Federal Reserve has opted to target inflation based on PCE instead of CPI. Their reasoning is three-fold; PCE updates its weights more frequently, PCE provides broader coverage of the economy, and historical PCE data can be revised more completely. However, there are downsides to the use of PCE, such as the fact that constant weight updates result in a publication lag. The PCE index is also vulnerable to understating inflation due to its inclusion of large third-party expenditures which lower the relative weights of other item categories, such as shelter. This proved problematic in the pandemic era when shelter costs rose exponentially, enlarging the wedge between PCE and CPI. The problem was compounded by the fact that it coincided with a global health crisis and an ensuing period of pent-up demand, which drove up health-related third-party expenditures as well as durable good expenditures and placed downward pressure on the relative weight of shelter costs. This was the main reason for the broad divergence between PCE and CPI that has persisted to this day.
The Fed’s reasoning for using the PCE index over CPI is valid and the current divergence is unlikely to motivate them to change preferred measures. However, it would be imprudent for the FOMC to ignore the underlying factors which can cause these two indexes to deviate by such large margins. The interest rate sensitivity of the housing sector coupled with its prominence in consumer expenditures means that misjudging its relative price movements can potentially lead to policy errors. In the current environment where an expediated rise in housing prices has led to the current divergence between PCE and CPI, it is possible that the reverse trajectory may result in a similar divergence. It is highly unlikely that a downward movement in housing prices over the coming months will be as precipitous as a full reversal of the outsized gains seen over the past two years, but it is possible that PCE and CPI will not drawdown equally as a result of their differences. The Federal Reserve would then have to decide whether they are seeing a clear indication of disinflation in a scenario where one index is declining at a faster rate than the other. If the Fed’s current task were compared to landing a plane on a narrow runway, this would be like adding a thin layer of fog into the equation. This uncertainty will likely complicate the ability of the Fed to definitively say that inflation is coming down but should not be insurmountable.
Bottom Line
CPI was 3.4 percentage-points higher than PCE in the second quarter of 2022 – the largest difference on record. This divergence was primarily caused by weighting differences between the two price indexes, with shelter, and to a lesser extent energy costs, contributing less to PCE than CPI. This is a by-product of the composition differences between CPI and PCE, with PCE containing a far broader variety of items, and in particular third-party expenditures. The elevated level of inflation has also exacerbated historically trivial item-level measurement differences which are playing a smaller, though still notable, role in the divergence. The magnitude of the difference between CPI and PCE presents the possibility that the Federal Reserve may lack a coherent picture of price growth when it inevitably shifts away from its current hawkish policy stance.
Disclaimer
This report is provided by TD Economics. It is for informational and educational purposes only as of the date of writing, and may not be appropriate for other purposes. The views and opinions expressed may change at any time based on market or other conditions and may not come to pass. This material is not intended to be relied upon as investment advice or recommendations, does not constitute a solicitation to buy or sell securities and should not be considered specific legal, investment or tax advice. The report does not provide material information about the business and affairs of TD Bank Group and the members of TD Economics are not spokespersons for TD Bank Group with respect to its business and affairs. The information contained in this report has been drawn from sources believed to be reliable, but is not guaranteed to be accurate or complete. This report contains economic analysis and views, including about future economic and financial markets performance. These are based on certain assumptions and other factors, and are subject to inherent risks and uncertainties. The actual outcome may be materially different. The Toronto-Dominion Bank and its affiliates and related entities that comprise the TD Bank Group are not liable for any errors or omissions in the information, analysis or views contained in this report, or for any loss or damage suffered.
Download
Share: