Highlights
- Consumer spending has remained relatively resilient through the first few months of the energy shock.
- Higher tax refunds have provided households with some cushion against the sharp rise in energy prices. However, the buffers are likely to be exhausted by September, leaving households more exposed should energy prices remain elevated.
- Aggregate spending measures are likely masking underlying trends, where lower-income households are already coming under pressure because of the energy shock.
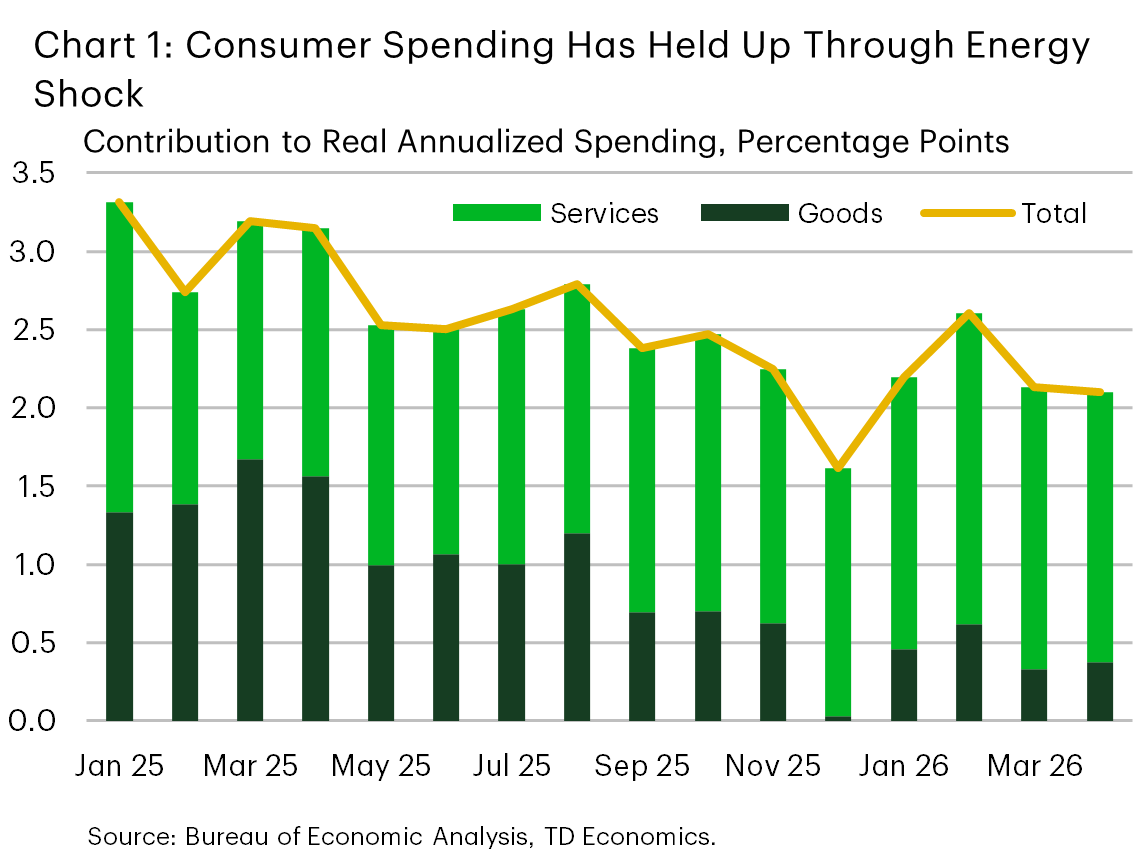
The U.S. consumer has remained surprisingly resilient through the first few months of the energy shock, with inflation adjusted spending still chugging along at pace broadly consistent with late last year (Chart 1). To some degree, the ongoing resilience reflects the fact that households have benefited from larger tax refunds, which are providing a near-term cushion against higher energy prices. However, the tax changes included in the One Big Beautiful Bill Act (OBBBA) skew to higher income taxpayers, consistent with the narrative that lower-income earners are already feeling pressure.
Even assuming a longer-term peace deal to end the U.S.-Iran conflict is reached over the near-term, it’s likely to take at least several months for global oil flows to completely normalize. This means oil prices are likely to remain elevated through the summer, potentially exhausting the tax refund cushion enjoyed by the average household as early as September. Consumer spending is likely to expand near a 2% pace in real terms through the remainder of the year, with higher income households increasingly doing more of the heavy lifting.
No Visible Signs of Softening, Yet…
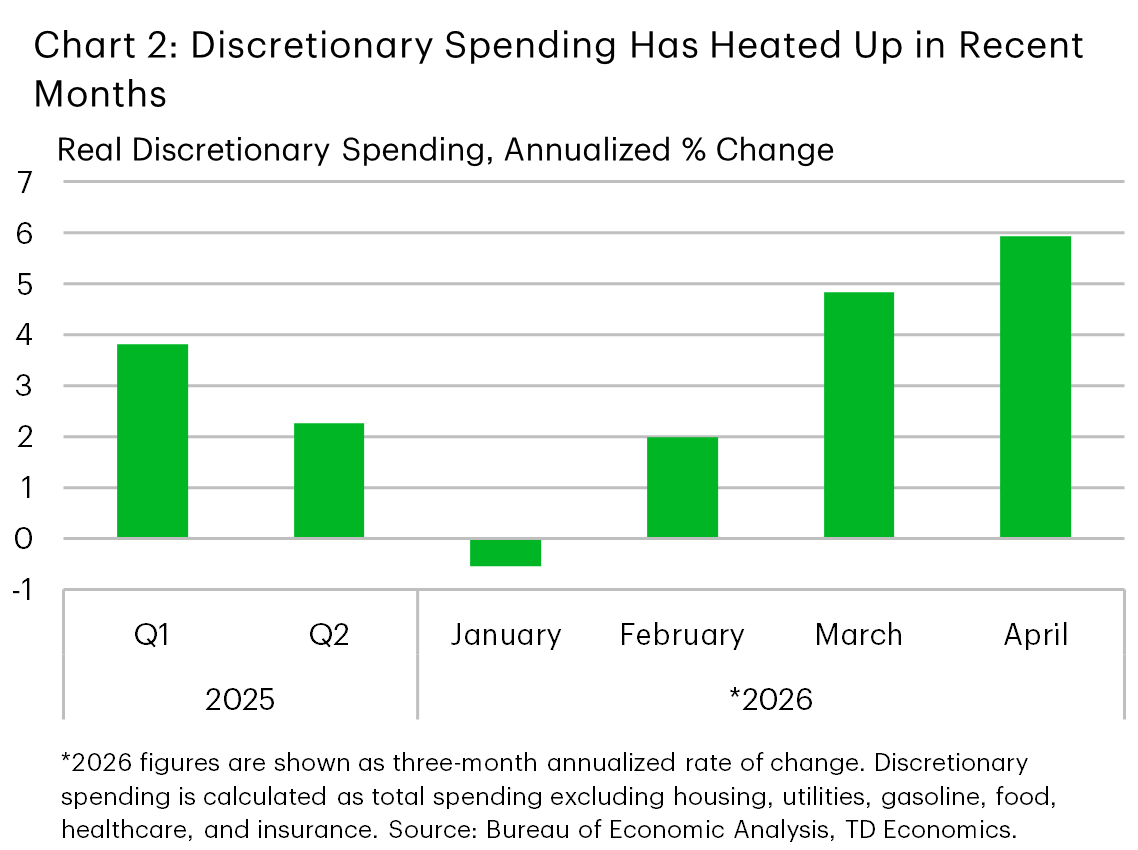
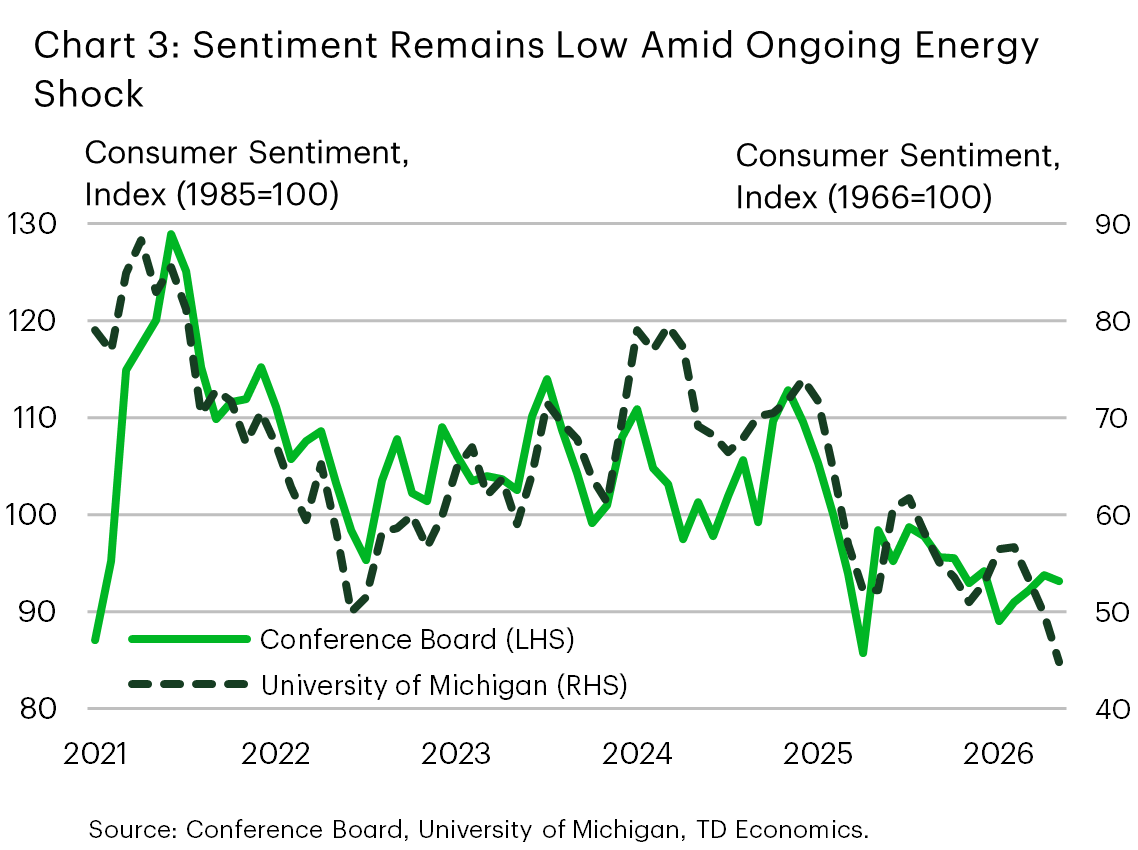
Consumer spending got off to a bit of rocky start this year, thanks to “Winter Storm Fern” and a series of other weather-related events. The storms caused widespread disruptions spanning from the South to Northeast, resulting in a meaningful cooling in spending activity through the month of January. But the consumer quickly bounced back in February, and spending has remained reasonably solid through April, despite the jump in energy prices. Discretionary purchases are perhaps our best gauge on how confident consumers really are about their financial health. This kind of spending, on things like trips or restaurant meals, is what consumers would cut back on first if they are worried about their budgets. These account for nearly half of overall expenditures and have strengthened in recent months (Chart 2). This is at odds with what we’re seeing in consumer confidence surveys, where the University of Michigan measure has recently slipped to a new all-time low (Chart 3). While the Conference Board’s confidence measure has held up better, underlying details show increasingly more consumers are postponing purchases of big-ticket items, while two-thirds of consumers plan to make some cuts in spending in the months ahead because of higher prices.
No surprise, the dip in confidence is tied back to the surge in energy prices, which has only worsened amid ongoing affordability pressures. Both the University of Michigan and the Federal Reserve’s Survey of Consumer Expectations show a sharp rise in near-term inflation expectations, though medium-and-longer term measures remain well anchored.
… But Price Pressures are Building
Since the onset of the Iran war, prices at the pump are up +40% and currently sit around $4.30 per-gallon. For the average two-car household, this means it now costs an extra $125 per month just to fuel their vehicles. And that’s just the first layer of the price shock. Secondary price effects on things like grocery and restaurant costs, airfares and many other goods which have an associated transportation cost, are likely to show up in the months ahead. Based on our modelling of past energy shocks, the passthrough to things like airfares is quick, typically within 1-3 months, while food and “core” goods are 3-9 months. Finally, there’s the impact to broader services (excluding shelter), which typically comes indirectly through upward pressure on wages. This sometimes doesn’t rear its head for a year after the onset of the energy shock. However, this second-round effect would require energy prices to remain elevated for a sustained period and would also require some tightening in labor market conditions, allowing workers to negotiate higher wages.
Larger Tax Refunds Will Offer Short-term Cushion, For Some
At the start of the year, we expected the retroactive nature of the OBBBA tax cuts to generate higher tax refunds for the average household, totaling as much as $800 per filer ($1,600 per household). This was expected to offer some tailwind for households, which was going to come at a relatively opportune time as savings buffers were thinning amid last year’s softening in the labor market.
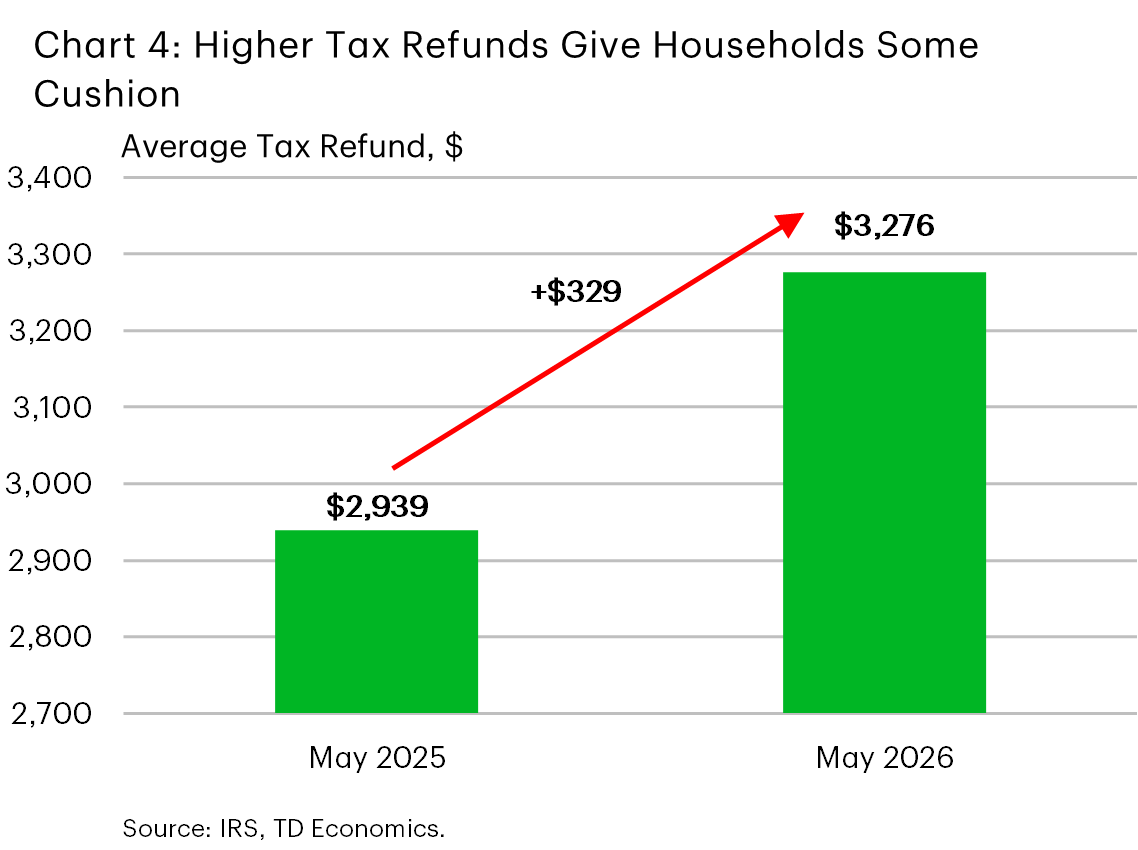
However, the energy shock flipped the script on the narrative. Instead of offering a tailwind to spending, the refunds will now serve as more of a cushion. Unfortunately, the cushion has proved to be thinner than originally expected, with the average refund closer to $350 or less than half what most economists had anticipated (Chart 4). There are several reasons for the discrepancy, but perhaps the most notable is the IRS’s redesigned W-4, which has significantly improved withholding accuracy. At the same time, the past year’s strong gains in equities, and other financial holdings may have resulted in higher realized investment and interest income, raising taxable liabilities and offsetting some of the expected refund. Lastly, the share of individuals working multiple jobs rose to a 21 year high of 5.4% in 2025. A rise in multiple job holders tends to result in under-withholding – especially for the secondary job – which was likely another factor contributing to the smaller increase in refunds.
U.S.-Iran Conflict Resolution Still Base Case
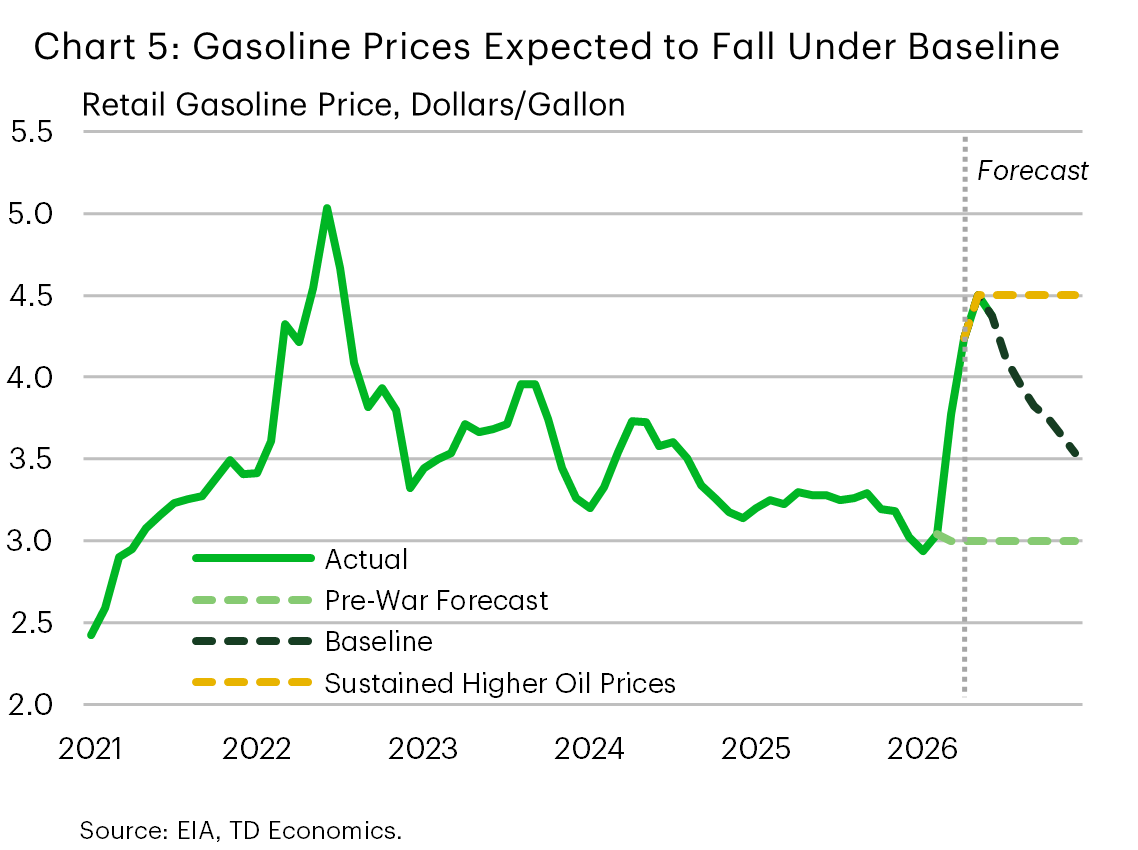
Under our baseline forecast, we still assume a diplomatic resolution to end the U.S.-Iran conflict is reached over the next month, allowing oil flows to gradually normalize through the summer. Oil prices are expected to gradually drift lower, reaching $80 per barrel by year-end. Under these assumptions, households could start to see some relief at the pump over the next month, though it’s unlikely that gas prices will return to pre-conflict levels by the end of this year. Assuming no substitution or demand destruction, this implies that the average household will have exhausted their entire tax refund by September, simply by paying higher fuel costs! On the plus side, the refunds will have largely insulated households from the worst of the shock, while the secondary effects would likely be small given its relatively short duration. Overall, the hit on consumer spending is modest, but not insignificant. We’ve lowered our consumer spending forecast to around 2% for this year, down from our pre-conflict forecast of 2.5%.
Under an alternative scenario, where oil prices are sustained at current levels, keeping fuel prices elevated (Chart 5), households would burn through their tax savings one month faster, but the price effects would be sustained through year-end. Relative to our pre-conflict baseline forecast, average gasoline expenditures would be higher by $1,250 per household, or roughly $550 more than this year’s tax refund. Moreover, the second-round price effects would also be more pronounced relative to the baseline. The combination of the two forces would likely lead to even more demand destruction, particularly within discretionary spending. Under this scenario, consumer spending would grow at a more tepid 1.5% this year. Outside of the pandemic, this would be the slowest annual pace of spending since 2012! And, because of the persistence in the shock, the impact would spill over into 2027 resulting in an even larger drag on consumer spending next year.
Stretching the “K”
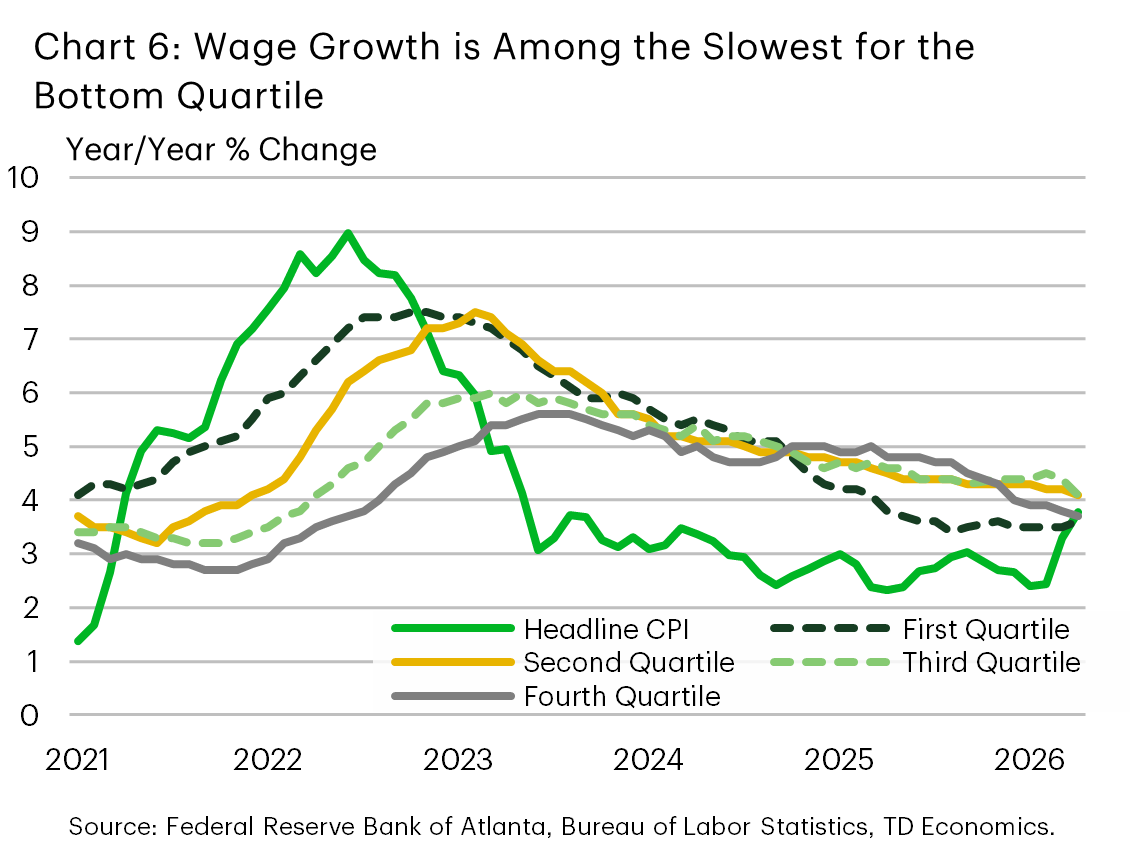
Beyond the tax refunds, the average household has little in the way of excess savings to fall back on. As of April, the savings rate slipped to a near four-year low of 2.6%. And the effects aren’t being felt evenly. Wage growth for the bottom quartile of earners has persistently underperformed the top 75th percentile since late-2024 (Chart 6). The energy shock has only exacerbated the problem, as headline inflation is now running faster than wage growth for the bottom quartile. At the same time, lower-income earners have benefited the least from OBBBA tax changes. Analysis done by the Tax Policy Center suggests that the bottom quintile of earners would see an after-tax income boost of just 0.8%, or $150 compared to $1,780 for middle income households.
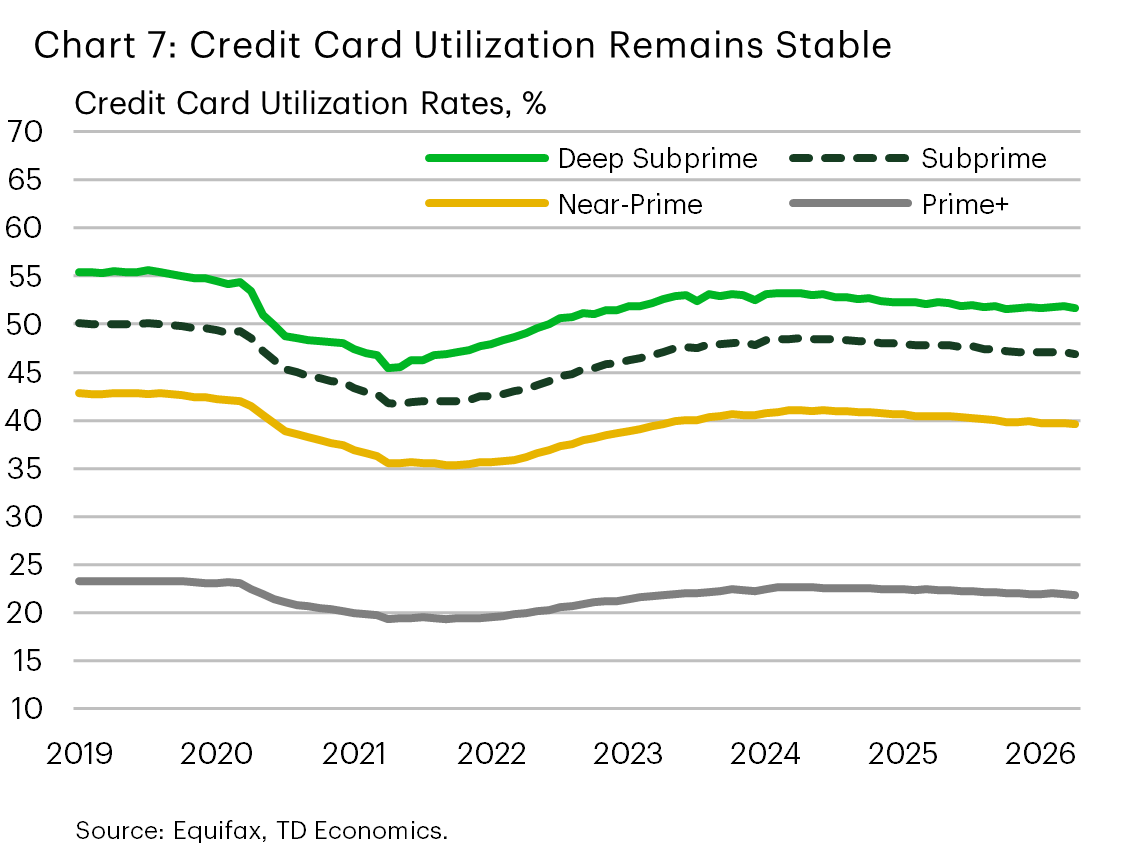
One might assume that under these increasingly stretched conditions consumers have already started to lean more heavily on credit. But credit card utilization rates through the month of April have remained stable to slightly lower relative to pre-conflict levels across all borrowing tiers (Chart 7). This suggests households are cognizant of their financial situation and, amid a relatively soft labor market backdrop, are electing to not pursue debt fueled consumption. But how do we square this with the recent pick-up in discretionary spending? We know that higher income households have a larger share of their outlays on discretionary categories. According to the Consumer Expenditure Survey, roughly 70% of outlays by consumers in the top income quintile are discretionary, in contrast with roughly 50% of outlays for the lowest 20% of income consumers. So, when we see discretionary spending grow, we know that this is disproportionately spending by higher income consumers.
Looking at it another way, the biggest contributors to discretionary spending have been (in order) financial services, recreational goods (including motorized recreational vehicles, toys, sporting goods, electronics, etc.), recreational services, and clothing & footwear. Within financial services, most of the strength has been driven by two categories: “portfolio management and investment advice” and “financial services furnished without payment”. The latter is a more nuanced spending category that includes banking and intermediation services that households receive indirectly rather than through an explicit fee. This would be through interest rate spreads or reduced returns on things like deposit account services. Either way, both are services that are likely more driven by higher-income households, who have excess deposits to invest. The same holds true for spending on recreational goods & services. Attending a World Cup game or buying the newest smart watch are purchases that are unlikely to be made by those who are living paycheck-to-paycheck amid the ongoing affordability challenges.
Importantly, credit card delinquency rates have remained broadly stable, apart from “Deep Subprime” borrowers (i.e. FICO < 580) which have edged a bit higher. However, this is a relatively small corner of the market, accounting for just 3% of overall card balances. Nonetheless, it is something worth monitoring in the months ahead as rising delinquencies across lower credit quality borrowers tend to lead other borrowing tiers.
Bottom Line
The U.S. consumer has (so far) shown resilience through the energy shock. Spending growth has stabilized at a rate largely consistent with its pre-conflict pace, as higher tax refunds attributed to OBBBA tax changes have provided some near-term cushion. However, spending at the aggregate level is likely misrepresenting underlying dynamics, with lower-income households already feeling squeezed amid ongoing affordability pressures.
Provided the energy shock is short-lived, we still see consumer spending expanding around a 2% pace this year – a modest mark-down from our pre-conflict forecast of 2.5%. But if oil prices were to stabilize around current levels through year-end, the hit to spending is likely to be more meaningful. Not only would higher fuel prices exhaust tax refunds sooner, but it would also lead to more meaningful second round price effects which would spill over into next year, materially worsening affordability conditions.
Disclaimer
This report is provided by TD Economics. It is for informational and educational purposes only as of the date of writing, and may not be appropriate for other purposes. The views and opinions expressed may change at any time based on market or other conditions and may not come to pass. This material is not intended to be relied upon as investment advice or recommendations, does not constitute a solicitation to buy or sell securities and should not be considered specific legal, investment or tax advice. The report does not provide material information about the business and affairs of TD Bank Group and the members of TD Economics are not spokespersons for TD Bank Group with respect to its business and affairs. The information contained in this report has been drawn from sources believed to be reliable, but is not guaranteed to be accurate or complete. This report contains economic analysis and views, including about future economic and financial markets performance. These are based on certain assumptions and other factors, and are subject to inherent risks and uncertainties. The actual outcome may be materially different. The Toronto-Dominion Bank and its affiliates and related entities that comprise the TD Bank Group are not liable for any errors or omissions in the information, analysis or views contained in this report, or for any loss or damage suffered.
Download
Share: