Banking Stress to Weigh on Economic Growth but May Not Upend It
James Marple, Associate Vice President | 416-982-2557
Date Published: May 16, 2023
- Category:
- US
- Financial Markets
Highlights
- Recent bank failures have drawn attention to past periods of financial stress, particularly the savings and loan (S&L) crisis that lasted through the 1980s and early 1990s.
- Sharply rising interest rates contributed to an initial wave of S&L failures. However, regulatory forbearance and changes in legislation extended the crisis, allowing insolvent firms to continue to operate while taking on more risk.
Regulators have responded much more quickly to insolvency this time around and so far, contagion remains limited. - Overall financial conditions appear more favourable than past stress periods, but challenges in the banking sector have led to tightening in lending standards and reduced credit availability. This is expected to contribute to a pullback in business investment over the course of this year.
Several high-profile bank failures have drawn attention to past periods of financial instability and their impact on the economic outlook.
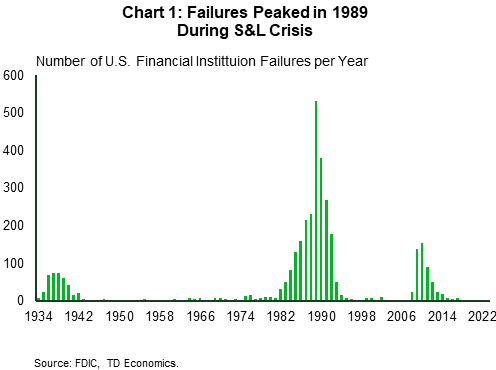
Bank failures are not new, but they are relatively rare (Chart 1).1 There are a few notable exceptions: the Global Financial Crisis (GFC) beginning in 2008, the savings and loans (S&L) crisis through the 1980s, and the Great Depression of the 1930s.
Of these periods, the one most relevant today is the S&L crisis, which had its origin in rapidly rising interest rates and the subsequent mismatch this created between assets and liabilities within S&Ls. There are also important differences. A very different regulatory response allowed that crisis to fester for a decade, with strong growth in the sector through the middle of the decade followed by worsening failures later on.
The current situation appears more benign. Overall financial conditions are more favorable, and with a swift action by regulatory bodies, contagion remains limited. Still, stresses in the banking sector are likely to weigh on economic growth, particularly within business investment. Credit conditions for households have also tightened but not as much as business lending categories. Supported by rising incomes, consumer spending should continue to support modest economic through the remainder of this year.
Rising Interest Rates Created Challenges for S&L Business Model
The period that is most often cited as representative of today’s challenges in the banking sector is the long string of S&L failures that occurred through the 1980s and into the early 1990s. Rising interest rates created existential challenges for many S&Ls. With assets concentrated in fixed rate mortgages, earnings did not rise with increases in interest rates, but payments on deposits did, hastening insolvency.
In response to the challenges faced by S&Ls, changes were made to laws and regulations that, with hindsight, worsened the crisis. Rather than resolving failing institutions up front, many insolvent and undercapitalized institutions were allowed to carry on and take on more risk. To ease their burden, restrictions on asset classes, loan-to-value limits, and caps on interest rates paid to depositors were all removed. This led to rapid growth in the S&L industry through the mid-1980s, a boom that was temporarily aided by a reversal in interest rates. Led by commercial real estate lending, asset growth was particularly rapid in the Sunbelt and energy-producing regions of the country, with Texas growing the fastest of all.2
Unfortunately, much of this expansion ended in failure, as interest rates once again began moving higher later in the decade. In 1989, Congress passed the Financial Institutions Reform, Recovery and Enforcement Act, aimed at resolving the crisis. It set up the Resolution Trust Corporation (RTC) to close failed institutions and sell their assets. By the mid-1990s, over 1,000 S&L institutions had failed, making up more than a third of the total. And the cost to taxpayers was substantial, at an estimated $132 billion.3
Financial Conditions Today Do Not Show a Crisis of Confidence
The S&L crisis undoubtedly had a negative impact on the economy, but it was most concentrated in regions where the run up and subsequent collapse of commercial real estate values was most severe. In the mid-1980s, the Texas economy fell into recession, even as the rest of the country continued to grow.
It wasn’t until the final quarter of 1990s that the U.S. economy finally fell into recession.The tightening in lending standards that occurred in the aftermath of the S&L crisis is cited as one of the contributing factors to this recession.4 Still, it is not clear that the crisis alone would have been enough of a catalyst and other factors are often cited as more immediate culprits, namely tightened monetary policy and a sharp jump in oil prices following the Iraqi invasion of Kuwait.
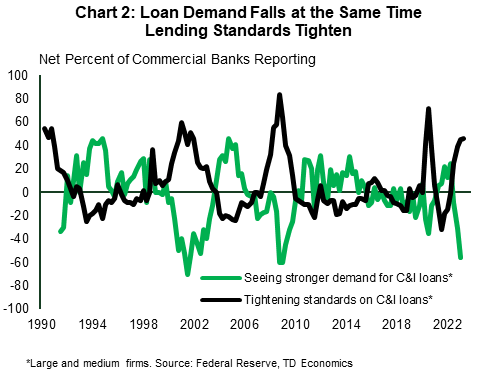
Isolating the impact of the banking crises and the accompanying tightening in lending standards on the economy is challenging. Difficulties often occur in an environment of rising interest rates, making it hard to separate causes from consequences. Many of the same factors that influence the supply of loans, such as changing expectations for economic growth, also influence the demand for credit. Indeed, demand for loans usually falls at the same time that lending standards are tightening (Chart 2), suggesting factors impacting both (i.e., higher interest rates) are more to blame.
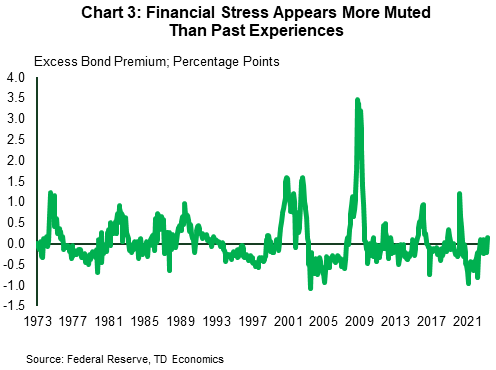
Economic studies have used a variety of econometric techniques to control for these common factors. One method is to use credit spread data, adjusted for firm-specific characteristics that capture changes in default risk. This “excess bond premium” is a measure of exogenous shocks to credit supply.5 The authors of this approach have continued to update their data through April of 2023. Importantly, the excess bond premium has not shown serious signs of deterioration (Chart 3) in recent months, in contrast to past periods of financial upheaval. While it rose into positive territory in April of this year, it is well below levels that preceded past crises periods.
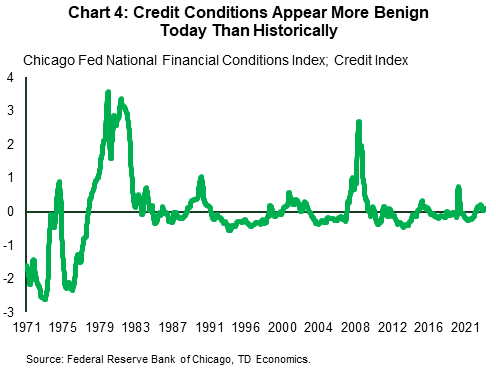
A similar picture emerges in broader measures of financial conditions. For instance, the Chicago Fed’s national financial conditions index remains below historical peaks. The credit component of the index shows higher levels of stress in the run up to past recessions than we see today (Chart 4).
Lending Standards Tighten, Investment Falls, then Credit Volumes Shrink
As in these past downturns, tightening lending standards are apparent in the Federal Reserve’s Senior Loan Officer Opinion Survey (SLOOS). The net-balance of banks tightening credit on commercial and industrial (C&I) loans and commercial real estate (CRE) is roughly similar to that observed in the 1990s and 2000s, but notably lower than during the GFC. Still, the tightening in lending standards and decline in loan demand suggests a pullback in investment spending is in store.
Notably, declines in investment spending tend to occur before declines in bank credit outstanding. In past cycles, banks tightened credit for commercial and industrial (C&I) loans and CRE loans in the lead up to the recession, but overall lending did not decline until several quarters later. Economic literature on the topic suggests that in the initial stages of an economic slowdown, firms continue to borrow by drawing on existing credit lines even as they cut back on investment.6 We expect a similar pattern to occur this time around, with the combination of tighter standards and lower demand leading investment to pull back further over the remainder of this year, showing up in declining credit volumes next year.
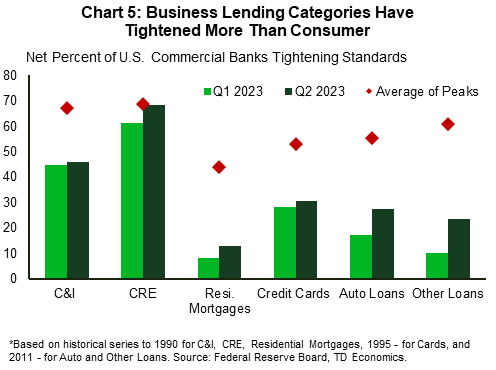
The good news is that credit conditions on households (Chart 5) have not tightened as severely. The net percentage of banks reporting tighter standards on mortgages and consumer lending products has increased, but not as much as business categories.
While demand for these lending categories has fallen due to higher interest rates, this is not a new development and was already incorporated into the economic outlook. Consumer spending is expected to slow, but with continued resilience in the labor market may be supported by income growth rather than any substantial increase in consumer leverage.
Conclusion
Federal Reserve Chairman Jerome Powell’s recent press conference following the Federal Open Market Committee’s (FOMC) interest rate announcement in early May noted that strains in the banking sector were likely to lead to even tighter lending standards. In turn, this would weigh on the economic outlook. However, he also noted that this outlook (and implicitely the measurement of the impact of tightened lending standards) was highly uncertain. This uncertainty is well established in the economic literature as well as historical precedent.
Returning to the experience during the S&L crisis, it is hard to argue that the period was a direct catalyst of the economic downturn of the early 1990s, though a case can be made that it was a contributor. As occured then, there will be some transmission of tighter credit standards that will slow business investment and weigh on economic growth relative to the counterfactual of the banking crisis having never occurred. The difference this time around is that a swift and deliberate policy response, alongside signs of ongoing economic resilience suggest it may not be enough to push the economy into recession.
End Notes
- The number of bank failures was highest during the S&L crisis, but the total value of assets of failed institutions was highest during the financial crisis in 2008. Adjusted for inflation, bank failures this year are close to their peak value in the late 1980s. DeSilver, Drew. “Most U.S. Bank Failures Have Come in a Few Big Waves.” Pew Research Center, 2 May 2023, http://www.pewresearch.org/short-reads/2023/04/11/most-u-s-bank-failures-have-come-in-a-few-big-waves/.
- Federal Deposit Insurance Corporation (FDIC). 1997. “ The Savings and Loan Crisis and Its Relationship to Banking,” in History of the Eighties: Lessons for the Future. Vol. 1, An Examination of the Banking Crises of the 1980s and Early 1990s. Washington, DC: FDIC. Chapter 4, 167-188. https://www.fdic.gov/bank/historical/history/167_188.pdf
- Ibid.
- Walsh, Carl. E. “What Caused the 1990-1991 Recession?” Federal Reserver Bank of San Francisco Economic Review Number 2 (pg. 33-48). https://www.frbsf.org/economic-research/wp-content/uploads/sites/4/93-2_34-48.pdf
- Favara, Giovanni, et al. “Updating the Recession Risk and the Excess Bond Premium. FEDS Notes, vol. 16, no. 1836, 2016, https://www.federalreserve.gov/econres/notes/feds-notes/updating-the-recession-risk-and-the-excess-bond-premium-20161006.html#:~:text=The%20EBP%20’
- Gilchrist, S. and E. Zakrajsek. “Bank Lending and Credit Supply Shocks,” in The Global Macro Economy and Finance ed. F. Allen et al (International Economics Association, 2012), 154-176. https://link.springer.com/chapter/10.1057/9781137034250_9
Disclaimer
This report is provided by TD Economics. It is for informational and educational purposes only as of the date of writing, and may not be appropriate for other purposes. The views and opinions expressed may change at any time based on market or other conditions and may not come to pass. This material is not intended to be relied upon as investment advice or recommendations, does not constitute a solicitation to buy or sell securities and should not be considered specific legal, investment or tax advice. The report does not provide material information about the business and affairs of TD Bank Group and the members of TD Economics are not spokespersons for TD Bank Group with respect to its business and affairs. The information contained in this report has been drawn from sources believed to be reliable, but is not guaranteed to be accurate or complete. This report contains economic analysis and views, including about future economic and financial markets performance. These are based on certain assumptions and other factors, and are subject to inherent risks and uncertainties. The actual outcome may be materially different. The Toronto-Dominion Bank and its affiliates and related entities that comprise the TD Bank Group are not liable for any errors or omissions in the information, analysis or views contained in this report, or for any loss or damage suffered.
Download
Share: