Smooth Sailing: Analyzing the Drivers of Easing U.S. Financial Conditions
James Orlando, CFA, Director & Senior Economist | 416-413-3180
Brett Saldarelli, Economist | 416-542-0072
Date Published: July 16, 2024
- Category:
- U.S.
- Financial Markets
Highlights
- U.S. financial conditions have eased to their loosest levels since early 2022 on the back of record high equity prices, declining corporate credit spreads, and relative calm in Treasury markets.
- Financial markets have been supported by a multitude of tailwinds, including expectations for policy rate cuts from the Fed, opportunities related to generative AI, and investment in the green transition.
- Even though it has been smooth sailing for markets so far in 2024, the outlook is not without risks. Another upturn in inflation, an escalation of geo-political tensions in the Middle East, or fallout from the U.S. election could cause financial conditions to reverse course.
U.S. financial conditions – a measure of the health of financial markets - have eased to their loosest levels since the Federal Reserve started hiking interest rates in 2022. This is largely in part due to robust economic growth that has been complemented by excitement related to generative AI, huge investments in the green transition, and the promise of lower interest rates from the Fed. Not only has this boosted equities and corporate bonds, but has also improved conditions in the U.S. Treasury market, where volatility has receded. While easy financial conditions are expected to act as a tailwind for future economic growth, some Fed members have highlighted that they also pose an upside risk to the inflation outlook. In this paper we assess each of the drivers of easing financial conditions and the economic risks which could create a sudden reversal.
Equity Markets: The Bull Continues to Run
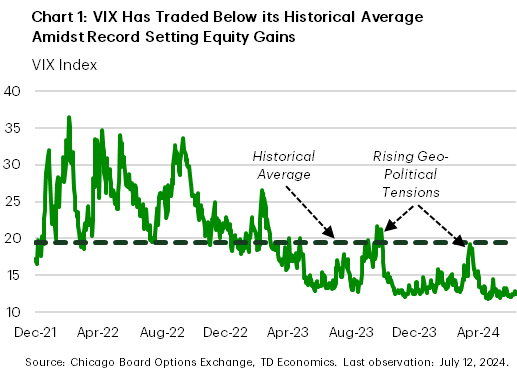
Equity markets have been on an incredible run in 2024. The S&P 500 has gained close to 20% year-to-date and over 40% since the end of 2022. Indeed, it has been more than 600 days since the last correction of 15% or more. The gains are even more remarkable when one considers that equity markets have weathered several headwinds including a regional banking crisis, various geopolitical conflicts, and the Federal Reserve’s historic rate hiking cycle. The extended period of gains has been reflected in the S&P 500 Volatility Index (VIX), which has traded in a range below its historical average since the end of 2023 (Chart 1).
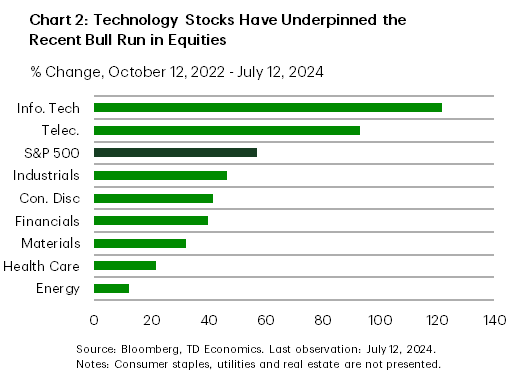
The strength in equity markets has been underpinned by expectations that the Federal Reserve will begin easing its policy stance in 2024 and excitement over the potential gains from the adoption of generative artificial intelligence (AI). The AI fervor has been underscored by the information technology sub-index, which has advanced close to 100% since the end of 2022 (Chart 2). This has caused investors to draw comparisons to the dot-com bubble in 2000, when investors poured money into stocks on the back of easy financial conditions and optimism surrounding the profitability of technology firms.
The performance of the S&P 500 is even more impressive when comparing it to its international peers. The S&P 500 has more than tripled the return of the TSX composite index, which has returned approximately 5% over the first half of 2024. The story is similar when drawing comparisons to equity markets across the pond. The Euro STOXX and British FTSE 100 Indexes have returned approximately 6% so far in 2024. Such U.S. outperformance has been a driving force behind the incredibly loose financial conditions over 2024.
Credit Spreads: Following the Equity Rally
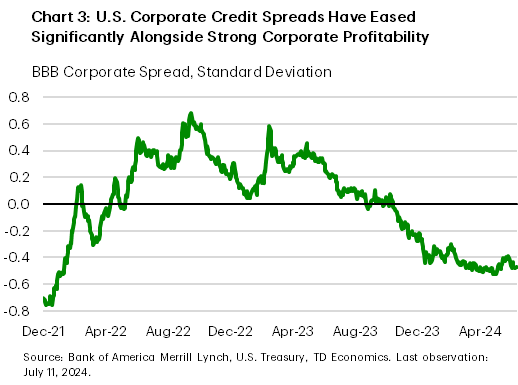
Corporate credit spreads have also been trending favorably since late-2022 (Chart 3). Most investment grade spreads have moved in line with their long-run averages, while higher risk non-investment grade spreads are comfortably below their historical averages with the BB and B spreads reaching levels last seen in 2022 and 2021, respectively. Indeed, the 10-year BBB rate has fallen approximately 100 bps since its 2022 peak. Non-investment grade borrowing costs have seen more pronounced declines, with the BB rate, B, and CCC rates down 163 bps, 266 bps, and 318 basis points, respectively.
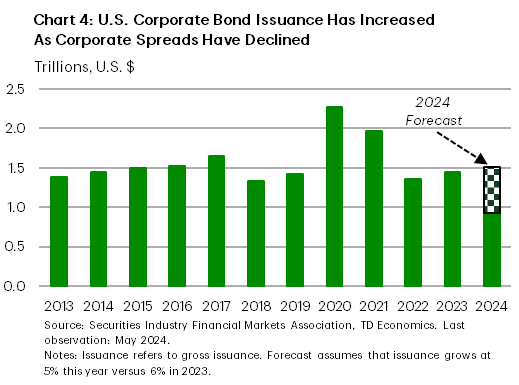
The declines in corporate borrowing costs have been supported by the same factors as U.S. equities. The opportunity related to new technologies and government-supported green investment has boosted profits and the ability of firms to pay debts. Firms have also benefitted from higher commodity prices. One caveat is that even with firms seeing strong profits (which should enable them to use organic sources of funding for operations), we have seen corporate issuance starting to rise (Chart 4). Current tracking for issuance in 2024 is well above last year, a trend that could limit further easing in corporate fixed income financial conditions.
Treasury Markets Finally Starting to Ease
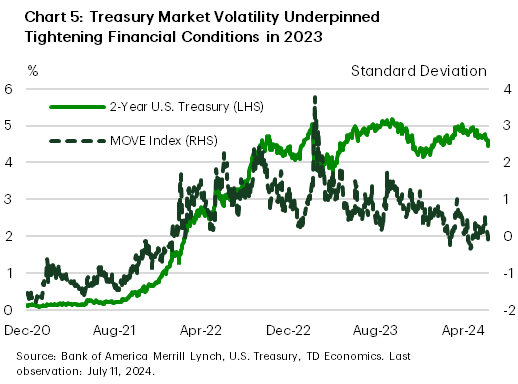
With the Federal Reserve bringing its policy rate from the zero lower bound in 2022 to 5.5% in 2023, U.S. Treasury market volatility has been a major source of tight financial conditions over the last two years. This has been reinforced by the MOVE Index – a barometer of volatility in the Treasury market - reaching levels last seen during the Global Financial Crisis (Chart 5).
Treasury market volatility had remained within a tight range for a full two-year stretch (starting in March 2022), but there has been a notable change over the last few months. Easing inflationary pressures have raised hopes that the Fed will begin cutting its policy rate in the coming months. This has been reflected in futures markets, which are priced for upwards of 50 basis points in cuts this year with more than 100 basis points expected in 2025. This easing path may not be as dramatic as what was once hoped, but it has been enough to push Treasury yields lower. The U.S. 2- and 10-year Treasury yields are currently close to 80 basis points below their late 2023 peaks. This has aided equity and corporate bond markets mentioned above, but has also cascaded to the mortgage market, where the 30-year fixed term rate has dropped by around 90 basis points from its 2023 peak and remains just below 7%. One could argue that even though the Treasury market has been the slowest to exhibit loosening financial conditions, it may be the most important to ensure that broad financial conditions remain easy through the rest of this year.
There May Be Hurdles to Navigate in the Near Future
While the economic backdrop has been favorable for financial markets, this doesn’t mean that the rest of the year will be without hurdles. For starters, the equity rally has been heavily criticized for being driven by a small number of rapidly rising stocks. This lack of breadth has even been compared to the 2000s tech bubble. Such vulnerability could be made worse should expectations for Fed rate cuts be called into question. Another upturn in inflation like what occurred earlier this year could also be a catalyst. So too could an escalation in Middle East tensions. And let’s not forget about risks related to the U.S. election, which could spark a redux of the 2018 U.S./China trade war that caused a wave of equity market volatility.
Bottom Line
Financial conditions have eased to exceptionally loose levels over 2024. The relative stability of the American economy has soothed investor fears over the potential for recession, while enthusiasm related to generative AI and investment in the green transition has raised investor optimism. The expectation for the Federal Reserve to begin cutting interest rates in the latter half of 2024 has also contributed. All this has combined to support record high equity prices, narrowing corporate spreads, and muted volatility in the Treasury market.
While the outlook is littered with risks that could disrupt these halcyon financial markets, investors have so far been able to navigate every hurdle. This speaks to the old adage, “The trend is your friend, until the end when it bends”.
Disclaimer
This report is provided by TD Economics. It is for informational and educational purposes only as of the date of writing, and may not be appropriate for other purposes. The views and opinions expressed may change at any time based on market or other conditions and may not come to pass. This material is not intended to be relied upon as investment advice or recommendations, does not constitute a solicitation to buy or sell securities and should not be considered specific legal, investment or tax advice. The report does not provide material information about the business and affairs of TD Bank Group and the members of TD Economics are not spokespersons for TD Bank Group with respect to its business and affairs. The information contained in this report has been drawn from sources believed to be reliable, but is not guaranteed to be accurate or complete. This report contains economic analysis and views, including about future economic and financial markets performance. These are based on certain assumptions and other factors, and are subject to inherent risks and uncertainties. The actual outcome may be materially different. The Toronto-Dominion Bank and its affiliates and related entities that comprise the TD Bank Group are not liable for any errors or omissions in the information, analysis or views contained in this report, or for any loss or damage suffered.
Download
Share: