Highlights
- At his latest press conference Federal Reserve Chair, Jay Powell struck a dovish tone, noting how far the economy is from achieving the Fed’s “maximum employment” goal.
- The Fed is not wed to any particular labor market indicator in determining maximum employment, and is increasingly willing to look at a broader range of metrics besides the unemployment rate.
- With the April jobs report in hand, we can take stock across a range of indicators to gauge how far we’ve come and how far we still have to go.
- Even maintaining the recent (admittedly disappointing) rate of improvement, the labor market will approach maximum employment over the next two years. However, as evidenced in robust job openings, getting there will be just as much a matter of supply as demand.
At his press conference at the end of April, Federal Reserve Chair Jay Powell repeated the mantra that “the economy is a long way from our goals, and it is likely to take some time for substantial further progress to be achieved.”
The disappointing rate of job growth in April seemed to echo Powell’s statement, with 266 thousand jobs created (against a consensus estimate over one million) and an unemployment rate that ticked up a tenth of a percentage point (to 6.1%). With the April job report in hand, it is worth taking stock of how far we’ve come and how long it might take to reach those goals against a range of labor market indicators.
For many indicators, the labor market is still well behind the pre-pandemic levels. At the rate of improvement over the past three months, it will take until 2022 or 2023 to fully recover. However, record high job openings and healthy wage growth suggests that getting back to normal is as much a matter of labor supply as labor demand.
Strategies, tactics and measures
Well before Powell’s statement, the Fed had made changes to its characterization of its goals. In August 2020, the Federal Reserve updated its long run strategy document to take a more inclusive view of progress in the labor market toward “full employment.” The Fed pledged to concern itself more with “shortfalls” from maximum employment than “deviations” from it. In other words, it will not be as concerned with unemployment running below its longer-run goal as moving above it.
The Fed also reduced emphasis on the unemployment rate as its sole measure of “maximum employment” and has increasingly pointed to a wider range of indicators. The Fed has not endorsed an official list of indicators, but Fed governors have pointed to the employment-to-population ratio, labor force participation, and gaps in employment rates between different segments of the population. A broader list of indicators and their progress is included in Table 1.
Table 1: Tracking Progress toward "Maximum Employment"
| Labor Market Indicator | Current level | Pre-recession level | Gap (percent or percentage points) | Date of return at current rate of improvement |
| Unemployment rate (%) | 6.1 | 3.5 | 2.6 | Q1 2022 |
| Non-farm payrolls (millions) | 144.3 | 152.5 | -5.4 | Q3 2023 |
| Employment-to-population ratio (%) | 57.9 | 61.1 | -3.2 | Q2 2023 |
| Employment-pop ratio (25-34) (%) | 76.9 | 80.5 | -3.6 | Q1 2023 |
| Participation rate (%) | 61.7 | 63.4 | -1.7 | Q2 2022 |
| Job opening rate (%) | 5.6 | 4.7 | 0.9 | Already above |
| Quit rate (%) | 2.4 | 2.2 | 0.2 | Already above |
| Atlanta Fed wage tracker (% change) | 3.4 | 3.8 | -0.4 | Uncertain* |
Unemployment Rate has Been Distorted by the Pandemic
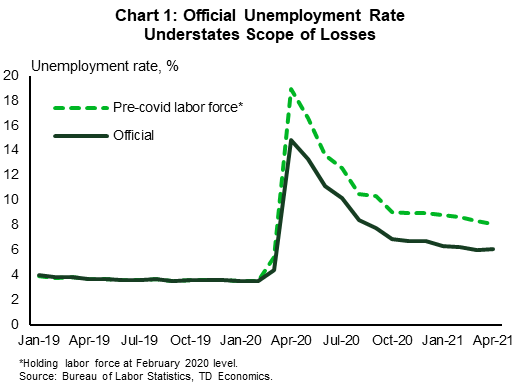
There is good reason to look past the unemployment rate in the current pandemic environment. The inability of many people to look for work due to the health crisis itself has resulted in a decline in the labor force that has made the official unemployment rate less comparable to history. This official measure edged up to 6.1% in April, but holding the labor force at its pre-recession level of February 2020, would equate to an unemployment rate of 8.1% (Chart 1). This may be overstating the level of unemployment, as downturns always lead to some people leaving the labor force. Another estimate by Jason Furman of the Peterson Institute, which counts as unemployed people who are “not at work for other reasons” as well as people who have left the labor market over and above the 2008 recession, yields a “realistic” unemployment rate of 7.6%.1
This is a measurable difference. Following the Great Recession, it took almost a year and a half for the unemployment rate to fall from 7.6% to 6.1% (and almost years to fall from 8.1% to 6.1%). Still progress is being made. If the rate of improvement over the past three months persists going forward, it would take until roughly the fourth quarter of 2022 for these augmented rates to hit the pre-recession level of 3.5%.
Employment is Still Well Off Peak and Even Further Behind Pre-Pandemic Trend
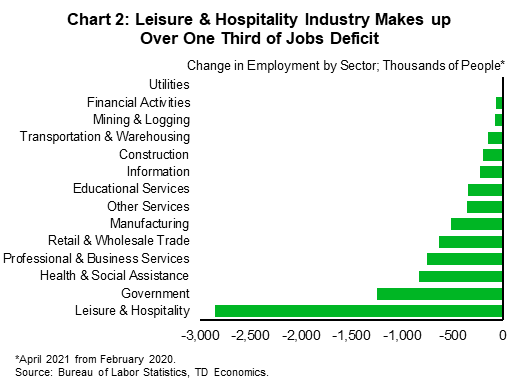
A simpler measure to gauge the health of the labor market is to look at the overall level of employment. With the 266k jobs created in April, total U.S. employment is 8.2 million (5.4%) below its pre-recession peak.
Much of this shortfall is within accommodation and food services. This is down by over 2.8 million from its pre-recession peak (Chart 2). And, this job deficit can be refined further. Within this category, food services and drinking places (restaurants and bars) account for 1.8 million of the jobs lost. Despite April’s disappointing payrolls performance, there was a silver lining. Healthy job growth occurred in the hardest hit sector of the leisure categories, and this should continue with each incremental step to re-open the economy. As it does, labor demand will shift from goods production back to services.
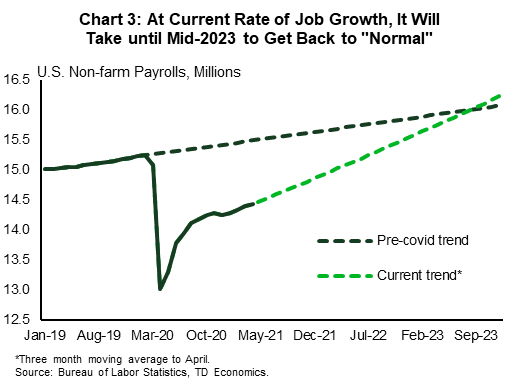
However, the road back to ‘normalization’ remains a long one. There are two aspects to an employment recovery. The first is to just “return to where you were”. The second, and more important, is to “return to where you should have been”. Had it not been for the pandemic, economy-wide jobs would have kept growing through this period. The ‘counterfactual world’ of what should have been suggests that the employment shortfall is larger at 10.6 million (6.8%). If the rate of improvement over the past three months does not accelerate, the two lines will not cross until the third quarter of 2023 (Chart 3).
Labor Force Participation Rate Improving Slowly
As noted above, the labor force participation rate has been directly impacted by the downturn. Encouragingly, the participation rate rose in April (up 0.2 percentage points). Still, after falling 3.2 percentage points (pp) during the initial lockdown, it has recovered only 1.5 pp to-date.
All of the improvement in April was among men, whose participation rose 0.3 pp. The participation rate of women was unchanged in the month. Overall, the participation rates of men and women are both down 1.7 pp from pre-recession levels.
The trend in the overall participation rate is difficult to ascertain. With an aging population, more people at the higher-end of the age spectrum are leaving the labor force than young people entering it. As a result, unless participation rates rise within each age bracket, the aggregate rate will fall. Prior to the pandemic, the participation rate was rising among almost all age cohorts and demographic groups, offsetting the aging impact.
However, one of the consequences of this downturn has been a more noticeable decline in the participation rate of older cohorts (people 55 years and older). For males, the participation rate of this age group is down 2.4 pp as of April, while for women it is down 1.4 pp. With many of these folks close to retirement age, it is hard to predict how many of them will return to the workforce after the crisis, however an increase in the share of people “outside the labor force who do not want a job now” suggests that many of them will not return.
At the same time, the labor force participation rate of the youngest workers (15-19) is currently higher than its pre-recession level for both men and women. This may reflect a number of virus-related factors including a dearth of extracurricular activities, a feeling of less susceptibility to the virus, or perhaps a need to supplement household income given losses among older members. It remains to be seen if this rise is sustained in the post-pandemic world.
Finally, the participation rate of core working-age people (25 to 54) is down more for women (-1.8 pp) than for men (-1.4 pp) with an even bigger gap among the 25 to 34 population (-2.4 pp for women compared to -1.2 pp for men). This likely reflects the burden of childcare falling disproportionately on women and puts focus on the importance of re-opening schools and childcare centers in order to increase labor supply.
Simply moving age-specific participation rates back to their pre-crisis levels among all age groups would imply an aggregate labor force participation rate of 63%. At the current rate of improvement, it will take until the second quarter of 2022 to reach that level.
Employment to Population Ratio Has a Long Way to Go
Another commonly cited measure that avoids the labor force participation rate is the employment-to-population ratio. This reached a recent high of 61.1% in February 2020 and currently sits at 57.9%. It has come a long way from its trough of 51.3% last April. However, should the recent rate of improvement persist it will take until the third quarter of 2023 to retake its pre-recession level.
The employment-to-population ratio also has its shortcomings. As with the participation rate, population aging tends to put downward pressure on the aggregate level. To correct for this, economists home in on the employment ratio for people in their prime working years, between the ages of 25 to 54. Prior to the pandemic, this reached a high of 80.5% of the population. In April it rose to 76.9%. At the recent rate of improvement, it will regain its pre-recession level in the second quarter of 2023.
Notably, the peak in the employment-to-population ratio of 25 to 54 year-olds was not an all-time high. This was reached 21 years ago in April 2000 at 81.9%. At the current rate of improvement, it will take until the final quarter of 2023 to hit this goal. This can only come with continued improvement in labor force participation, especially among women and visible minority groups.
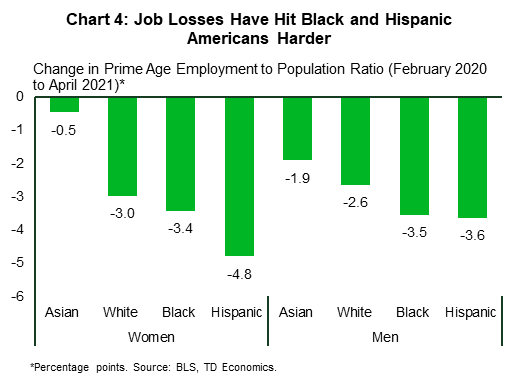
Indeed, prior to the COVID-19 recession, the U.S. labor market was firing on all cylinders, leading to an improvement not only in the unemployment rate, but in reducing disparities between groups. These gaps are once again elevated relative to the pre-recession trend (Chart 4) and progress on closing them will also be something watched for among monetary policy makers.
Strong Labor Demand Evident in Record Rate of Job Openings
Two metrics that have not been impacted by the recession are the level of job openings and the number of people quitting their roles. The job opening rate in March (the data is lagged a month), rose to an historic high of 5.3% of total employment, above its pre-recession peak of 4.7%. Even in absolute level terms, the number of job openings in March rose to an-historic high of 8.1 million. This suggests healthy demand for labor. Openings are especially elevated for leisure and hospitality jobs, but are also high for manufacturing relative to the pre-pandemic level.
The level of quits is also slightly higher than its pre-recession level at 2.4% compared to 2.2% prior to the pandemic. A high level of quits also seems to signal tighter labor market, indicating that people have confidence that they will find a new job, or perhaps already have one lined up. The pickup in labor market turnover is a strong indication that this is not a typical recessionary labor market.
Wage Growth Not Following Typical Recessionary Dynamics
An inability to find workers is a symptom of the health crisis and, in addition to showing up in the openings and quits data, is also likely contributing to higher wage growth. Even without shortages, the aggregate wage data has been distorted by the disproportionate negative impact on jobs at the lower end of the wage spectrum, especially during the initial lockdown. This impact, however, appears to have largely fallen out of the data. Even with strong monthly wage growth in April (+0.7%), year-on-year wage growth fell to 0.3% in April, from 4.3% in March.
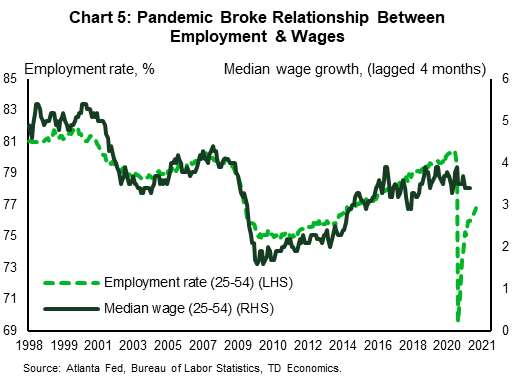
A better indicator that compares wage growth for the same pool of workers is the Atlanta Fed Wage Tracker. It was up 3.4% year-on-year in March – down slightly from its pre-recession level of 3.8%. This speaks to the unique nature of the push-pull impact of this recession. Indeed, prior to the pandemic, median wage growth for core working age people (25 to 54) was highly correlated with the employment-to-population rate of this group. This correlation broke down during the pandemic and recovery. Little change in overall wage growth despite massive changes in jobs, implies constraints on both sides of the supply and demand equation (Chart 5, above).
Bottom Line
Putting it all together, the job market is still not where the Fed would like it to be, but looking across a range of indicators, even maintaining the current rate of improvement, it is likely to get there over the next two years. However, as shown in record-level job openings, quits and wages, supply may be just as much of an issue as demand. This will not last forever, and as the health crisis passes, schools and daycare centers open fully and extraordinary income supports wane, we expect to see an improvement in both, speeding up the labor market recovery from its pace so far this year.
End Notes
- Realistic measure also adjusts for aging. See details of Furman methodology here: https://www.piie.com/blogs/realtime-economic-issues-watch/us-unemployment-situation-worsens-november
Disclaimer
This report is provided by TD Economics. It is for informational and educational purposes only as of the date of writing, and may not be appropriate for other purposes. The views and opinions expressed may change at any time based on market or other conditions and may not come to pass. This material is not intended to be relied upon as investment advice or recommendations, does not constitute a solicitation to buy or sell securities and should not be considered specific legal, investment or tax advice. The report does not provide material information about the business and affairs of TD Bank Group and the members of TD Economics are not spokespersons for TD Bank Group with respect to its business and affairs. The information contained in this report has been drawn from sources believed to be reliable, but is not guaranteed to be accurate or complete. This report contains economic analysis and views, including about future economic and financial markets performance. These are based on certain assumptions and other factors, and are subject to inherent risks and uncertainties. The actual outcome may be materially different. The Toronto-Dominion Bank and its affiliates and related entities that comprise the TD Bank Group are not liable for any errors or omissions in the information, analysis or views contained in this report, or for any loss or damage suffered.
Download
Share: