- 2025 is shaping up to be a modestly better year than expected in our prior forecast. However, our provincial growth rankings are largely unchanged. Observed weakness in large manufacturing bases in Central Canada is as expected, while idiosyncratic factors are driving firmer performances elsewhere.
- Exports coast-to-coast dipped in the second quarter following a front-running of export activity to the U.S. the quarter prior. The outlook for Canadian trade has marginally improved as effective tariff rates have come in lower than our expectations. Across provinces, nominal exports to the U.S. from Quebec, Saskatchewan and Alberta have underperformed the nation as a whole. Evidence of an export rotation to non-U.S. markets is limited, with Ontario, Alberta, Newfoundland and PEI showing some promise.
- All provinces have taken steps towards the removal of interprovincial trade barriers. Ontario has arguably gone the furthest, followed by Nova Scotia, Manitoba, B.C. and PEI. Newfoundland and Labrador and New Brunswick have been more cautious. These encouraging developments could help offset some of the disruption caused by the Canada U.S.-trade war, but the scale of the boost could be limited. Notably, geographic barriers still exist, and not all provinces have trade agreements in place.
- We’re retaining our view that Canadian housing will continue its recovery, fueled by pent-up demand in B.C. and Ontario, although loose conditions will restrain the extent of price gains in these two markets. Activity remains considerably firmer outside of these two markets, with mid-to-high single-digit price growth performances on tap in the Atlantic, most of the Prairies and Quebec this year and next.
- Canada’s job market has recently shed over 100k jobs, driving the national unemployment rate to a cyclical high. Ontario has disproportionately absorbed the shock so far this year as its unemployment rate has risen faster than in other regions. We expect unemployment rates to drift lower as employment mildly improves and labour force growth stalls on the back of a standstill in population growth.
- Commodity producing provinces are still better positioned to weather trade-related headwinds. Production of key commodities in Alberta, BC, and Saskatchewan continues to trend higher as market demand has yet to wane. Some prices, particularly crude oil, have softened relative to our last forecast, but a broad-based mild recovery in commodity prices is expected through next year.
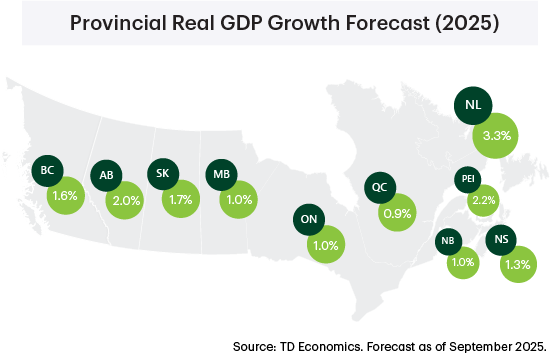
For more details on our national forecast see our Quarterly Economic Forecast
British Columbia
British Columbia Economic Forecasts
[ Annual average % change, unless otherwise noted ]
| Economic Indicators | 2025F | 2026F | 2027F |
| Real GDP | 1.6 | 1.3 | 1.7 |
| Nominal GDP | 3.8 | 3.7 | 3.9 |
| Employment | 1.0 | -0.1 | 0.9 |
| Unemployment Rate (%) | 6.2 | 6.2 | 5.6 |
| Housing Starts (000's) | 48.3 | 52.0 | 47.6 |
| Existing Home Prices | -3.1 | 3.5 | 3.6 |
| Home Sales | -4.2 | 18.2 | 10.4 |
We’ve kept our B.C. real GDP forecast unchanged for 2025, which keeps the province on pace to outperform the national average. Relative to its history, B.C.’s economic growth remains subdued, but it has managed to display more resiliency than we had expected amid the ongoing trade headwinds.
Natural gas production and exports volumes are being supported by the now-operational LNG Canada. What’s more, its Phase 2 expansion was recently included in the first wave of five nation-building projects receiving federal support. The project would double LNG Canada’s production and make it the second-largest facility of its kind in the world. Together with the $2 billion Red Chris Mine expansion in northwest B.C., these priority projects provide a lift to longer-term non-residential construction and investment prospects, with potentially more on the way.
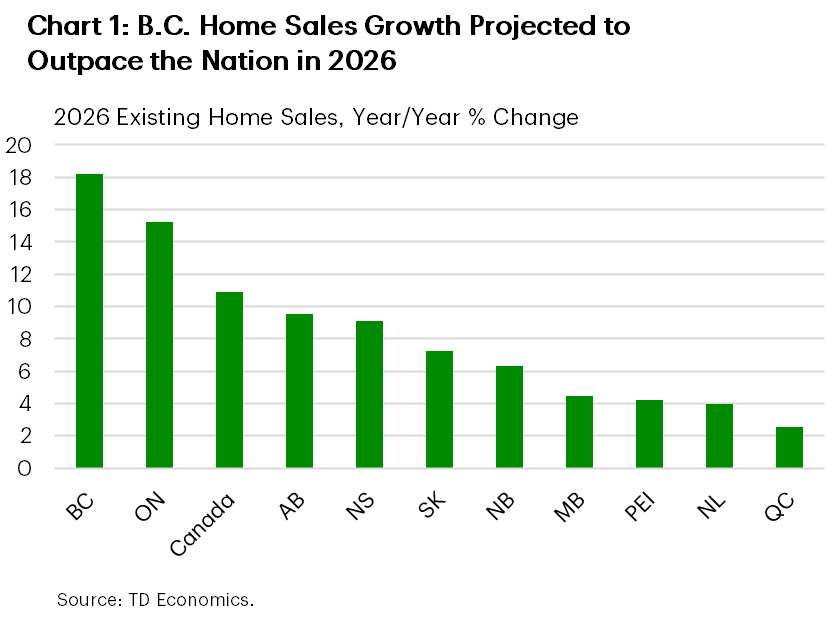
After starting the year on a soft note, residential investment appears to be turning a corner. Provincial housing starts have resumed an upward trend since May, driven largely by apartment developments, while sales of existing homes are up around 10% from their May low. With short-term rates likely to fall further by year end, we expect B.C.’s housing market to enter 2026 with positive momentum. Notably, we see resale volumes rising by a nation-leading 18% next year (Chart 1).
On the external side, export diversification has assisted B.C. navigate through the current period of tariff uncertainty, with exports holding up better than more trade-exposed provinces. Continued resilience across services industries has helped to counterbalance weakness in the lumber industry, with the latter hit by the recent imposition of 35% countervailing/anti-dumping duties by the U.S.
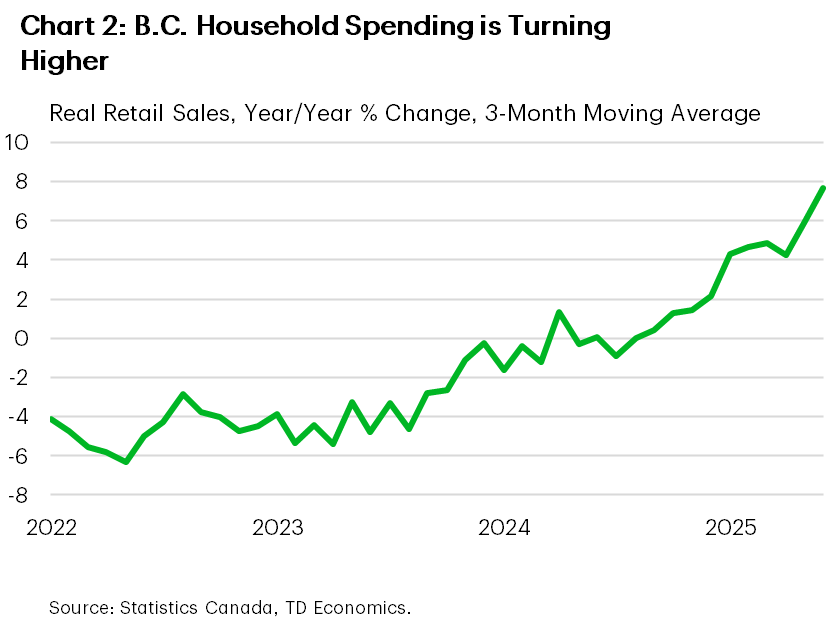
B.C.’s highly-indebted households have shown their mettle in recent months, benefitting from past interest rate cuts and steady real wage gains. After tightening their purse strings in 2024, B.C. consumers are now ranked second among their provincial counterparts in year-to-date (YTD) inflation-adjusted retail spending (Chart 2). Other indicators, like food and beverage spending, are also holding firm as residents redirect tourism dollars within B.C. borders. Looking forward, consumer spending will likely gear down, especially as population growth cools faster than in other provinces. A likely silver lining of both slower headcount and labour force growth is that it should mitigate upward pressure on the jobless rate. On that count, we expect B.C’s unemployment rate to reach a cyclical peak of 6.5% by the turn of year before drifting lower in 2026.
Alberta
Alberta Economic Forecasts
[ Annual average % change, unless otherwise noted ]
| Economic Indicators | 2025F | 2026F | 2027F |
| Real GDP | 2.0 | 1.6 | 2.1 |
| Nominal GDP | 3.7 | 3.6 | 4.2 |
| Employment | 2.1 | 0.7 | 1.1 |
| Unemployment Rate (%) | 7.4 | 7.0 | 6.3 |
| Housing Starts (000's) | 56.5 | 54.1 | 43.0 |
| Existing Home Prices | 3.5 | 3.6 | 4.3 |
| Home Sales | -5.6 | 9.5 | 7.0 |
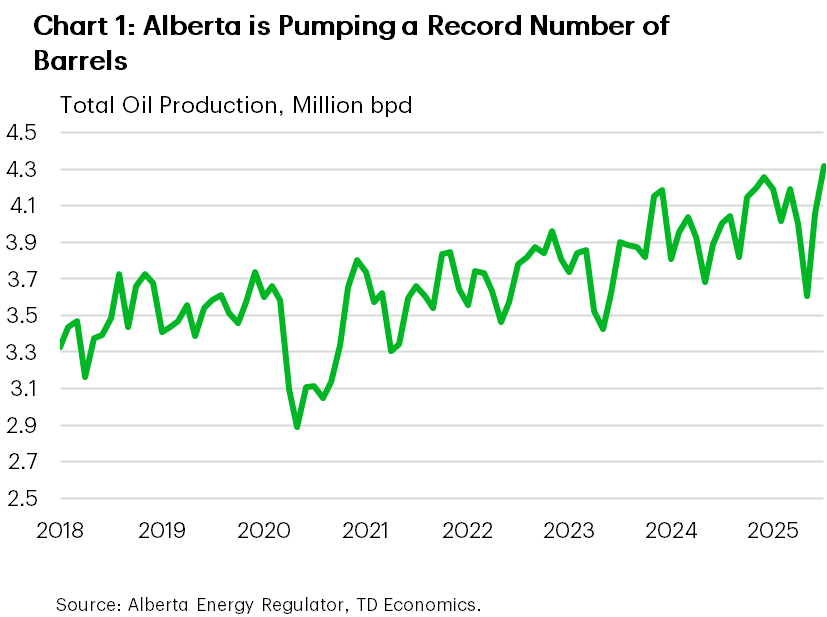
We expect Alberta’s real GDP growth to remain at the upper end of the provincial growth leaderboard in 2025 before taking a bit of a step back next year. The energy sector has maintained sturdy momentum, helping crude oil production push to a new record high (Chart 1). What’s more, the Trans Mountain Pipeline Expansion (TMX) is slowly rerouting flows away from recent growth markets like the U.S. west coast toward China, now Canada’s second-largest crude export market.
Thanks to lower breakeven prices and spare capacity via TMX, Alberta’s oil patch can sustain current production levels. That said, a softer pricing environment, a relatively firm Canadian dollar, and ongoing trade uncertainty may cap the upside to growth in the energy sector next year, especially as capital investment shows some signs of slowing. Oil prices are now tracking a few dollars below the government’s early year budget forecast, though narrower light-heavy differentials are providing some buffer. Oil and gas sector prospects would brighten should a new pipeline be expedited as part of the federal government’s nation-building agenda. However, a major obstacle remains securing a private-sector proponent to back the project.
Robust gains in energy sector activity are helping to offset some of the trade-related headwinds. Notably, both the manufacturing and wholesale trade sectors are on track to record a contraction this year, with only a modest recovery expected in 2026. Even after accounting for U.S. export volatility due to tariff front-running, Alberta’s non-energy shipments to the U.S. have fallen to 2022 levels.
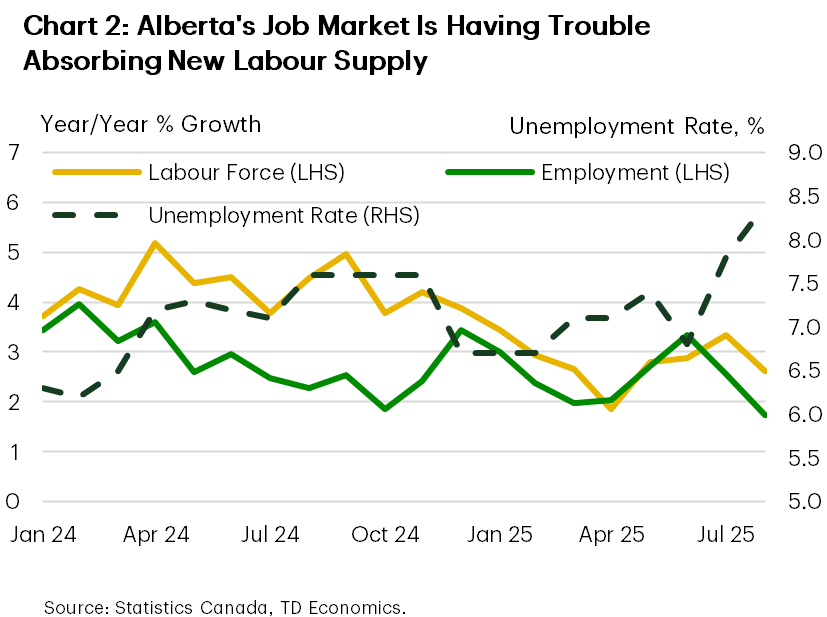
Job creation in Alberta is still expanding at a healthy pace with broad-based gains across both goods and services industries. However, the unemployment rate has popped to an 8-year high (excluding the pandemic) as hiring is being outstripped by continued rapid increases in both population and additions to the labour force (Chart 2). As such, the unemployment rate will likely hang up a bit higher over the next few quarters than we had anticipated in June before pulling back next year.
Indeed, population growth in Alberta has turned a corner, but is decelerating at a slower pace than the rest of the nation. For now, inflows of both international and inter-provincial migrants continue to support robust consumer spending and housing demand. In fact, housing starts are on pace to hit record levels in 2025, buttressing activity in residential construction. This is reflected in our Alberta home sales forecast that sees growth of nearly 10% next year.
Saskatchewan
Saskatchewan Economic Forecasts
[ Annual average % change, unless otherwise noted ]
| Economic Indicators | 2025F | 2026F | 2027F |
| Real GDP | 1.7 | 1.5 | 1.7 |
| Nominal GDP | 4.2 | 3.1 | 3.8 |
| Employment | 2.4 | 0.4 | 0.6 |
| Unemployment Rate (%) | 4.9 | 5.1 | 5.1 |
| Housing Starts (000's) | 5.7 | 5.3 | 5.0 |
| Existing Home Prices | 9.3 | 6.5 | 5.1 |
| Home Sales | 0.7 | 7.2 | 6.3 |
Saskatchewan’s economy is set to outperform the nation as a whole in 2025 as momentum in the province’s construction, resources, and public services sectors remains strong. Trade rifts have begun to weigh on some other goods-related industries, but the economy is better positioned to handle these headwinds due to its minimized exposure overall to U.S. tariffed industries.
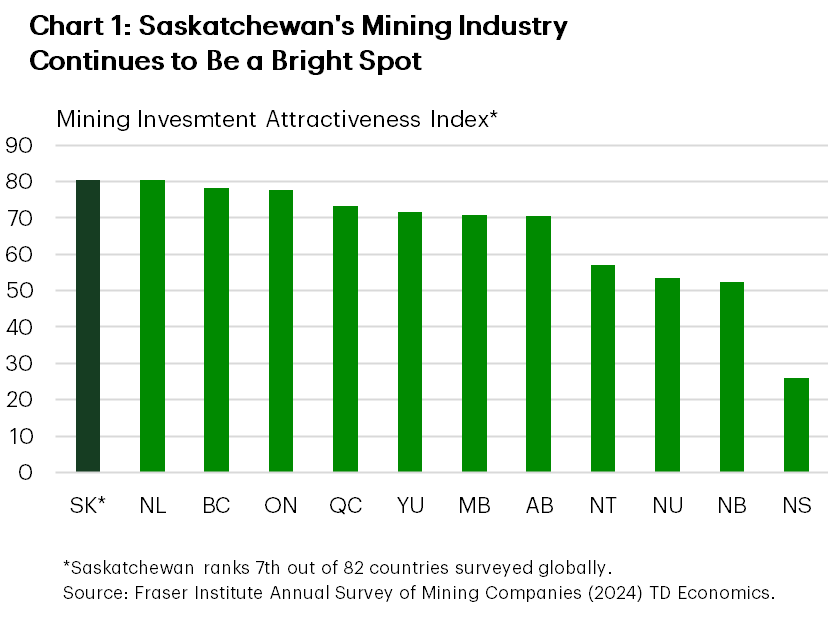
Mining shipments, led by potash and uranium, are up around 20% year-to-date (YTD) as demand from global trading partners holds firm. Exports for these commodities have also been helped by steadily rising prices over the year. The sector is an early beneficiary of the federal government’s nation-building projects plan, with the McIlvenna Bay Foran Copper Mine being included in the first wave of fast-tracked projects. Led by ongoing work on the Jansen potash mega project, we expect private non-residential investment to continue to add a mild tailwind to Saskatchewan’s growth over the near-term. Saskatchewan recently ranked first in Canada as a top destination for mining investment (Chart 1).
We are more cautious about growth in the agricultural sector as it faces fresh risks from China’s recently imposed 75.8% duty on Canadian canola seed—building on the 100% tariff on canola oil and meal levied in March. This jeopardizes nearly $5 billion in annual canola takeaway to China, the province’s second largest export market. Canola production in 2025 is still on pace for modest growth but a reduction in wheat yields are offsetting some of the gain. Meanwhile, oil production is flatlining this year, though the provincial launch of the new Low Productivity and Reactivation Well Program may help to buoy volumes into 2026.
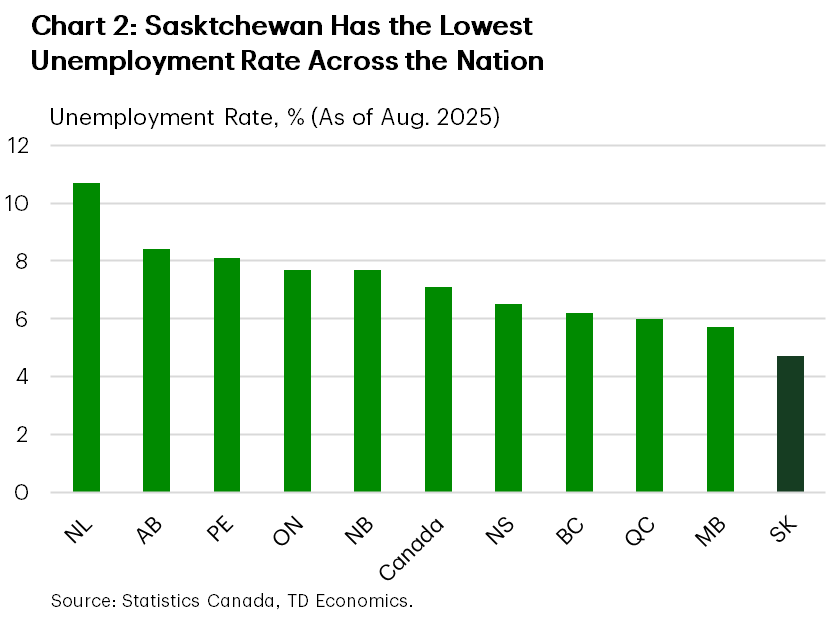
Saskatchewan’s labour market has been a bright spot for several quarters and currently boasts the lowest unemployment rate across all provinces (Chart 2). Real wage gains have pushed inflation-adjusted retail spending growth ahead of most provinces, while affordability advantages have fueled sturdy gains in the home resale market. The public sector has driven the bulk of recent labour market strength, but this momentum could fade in 2026 on the back of the provincial government’s relatively restrained spending plans. Despite this, we expect the labour market will retain its position as one of the healthiest in the country.
Manitoba
Manitoba Economic Forecasts
[ Annual average % change, unless otherwise noted ]
| Economic Indicators | 2025F | 2026F | 2027F |
| Real GDP | 1.0 | 1.2 | 1.9 |
| Nominal GDP | 3.3 | 3.2 | 3.9 |
| Employment | 1.4 | 0.3 | 0.9 |
| Unemployment Rate (%) | 5.8 | 5.6 | 5.2 |
| Housing Starts (000's) | 7.0 | 6.3 | 6.3 |
| Existing Home Prices | 7.0 | 5.3 | 4.3 |
| Home Sales | 2.7 | 4.5 | 3.3 |
Our 2025 real GDP growth forecast for Manitoba is essentially unchanged from last round. We continue to see a lacklustre performance for the province this year, as a tug of war takes place between resilience some service industries and softness in the export sector.
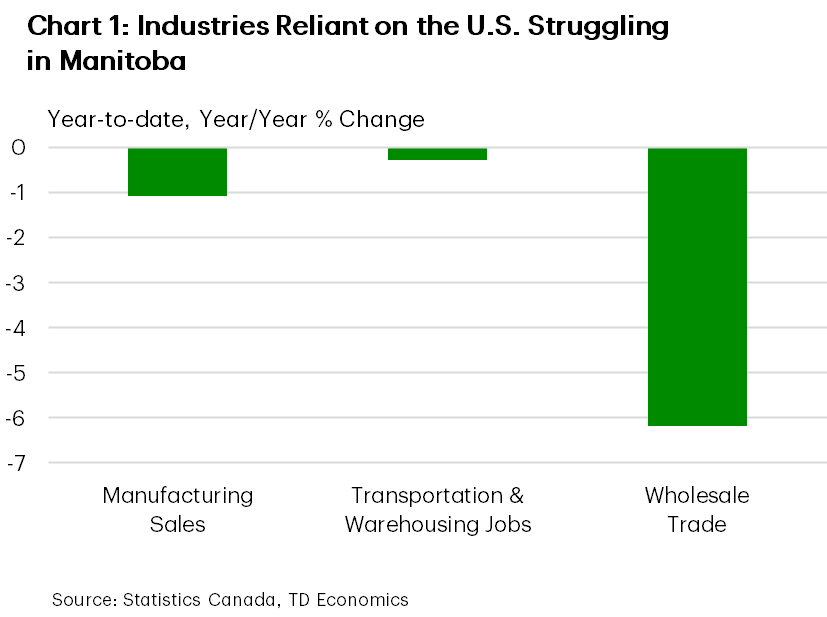
Indeed, industries that are in the crosshairs of the Canada-U.S. trade war are struggling (Chart 1). Manufacturing sales have fallen year-to-date, while wholesale activity has plunged 6% and hiring in the transportation/warehousing industry is down. The mining sector, meanwhile, has faced some temporary disruption from wildfires, and Manitoba’s economy has seemingly been the most impacted during this wildfire season. Sectors levered to international trade will also feel the pain from China’s newly imposed 76% tariff on exports of canola seed. However, with canola products only accounting for about 2% of international goods shipments, the overall economy is shielded. Looking to 2026, we think prospects are modestly better for these industries, helped by an improvement in U.S. economic conditions (although U.S.-Canada trade negotiations are a notable risk here), and domestic trading partners. Interprovincial trade is especially important for Manitoba, and the province has encouragingly passed legislation aimed to boost this channel.
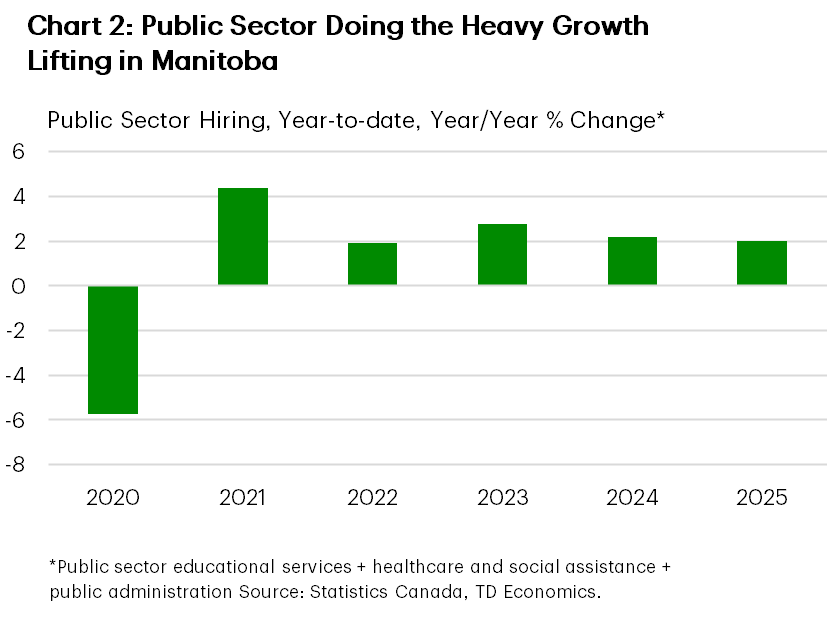
Manitoba’s public sector looks to be doing the heavy lifting for growth this year and could contribute more than half of the province’s 2025 GDP growth (Chart 2). However, this momentum could fade in 2026, if the provincial government slows program spending growth as budgeted. 2025 will also see a healthy boost from the utilities sector, where production is normalizing after a soft 2023/24 performance. Further, residential construction spending is growing at a healthy pace this year, while engineering investment will get a medium-term shot-in-the arm from robust provincial infrastructure spending and the federal government’s plan to back new investments at the Port of Churchill.
Consumers continue to spend at a healthy clip in Manitoba, with inflation-adjusted retail sales up 5% year-to-date. Support has come from firmer-than-anticipated job gains, solid wage growth and sturdy housing markets. Amid an improving jobs market, consumption could hold up well again next year (even with the headwind of slowing population growth) and be another factor driving an acceleration in overall economic growth in 2026.
Ontario
Ontario Economic Forecasts
[ Annual average % change, unless otherwise noted ]
| Economic Indicators | 2025F | 2026F | 2027F |
| Real GDP | 1.0 | 0.9 | 1.8 |
| Nominal GDP | 3.4 | 3.2 | 3.8 |
| Employment | 0.7 | 0.0 | 1.0 |
| Unemployment Rate (%) | 7.8 | 7.6 | 6.8 |
| Housing Starts (000's) | 63.9 | 63.1 | 79.2 |
| Existing Home Prices | -3.0 | 3.1 | 4.4 |
| Home Sales | -4.0 | 15.2 | 8.4 |
We’re no longer forecasting two consecutive quarters of contraction for Ontario’s economy (i.e. a technical recession). Still, the projected 1.0% growth rate for GDP in 2025 would be Ontario’s weakest (non-pandemic) performance since the Global Financial Crisis. The province is struggling with significant trade uncertainty, which we think will restrain business investment moving forward.
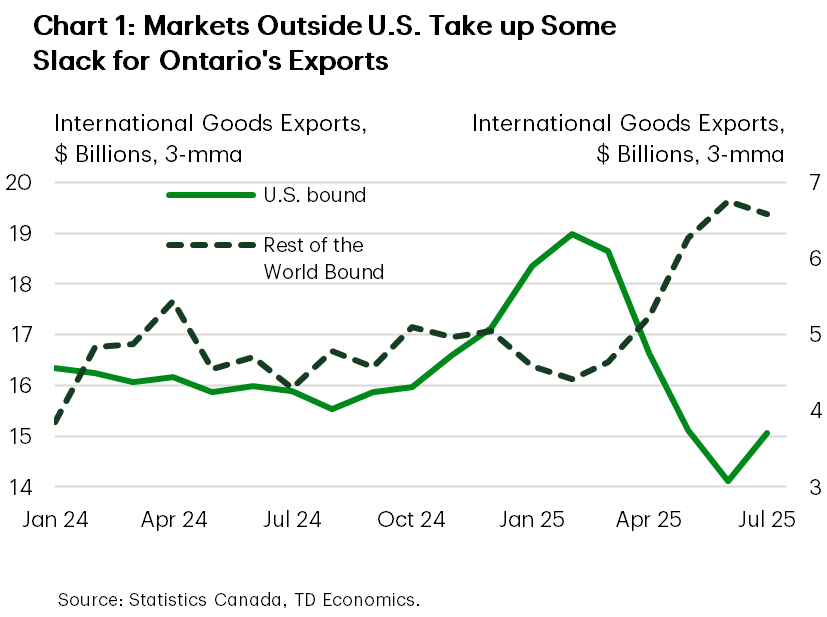
Still, after a sharp Q2 decline, real GDP is now likely to eke out some mild growth in Q3, as net trade probably won’t subtract as much from growth as previously anticipated. Exports to the U.S. have stabilized (albeit at low levels), while shipments to other countries have taken up some of the slack (Chart 1). For 2025 overall, output in Ontario’s export-oriented manufacturing sector is likely to contract sharply, walloped by tariffs, most prominently on vehicles and steel. We’re projecting a mild gain for the sector in 2026, supported by some improvement in the external backdrop, although the upcoming CUSMA negotiations loom large. Another boost to the factory sector, even if only modest, could come from Ontario’s relatively aggressive push to remove interprovincial trade barriers. In the auto sector, GM’s plan to delay its production cut by a few months won’t have a material impact, although Stellantis’ announcement of a new production line in 2026 should support output.
Households likely spent at a solid pace in the first half, potentially bolstered by the removal of the carbon tax. However, we question the durability of this trend. Population growth is slowing sharply, and job markets have been soft (weighed down by education sector job losses). What’s more, an important share of Ontario’s highly indebted households will renew their mortgages at sharply higher interest rates through the end of next year.
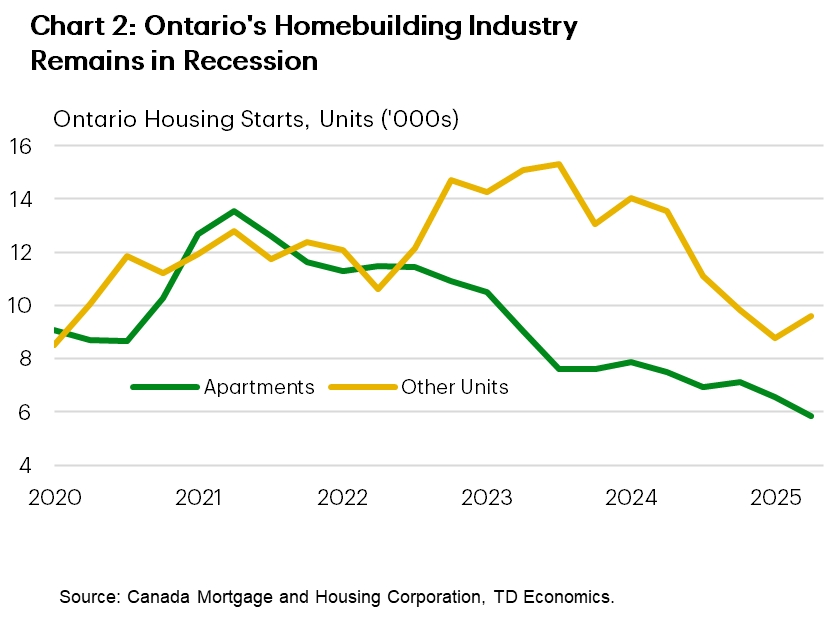
Ontario’s homebuilding industry remains in recession (Chart 2). Starts are trending at their lowest levels since 2015. Condo construction continues to be weak. However, some signs of improvement have emerged. Sales of existing homes have surged about 25% from their March low. Previously sidelined demand has returned, supported by ample choice and falling prices. Even the beleaguered GTA condo market has seen resale activity rise 30% since March, although levels are low, and supply remains highly elevated. Moving forward, housing demand is likely to continue to recover, ultimately boosting homebuilding.
Québec
Quebec Economic Forecasts
[ Annual average % change, unless otherwise noted ]
| Economic Indicators | 2025F | 2026F | 2027F |
| Real GDP | 0.9 | 1.0 | 1.6 |
| Nominal GDP | 3.5 | 3.5 | 3.6 |
| Employment | 1.5 | 0.0 | 0.7 |
| Unemployment Rate (%) | 6.0 | 6.2 | 5.6 |
| Housing Starts (000's) | 60.3 | 56.5 | 51.9 |
| Existing Home Prices | 8.3 | 5.9 | 4.3 |
| Home Sales | 9.2 | 2.6 | 0.8 |
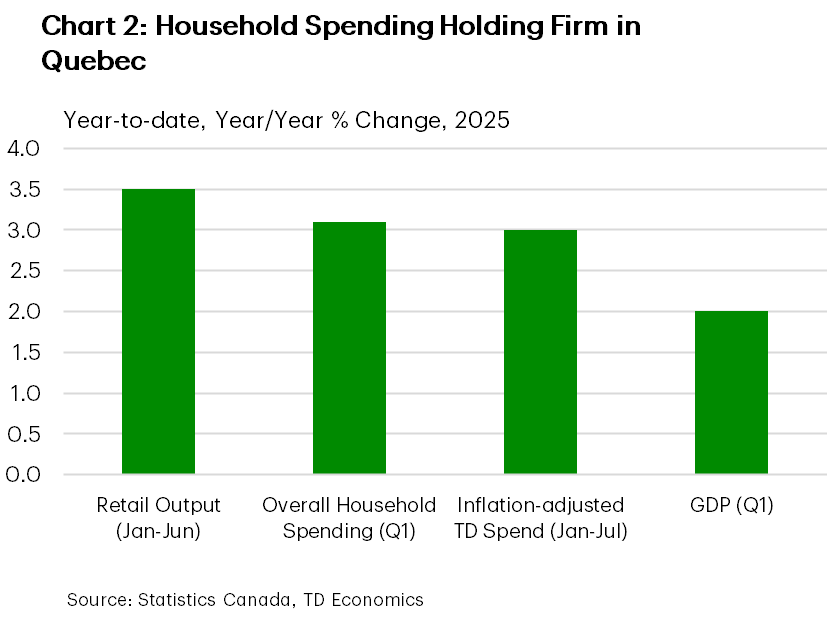
We’ve upgraded our 2025 growth forecast for Quebec considerably. Although we haven’t changed our view much on Quebec’s Q2 performance, first quarter economic growth was much stronger-than-anticipated. Residential construction activity has been firm, boosted by rental construction. However, much of the resilience in overall GDP growth has come through public sector industries, where output was up 2% year-on-year in May on the back of solid gains in educational and healthcare services. Next year could see a softer outcome for this sector, flagged by a budgeted cooling in provincial program spending growth and, potentially, federal operating spending constraints.
As expected, the consumer in Quebec has also held up relatively well (Chart 1). Positive real wage growth has supported consumption. Population growth has also not slowed as sharply as elsewhere in the country, offering a relative lift to aggregate consumption. What’s more, Quebec’s housing market has been firmer than most other regions this year (boosting housing-related consumption). Looking ahead, some easing in job growth is anticipated, which should restrain spending in the near-term. However, the labour market is likely to improve in 2026, as household debt levels remain relatively low in Quebec, and savings rates are elevated (offering a financial cushion for households). With these tailwinds, we anticipate a decent pace for household spending next year. In housing markets, tight supply/demand balances should ensure another year of solid price growth, following up the very strong 8% gain likely to be achieved in 2025.
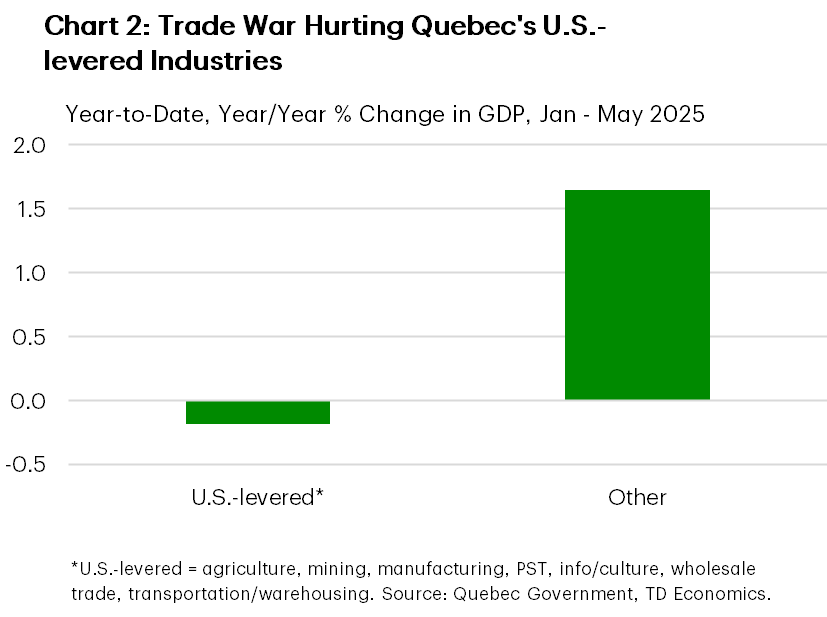
Hiring has been stagnant in industries that are relatively reliant on the U.S., such as manufacturing, wholesaleing and transportation. This mirrors the trend in GDP, where output in these industries has contracted so far this year (Chart 2). Indeed, it’s the weakness in these sectors (alongside lethargic non-residential investment spending) that should keep Quebec’s growth sub-par in 2025.
This result is unsurprising given Quebec’s significant reliance on the U.S. market and the 50% tariff placed on aluminum exports by the U.S. The 2026 outlook for these industries is tentatively better, as U.S. economic growth is likely to be decent and activity in Quebec should pick up. Forthcoming CUSMA negotiations are a wildcard, however.
New Brunswick
New Brunswick Economic Forecasts
[ Annual average % change, unless otherwise noted ]
| Economic Indicators | 2025F | 2026F | 2027F |
| Real GDP | 1.0 | 1.0 | 1.1 |
| Nominal GDP | 3.2 | 3.1 | 3.1 |
| Employment | 0.7 | -0.3 | 0.5 |
| Unemployment Rate (%) | 7.3 | 7.6 | 7.5 |
| Housing Starts (000's) | 7.2 | 6.7 | 4.5 |
| Existing Home Prices | 6.7 | 5.5 | 4.2 |
| Home Sales | 1.7 | 6.3 | 2.4 |
We’ve nudged up N.B.’s real GDP growth forecast for both 2025 and 2026, but to a pace that remains subdued and below its regional peers. Sectors most exposed to external trade, namely manufacturing, transportation, and wholesale sales, will remain challenged by tariffs and weakening U.S. demand. At the same time, we see a number of domestically oriented industries taking up some of the slack.
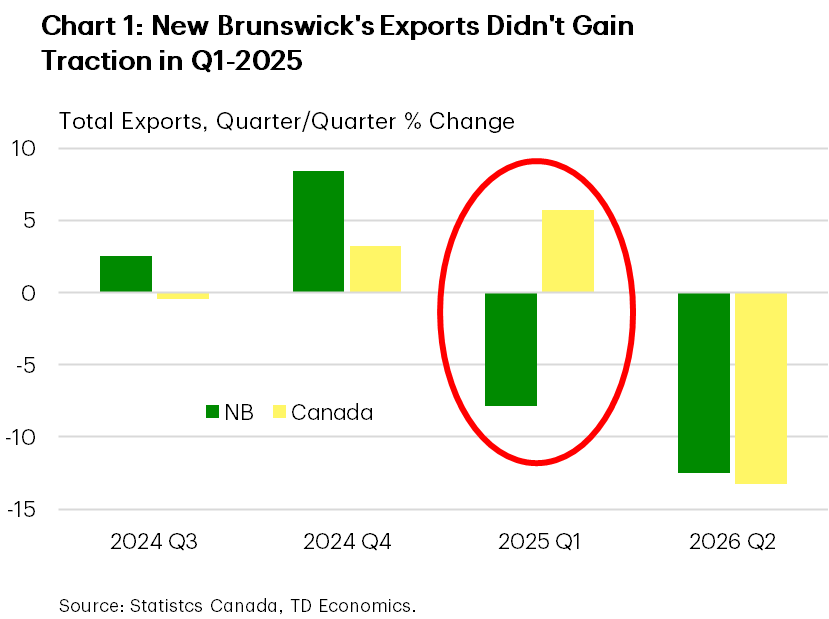
N.B.’s economy is arguably the most vulnerable within Canada to U.S. tariffs and related uncertainty. Indeed, exports to the U.S. as a share of the domestic economy rank the highest across jurisdictions. Exports in the province are coming off back-to-back contractions in Q1 and Q2, counter to most jurisdictions which saw robust export activity in the first quarter of the year (Chart 1). What’s more, N.B.’s recent manufacturing sector performance is also diverging from a Canadian-wide trend that has shown tentative signs of recovery.
It’s not all bad news, as manufacturing employment has managed to show surprising resilience in 2025, while the economy has been generating net job gains across a number of industries, notably in health care and public administration. This, combined with a slowdown in labour force growth, has helped keep the rise in the jobless rate at bay. Our forecast for a peak unemployment rate of around 7.8% by the end of the year would still be below pre-pandemic average levels.
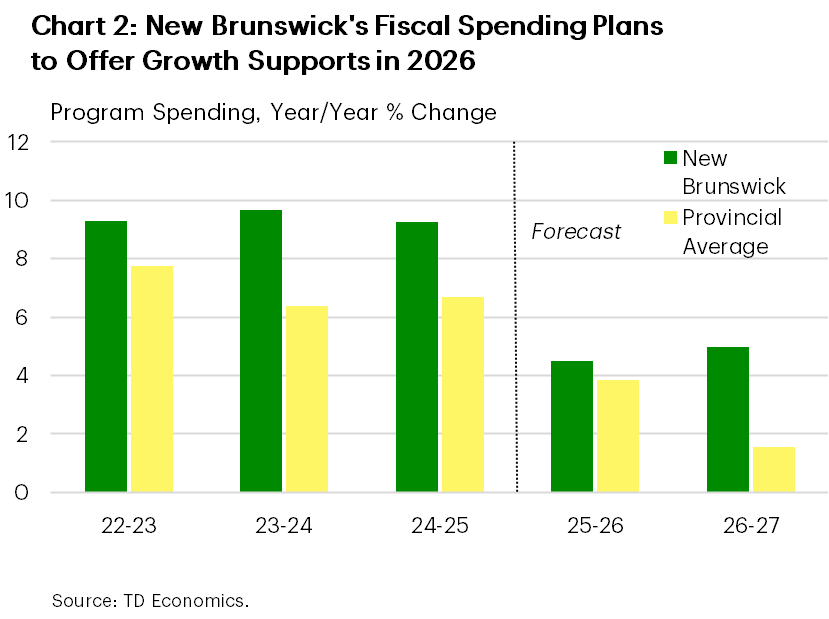
For their part, households are showing their mettle despite the ongoing cloud of trade and job market uncertainty. Retail spending growth has been running in the middle of the provincial pack so far this year, helped in part by the relatively low average debt level of consumers. We do expect some of this spending momentum to wane next year as population growth continues to decelerate. Outside of retail trade, the broader services sector stands to benefit from the province’s planned 5% growth in program spending. This is significantly higher than most provinces who are opting for more fiscal restraint.
Other areas providing some positive growth offsets are the construction and utilities sectors. The former is getting a boost from robust housing demand, which has prompted us to raise our home price forecast and has kept residential construction elevated in recent months. Non-residential investment is also benefitting from government capital spending on transportation infrastructure and health care facilities. Meanwhile, utilities growth is on pace for double-digit growth after a particularly weak 2024.
Nova Scotia
Nova Scotia Economic Forecasts
[ Annual average % change, unless otherwise noted ]
| Economic Indicators | 2025F | 2026F | 2027F |
| Real GDP | 1.3 | 1.4 | 1.2 |
| Nominal GDP | 3.6 | 3.6 | 3.2 |
| Employment | 0.3 | -0.2 | 0.4 |
| Unemployment Rate (%) | 6.7 | 7.0 | 6.8 |
| Housing Starts (000's) | 10.3 | 7.7 | 6.6 |
| Existing Home Prices | 5.0 | 5.3 | 3.6 |
| Home Sales | 0.7 | 9.1 | 5.9 |
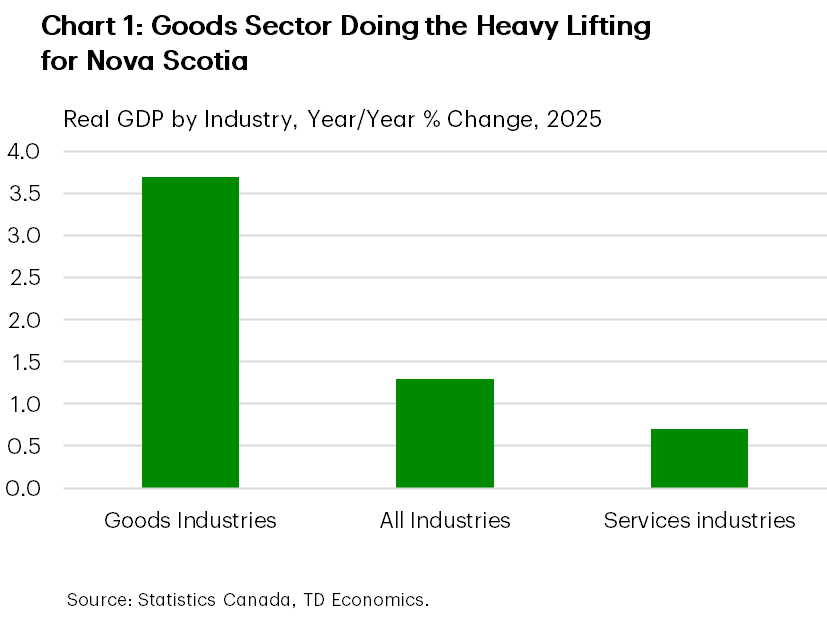
This year, we expect Nova Scotia’s economy to advance at its softest pace since 2015 (outside of the pandemic). Nova Scotia’s outsized services industry is the at the heart of this slowdown, whereas goods-producing industries should make a robust contribution to GDP (Chart 1). Within services, we’re tracking a cooler performance in the large finance and insurance sector. A turnaround for this industry is likely next year, supported by housing activity. Both population and labour force gains have also slowed considerably, weighing on GDP growth, but have helped to limit the rise in the unemployment rate to 6.5% as of August (roughly in line with it’s year-ago level).
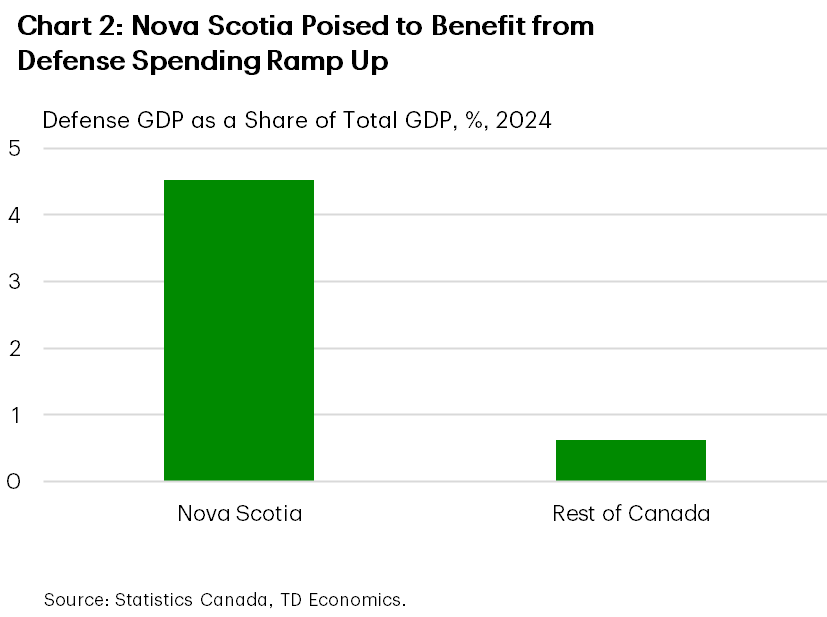
In Nova Scotia’s outsized public sector, subdued hiring portends some moderation this year. Note that the province’s latest budget projected cooler spending growth this fiscal year and next. However, the outlook is brightened by the federal government’s hefty defense spending plan (Chart 2). Indeed, the province is home to the largest military base in Canada (by posted personnel). It also has a robust military support industry.
The goods sector is enjoying a solid 2025 performance, despite 25% tariffs placed on seafood exports by China. Activity has been keyed by a surprisingly resilient manufacturing sector. Indeed, manufacturing sales were up 5% year-to-date, supported by tire manufacturing. Notably, this sector was able to retain its momentum in the second quarter, but sales declined in July. Some cooling in activity could be in store for the 2nd half as the U.S. economy moderates. Next year, we envision moderate growth for the sector, consistent with fortunes for domestic trading partners and continued U.S. economic growth. Nova Scotia has been one of the most aggressive provinces in removing interprovincial trade barriers, which should offer some support to this industry moving forward.
Construction activity has also been robust, both residential (owing to massive gains in rental construction), and non-residential (on the back of large-scale hospital construction). Over the medium term, investment spending could be jolted by the $60 billion “Wind West” megaproject which would involve the construction of offshore wind turbines and transmission lines. The provincial government has suggested that the up-and-running project could supply nearly 30% of Canada’s energy needs.
Prince Edward Island
P.E.I. Economic Forecasts
[ Annual average % change, unless otherwise noted ]
| Economic Indicators | 2025F | 2026F | 2027F |
| Real GDP | 2.2 | 1.4 | 1.6 |
| Nominal GDP | 4.1 | 3.8 | 3.6 |
| Employment | 0.7 | 0.5 | 0.9 |
| Unemployment Rate (%) | 8.1 | 8.3 | 8.0 |
| Housing Starts (000's) | 1.7 | 1.2 | 1.3 |
| Existing Home Prices | 3.0 | 5.4 | 3.5 |
| Home Sales | 6.6 | 4.2 | 2.3 |
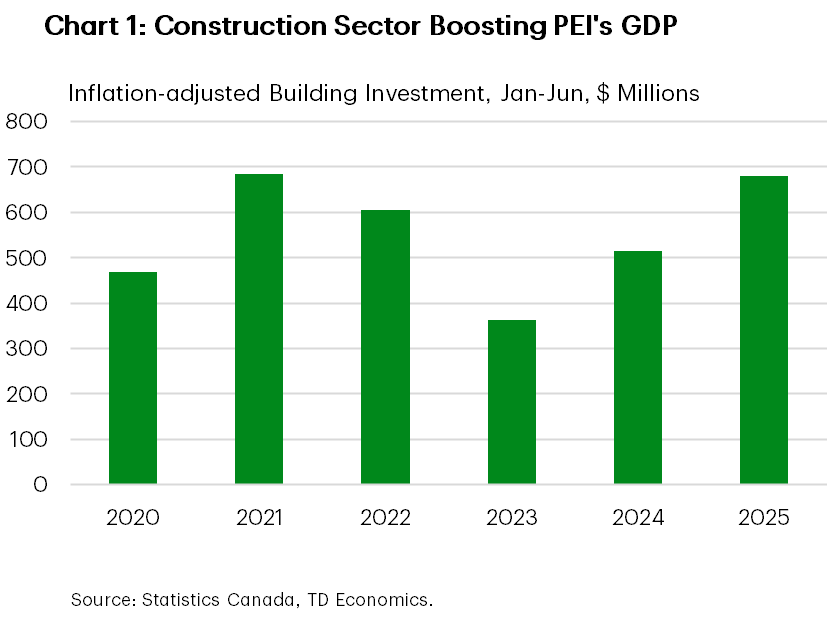
PEI is likely to post one of the strongest growth rates among the provinces this year. The construction industry is leading the way in terms of a growth contribution, with both residential and non-residential spending recording massive year-to-date gains (Chart 1). PEI’s rental construction remains robust, supported by past population growth, elevated rents, and government support programs. Meanwhile, government infrastructure spending is boosting non-residential investment. Elsewhere, solid housing market activity coupled with strong hiring points to a healthy output gain in the finance, insurance and real estate industry. The public sector is also making an important contribution to 2025’s robust performance, consistent with provincial program spending plans outlined in the latest budget.
PEI’s manufacturing sector is a standout. Despite the turbulence of the Canada-U.S. trade war, manufacturing sales have managed to climb 10% y/y so far in 2025. Slower U.S. economic growth could take some of the wind out of the manufacturing industry in the near-term, but we are likely to see continued growth in 2026, supported by improving external demand. The provincial government has also reduced its interprovincial trade barriers, which could lift the industry moving forward.
PEI’s tourism industry is also enjoying a solid year, with overnight stays up 5% year-to-date through June. Notably, U.S. visitors largely shied away from the Island earlier in the year but have made up an increasing share of the total since.
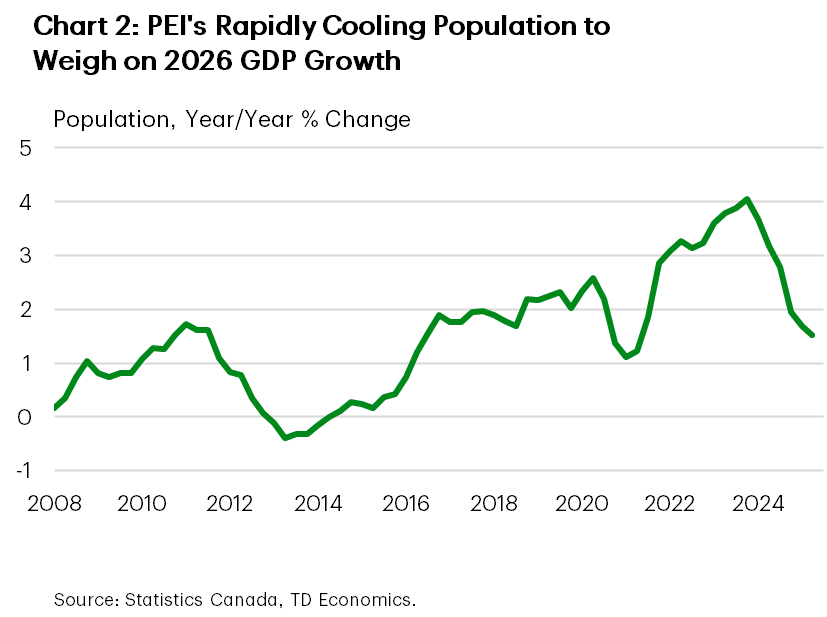
Despite another year of what should be healthy economic growth, the Island has posted middling job gains so far. However, this likely has more to do with supply than demand. Population has slowed markedly, limiting the available pool or labour while also restraining household spending growth to only a “so-so” pace. With population growth likely to remain restrained through 2026, we see economic growth cooling significantly next year. Slower government spending is also assumed to weigh on GDP growth next year, in line with the provincial budget plans. Activity in PEI’s outsized public sector could cool even further than what’s implied by the provincial budget, depending on the scale of potential federal operating spending restraint.
Newfoundland & Labrador
NFLD & Labrador Economic Forecasts
[ Annual average % change, unless otherwise noted ]
| Economic Indicators | 2025F | 2026F | 2027F |
| Real GDP | 3.3 | 1.4 | 0.9 |
| Nominal GDP | 5.0 | 3.6 | 3.1 |
| Employment | -0.3 | -0.6 | 0.3 |
| Unemployment Rate (%) | 10.5 | 11.1 | 11.2 |
| Housing Starts (000's) | 1.6 | 1.5 | 1.5 |
| Existing Home Prices | 7.6 | 3.6 | 3.0 |
| Home Sales | 6.7 | 3.9 | 3.3 |
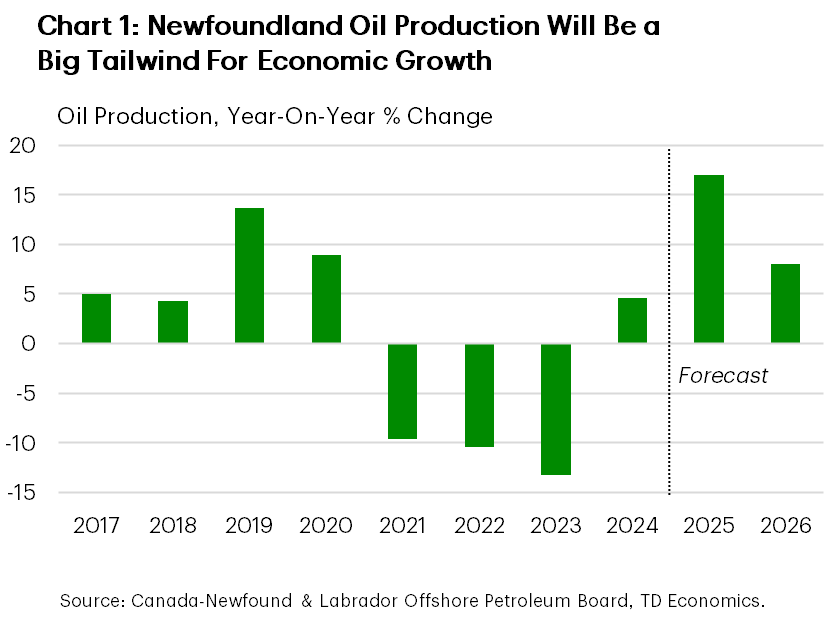
We’ve upgraded our already-bullish forecast for N.L.’s 2025 real GDP growth. While not immune to tariff-related headwinds, the economy has been benefitting from strength in its primary sectors. The energy sector has been leading the way, contributing to over half of this year’s estimated growth. All oilfields are in operation for the first time since late-2023, which has helped push year-to-date (YTD) production volumes nearly 20% higher (Chart 1). N.L.’s ability to export to non-U.S. markets well-positions the province to minimize tariff impacts. Indeed, over 50% of energy shipments now head to Europe. Looking to 2026, we expect the rate of GDP growth to pull-back towards a more sustainable level as oil output growth moderates.
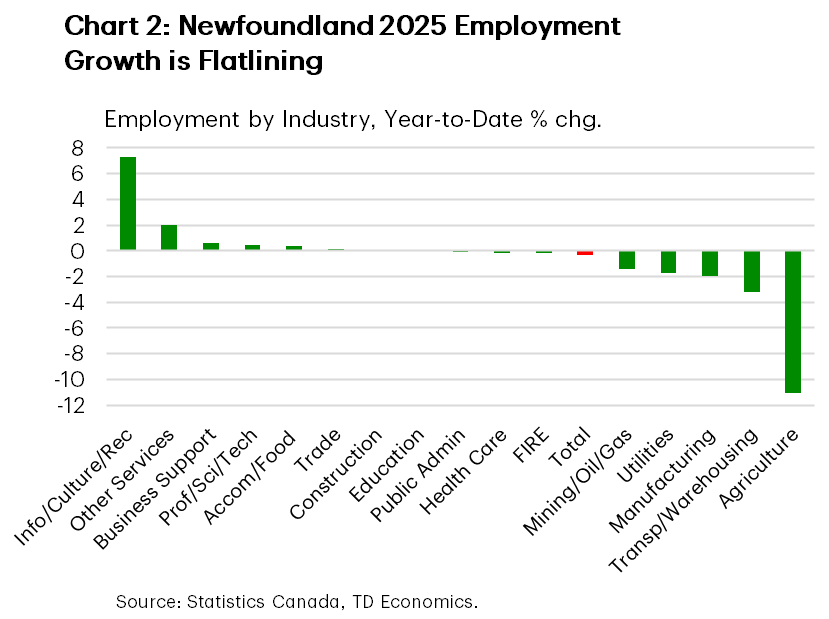
N.L. households managed to top the provincial charts in terms of real retail spending gains in the first half of the year. What’s more, our internal credit card spending data shows that monthly spending in the province jumped in both July and August. Spending gains will likely let up next year in lagged response to the slowdown in the job market. Net hiring so far this year has slowed to a standstill, with outsized job losses in the transportation, manufacturing and forestry industries being offset by gains in the information/cultural and other services sectors. A decelerating pace of employment gains is expected push the jobless rate to around 11% in 2026, though this is still roughly 1 percentage point lower than its 2019 level.
Elsewhere, rising nickel and copper production is expected to underpin growth in the mining sector. While smaller in the overall equation, the province’s gold industry will continue to ride on the coattails of stratospheric bullion prices. This bolsters the case for a potential expansion of the Valentine Gold Mine, whose recent production is advancing at a faster than expected rate.
The construction sector has been a weak spot this year. Despite some recent momentum, housing starts are on pace for a contraction this year, pressuring real residential investment lower. Non-residential investment has also been pulling back, though we’re anticipating a modest bounce back next year. Longer-term prospects for N&L’s economy would brighten should two major projects, a proposed offshore oilfield and a hydroelectricity deal with Quebec, eventually land on Canada’s nation-building projects list. There is reason to be optimistic as these projects would fall under the Eastern Energy Partnership.
Forecast Table
Provincial Economic Forecasts
| Provinces | Real GDP (% Chg.) |
Nominal GDP (% Chg.) |
Employment (% Chg.) |
Unemployment Rate (Average, %) |
Housing Starts (Thousands) |
Home Prices (% Chg.) |
||||||||||||
| 2025F | 2026F | 2027F | 2025F | 2026F | 2027F | 2025F | 2026F | 2027F | 2025F | 2026F | 2027F | 2025F | 2026F | 2027F | 2025F | 2026F | 2027F | |
| National | 1.2 | 1.1 | 1.7 | 3.6 | 3.4 | 3.9 | 1.1 | 0.1 | 0.9 | 7.0 | 6.9 | 6.3 | 262.5 | 254.4 | 246.9 | -0.7 | 5.4 | 4.9 |
| Newfoundland & Labrador | 3.3 | 1.4 | 0.9 | 5.0 | 3.6 | 3.1 | -0.3 | -0.6 | 0.3 | 10.5 | 11.1 | 11.2 | 1.6 | 1.5 | 1.5 | 7.6 | 3.6 | 3.0 |
| Prince Edward Island | 2.2 | 1.4 | 1.6 | 4.1 | 3.8 | 3.6 | 0.7 | 0.5 | 0.9 | 8.1 | 8.3 | 8.0 | 1.7 | 1.2 | 1.3 | 3.0 | 5.4 | 3.5 |
| Nova Scotia | 1.3 | 1.4 | 1.2 | 3.6 | 3.6 | 3.2 | 0.3 | -0.2 | 0.4 | 6.7 | 7.0 | 6.8 | 10.3 | 7.7 | 6.6 | 5.0 | 5.3 | 3.6 |
| New Brunswick | 1.0 | 1.0 | 1.1 | 3.2 | 3.1 | 3.1 | 0.7 | -0.3 | 0.5 | 7.3 | 7.6 | 7.5 | 7.2 | 6.7 | 4.5 | 6.7 | 5.5 | 4.2 |
| Québec | 0.9 | 1.0 | 1.6 | 3.5 | 3.5 | 3.6 | 1.5 | 0.0 | 0.7 | 6.0 | 6.2 | 5.6 | 60.3 | 56.5 | 51.9 | 8.3 | 5.9 | 4.3 |
| Ontario | 1.0 | 0.9 | 1.8 | 3.4 | 3.2 | 3.8 | 0.7 | 0.0 | 1.0 | 7.8 | 7.6 | 6.8 | 63.9 | 63.1 | 79.2 | -3.0 | 3.1 | 4.4 |
| Manitoba | 1.0 | 1.2 | 1.9 | 3.3 | 3.2 | 3.9 | 1.4 | 0.3 | 0.9 | 5.8 | 5.6 | 5.2 | 7.0 | 6.3 | 6.3 | 7.0 | 5.3 | 4.3 |
| Saskatchewan | 1.7 | 1.5 | 1.7 | 4.2 | 3.1 | 3.8 | 2.4 | 0.4 | 0.6 | 4.9 | 5.1 | 5.1 | 5.7 | 5.3 | 5.0 | 9.3 | 6.5 | 5.1 |
| Alberta | 2.0 | 1.6 | 2.1 | 3.7 | 3.6 | 4.2 | 2.1 | 0.7 | 1.1 | 7.4 | 7.0 | 6.3 | 56.5 | 54.1 | 43.0 | 3.5 | 3.6 | 4.3 |
| British Columbia | 1.6 | 1.3 | 1.7 | 3.8 | 3.7 | 3.9 | 1.0 | -0.1 | 0.9 | 6.2 | 6.2 | 5.6 | 48.3 | 52.0 | 47.6 | -3.1 | 3.5 | 3.6 |
For any media enquiries please contact Oriana Kobelak at 416-982-8061
Disclaimer
This report is provided by TD Economics. It is for informational and educational purposes only as of the date of writing, and may not be appropriate for other purposes. The views and opinions expressed may change at any time based on market or other conditions and may not come to pass. This material is not intended to be relied upon as investment advice or recommendations, does not constitute a solicitation to buy or sell securities and should not be considered specific legal, investment or tax advice. The report does not provide material information about the business and affairs of TD Bank Group and the members of TD Economics are not spokespersons for TD Bank Group with respect to its business and affairs. The information contained in this report has been drawn from sources believed to be reliable, but is not guaranteed to be accurate or complete. This report contains economic analysis and views, including about future economic and financial markets performance. These are based on certain assumptions and other factors, and are subject to inherent risks and uncertainties. The actual outcome may be materially different. The Toronto-Dominion Bank and its affiliates and related entities that comprise the TD Bank Group are not liable for any errors or omissions in the information, analysis or views contained in this report, or for any loss or damage suffered.
Download
Share: