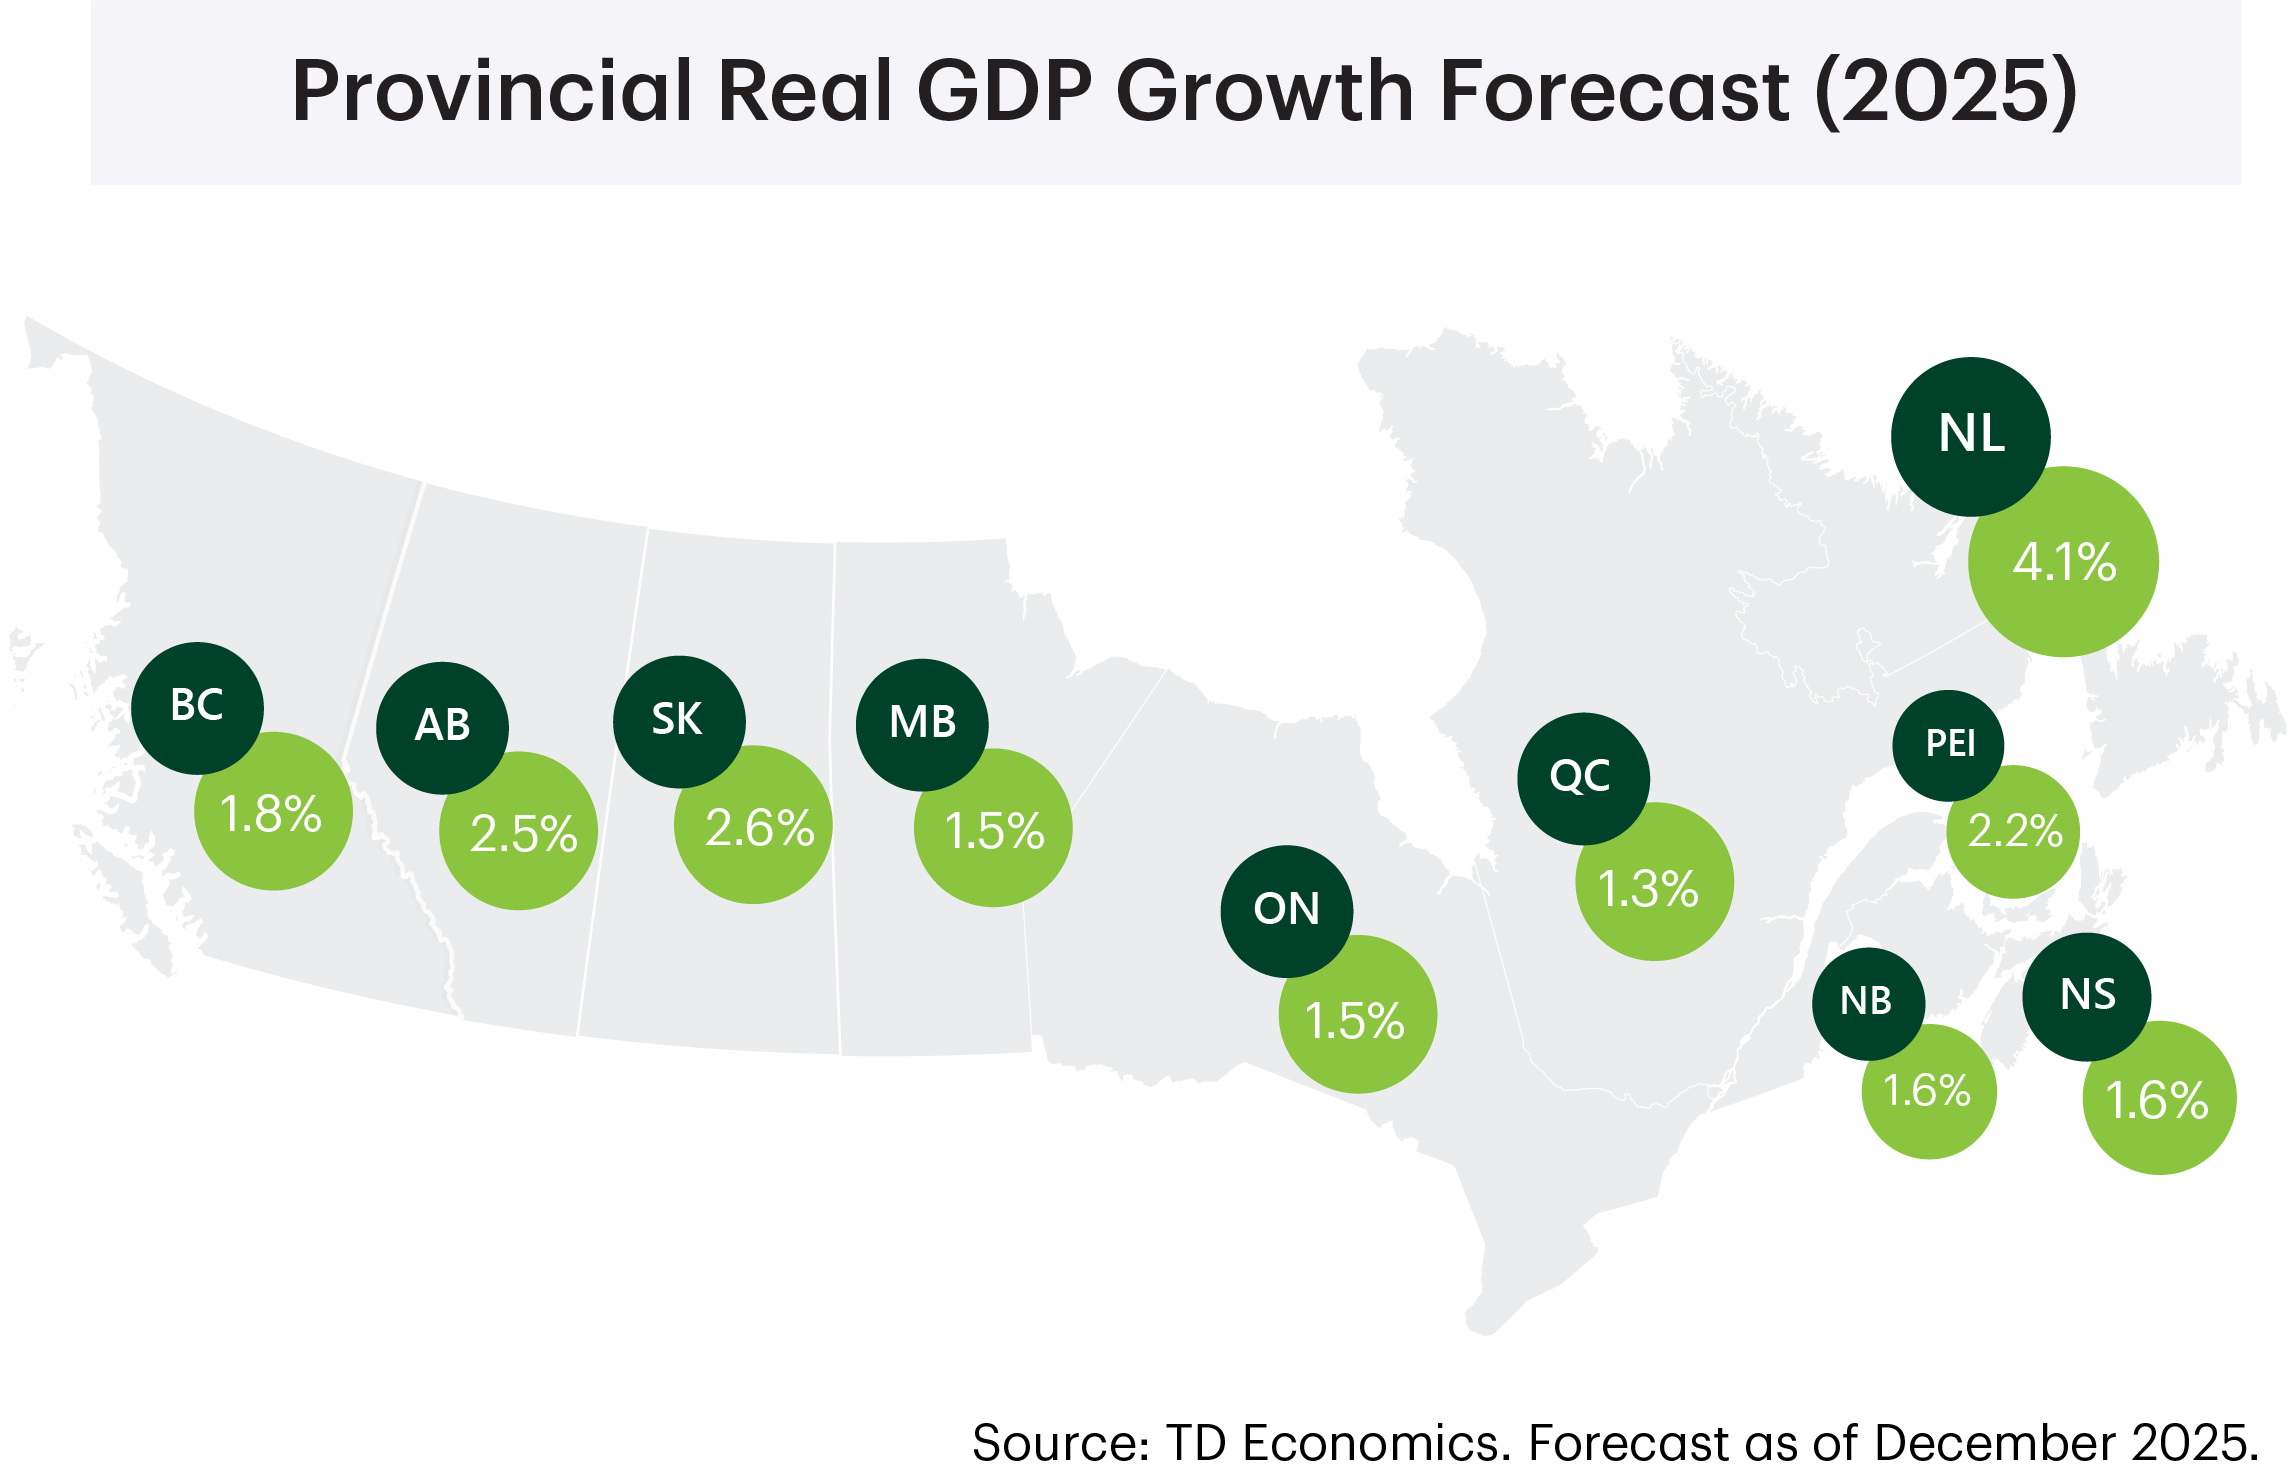
- Relative to our September projection, we’ve upgraded our 2025 growth forecasts across most regions, partly on the back of data revisions that showed economies entering the year with stronger momentum than expected. We continue to see PEI, AB, SK and NF as growth leaders this year, lifted by goods-producing industries. Meanwhile, QC, MB and ON are the likely laggards, weighed down by the trade war.
- For 2026, we see commodity-producing provinces outperforming again, but their margin of outperformance is likely to shrink amid moderately lower commodity prices, most prominently crude oil. Meanwhile, with the trade war proving less damaging than initially feared, provinces more geared to U.S. trade – like ON, MB, QC, and NB – have seen upgrades to their 2026 growth forecasts.
- Provincial exports have improved mildly since the peak of the trade shock in Q2-25, but limited trade-data access has clouded recent recovery trends. We assume that current tariff rates as well as the USMCA exemptions remain in place over the forecast horizon. The outcome of USMCA renegotiations is a risk to the outlook.
- Job markets in most provinces have turned in a more resilient performance than we had expected in September. Downside surprises in unemployment rates have been most pronounced in ON, AB, QC, NB, and PEI. While we could see job markets stumble again over the next few months, we’re expecting unemployment rates to broadly peak by Q1-2026 before drifting lower thereafter.
- Significant regional variations will exist as Canada’s housing market continues its gradual improvement next year. Price growth is likely to lag significantly in Ontario and, to a lesser extent, B.C., reflecting loose supply/demand conditions. In contrast, Quebec and the Prairies are likely to see firmer price gains, underpinned by tight conditions, and decent affordability (in the Prairies).
- Population growth is projected to continue to decelerate sharply across provinces in response to recent changes in federal immigration policy. These changes are constraining labour force growth, limiting upside in provincial jobless rates and pressuring down rents and to a lesser extent consumer spending. Provinces most exposed to these effects include ON, B.C. and QC due to their higher non-permanent resident (NPR) shares.
For more details on our national forecast see our Quarterly Economic Forecast
British Columbia
British Columbia Economic Forecasts
[ Annual average % change, unless otherwise noted ]
| Economic Indicators | 2025F | 2026F | 2027F |
| Real GDP | 1.8 | 1.5 | 1.7 |
| Nominal GDP | 4.3 | 4.0 | 3.8 |
| Employment | 1.2 | 0.4 | 0.7 |
| Unemployment Rate (%) | 6.2 | 6.1 | 5.6 |
| Housing Starts (000's) | 42.7 | 41.4 | 44.7 |
| Existing Home Prices | -2.5 | 3.6 | 3.4 |
| Home Sales | -5.2 | 15.1 | 13.0 |
We forecast B.C.’s real GDP growth to pick up in 2025 from last year’s sluggish pace thanks to recent strengthening in key economic indicators. Output will likely fall short of its long-term average in the near-term, but it’s still expected to exceed the national average growth rate.
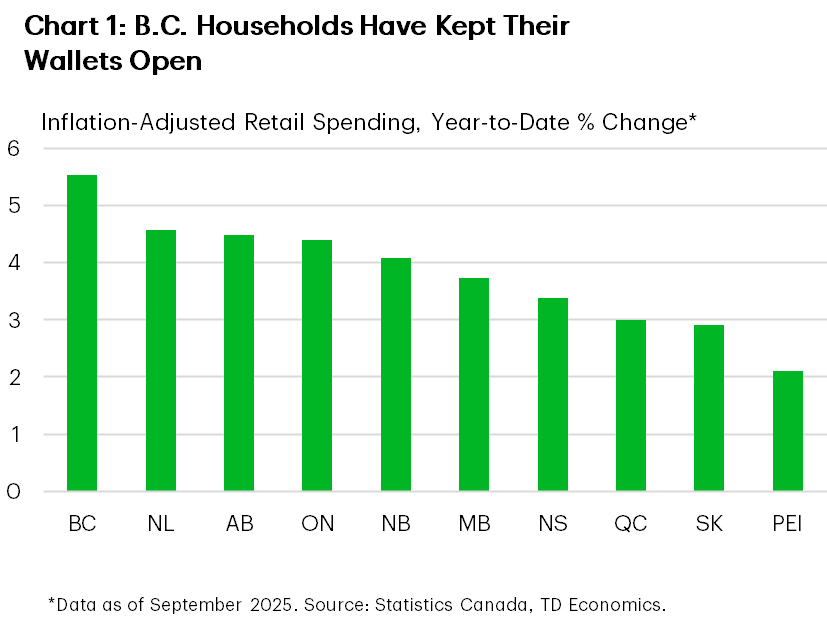
Contrary to our expectations, B.C.’s consumer spending has continued at a brisk pace despite still-high debt levels and decelerating population growth. In fact, the province leads nationally in inflation-adjusted retail spending this year, supported by moderating inflation and lower interest rates (Chart 1). Subdued spending in 2024 also provided a favourable baseline for growth this year. Looking ahead, we expect some of the current momentum to be sapped as employment growth cools and population growth continues to rein in.
A sharp turnaround in residential construction has also been a key growth contributor this year. Housing starts have trended swiftly higher and are currently running above their 10-year average. And while resale activity still sits approximately 20% below the decade average, a recent firming in sales bodes well for a pickup in 2026. We see resale volumes rising by a nation-leading 15% next year.
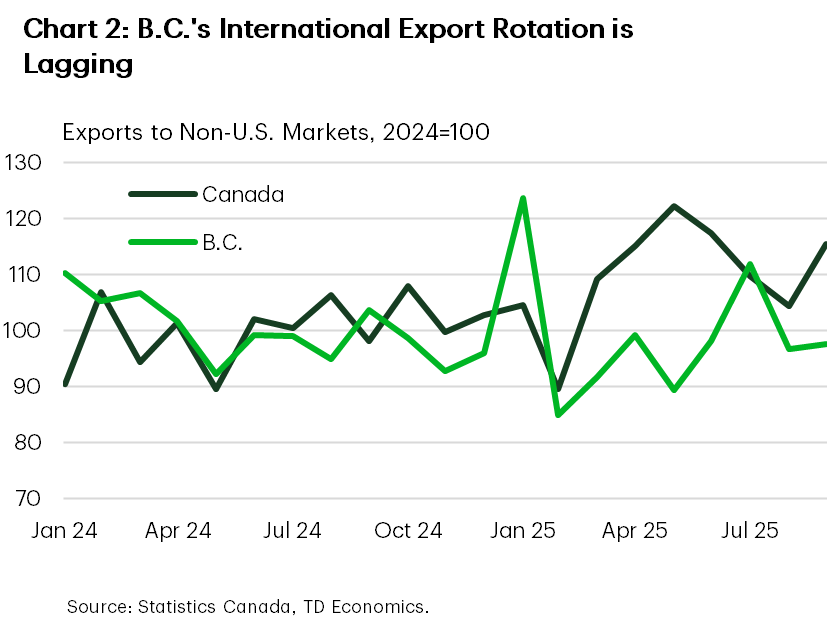
The external picture is more mixed, as U.S. tariffs and broader uncertainty still continue to weigh on exports and business investment. Among B.C.’s advantages is a diverse mix of trading partners. But as Chart 2 shows, B.C.’s exports to markets outside of the U.S. lag behind the export rotation recorded nationally. The imposition of new tariffs and recent rise in lumber duties have hampered forestry exports, while LNG exports are being offset by declining coal shipments.
Four major projects with a combined estimated value of $40 billion, including two major LNG expansions, have been fast-tracked by the federal government. We do not include these into our medium-term forecast, but they do present an upside risk if they do indeed move forward.
In its mid-year fiscal update, the government forecasts the FY 2025/26 deficit to be $11.2 billion (2.5% of GDP), roughly unchanged from February’s projections. B.C.’s fiscal position has weakened in recent years, leaving less flexibility to respond to growing competition for capital and near-term economic shocks. Program spending is projected to flatline next year, which may constrain growth in public services that have otherwise enjoyed robust growth over the last two years.
Alberta
Alberta Economic Forecasts
[ Annual average % change, unless otherwise noted ]
| Economic Indicators | 2025F | 2026F | 2027F |
| Real GDP | 2.5 | 1.9 | 2.1 |
| Nominal GDP | 4.3 | 3.8 | 4.0 |
| Employment | 2.8 | 1.8 | 0.8 |
| Unemployment Rate (%) | 7.3 | 6.9 | 6.3 |
| Housing Starts (000's) | 56.8 | 52.2 | 43.0 |
| Existing Home Prices | 3.7 | 4.4 | 4.3 |
| Home Sales | -7.3 | 5.9 | 10.7 |
Alberta’s economy is expected to grow at a trend-like pace in 2025, before taking a small step back next year. Still, the province appears positioned to outperform most other jurisdictions. Economic activity has been helped by momentum in the energy and construction sectors, along with steady consumer spending gains. These factors are helping to counterbalance weakness in U.S.-oriented sectors like manufacturing and wholesale industries.
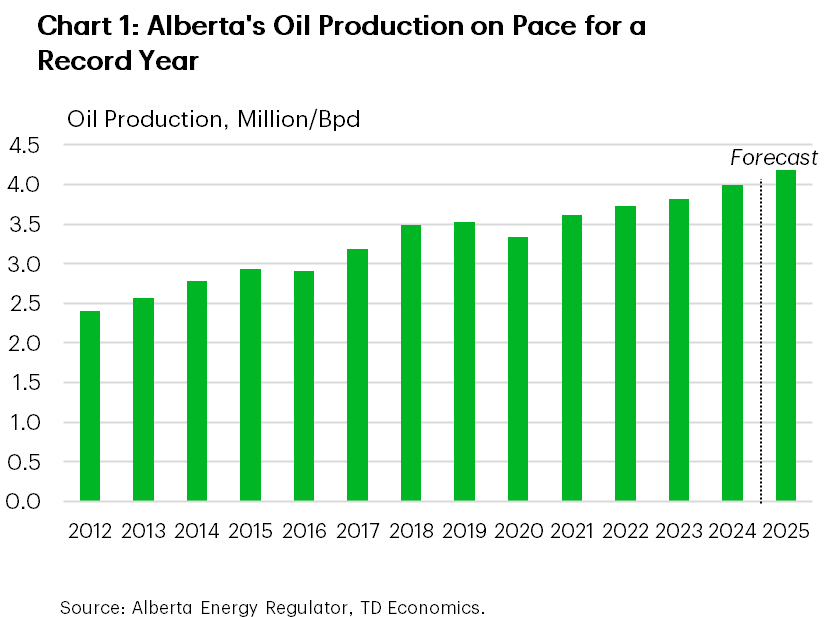
Improved market access, spare pipeline capacity, and sturdy global demand for oil have kept Alberta’s heavy crude production near record levels (Chart 1). The energy sector will continue supporting growth in 2026, but softer oil prices will likely slow the pace of new drilling and industry capital spending. The lower price of crude is also weighing on Alberta’s fiscal position, with the deficit now projected at $6.4 billion, up from the $1.4 billion shortfall estimated in the February Budget. Western Canada Select’s (WCS) recent outperformance over WTI has narrowed its discount to $10-12/bbl, partially cushioning the negative impact on government revenues.
Energy prospects may brighten if proposed pipeline expansions – adding up to ~600k/bpd to capacity over the next two years – move forward. This is in addition to the much-awaited MOU reached between Alberta and the federal government that sets out the necessary conditions to approve one or more new oil pipelines with at least 1 million/bpd of new capacity. While this deal represents a significant step forward, we would only incorporate the project into our projections when a private-sector proponent is secured and other MOU conditions are met.
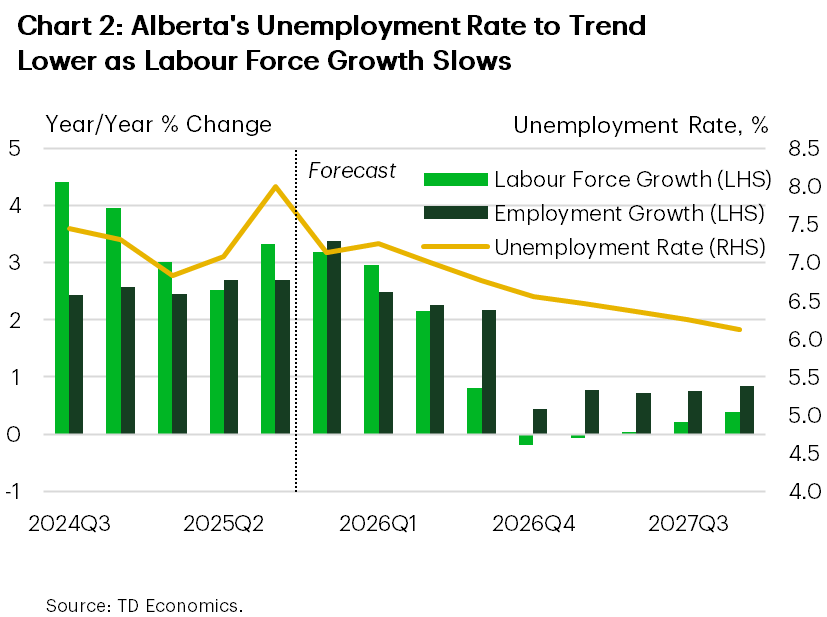
Over 2025, Alberta’s unemployment rate trended higher as labour force gains outstripped still-solid job growth. In November, the unemployment rate dropped sharply to 6.5%, suggesting a potential shift as labour force growth shows signs of moderating. Looking ahead, we expect the unemployment rate will gradually trend lower through 2026 as a continued deceleration in population growth reduces new labour supply (Chart 2).
Indeed, Alberta’s above-average population growth rate has helped drive solid inflation-adjusted spending by households. Other factors like lower inflation and government tax relief have also supported outlays. Moreover, the influx of newcomers has buoyed housing demand and residential construction, evidenced by the 20% year-to-date (YTD) increase in housing starts. This is reflected in our Alberta home sales forecast that sees growth of 6% next year.
Saskatchewan
Saskatchewan Economic Forecasts
[ Annual average % change, unless otherwise noted ]
| Economic Indicators | 2025F | 2026F | 2027F |
| Real GDP | 2.6 | 1.7 | 1.7 |
| Nominal GDP | 5.0 | 3.4 | 3.8 |
| Employment | 2.6 | 1.4 | 0.5 |
| Unemployment Rate (%) | 5.0 | 5.1 | 5.1 |
| Housing Starts (000's) | 6.8 | 5.6 | 5.0 |
| Existing Home Prices | 8.3 | 5.2 | 5.1 |
| Home Sales | 1.1 | 8.4 | 5.4 |
Recent data has reinforced that Saskatchewan’s economy is positioned to be among the provincial leaders in GDP growth this year. Looking ahead, the province will likely see 2026 growth moderate to a more sustainable pace, but still placing it above the national average.
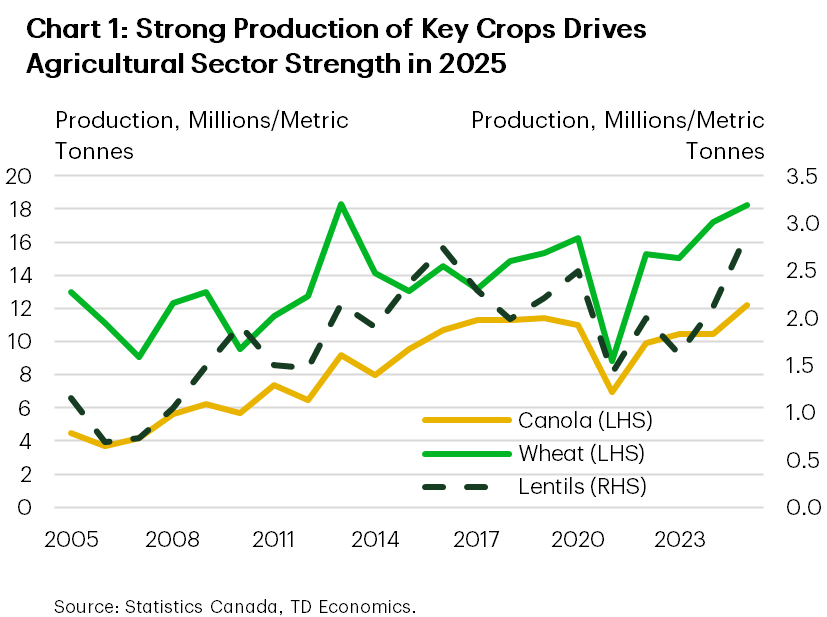
Official crop statistics for 2025 revealed a 13% increase in Saskatchewan’s total crop production, surpassing our projections. This robust growth is enough to boost headline GDP by up to one percentage point in 2025. Both canola and lentil harvests have hit record levels, while wheat production is nearing an all-time high (Chart 1). The agricultural forecast for 2026 is more cautious, as yields likely moderate and Chinese duties on $5 billion worth of canola products continue to weigh. Canola exports to China – Saskatchewan’s second largest trading partner – are down by 40% this year, while wheat exports have been able to take up some of the slack.
Elsewhere in the commodity space, production and shipments of potash and uranium have turned in solid performances so far this year. Looking ahead, prospects for steady 3% global growth are expected to underpin healthy demand for these commodities in 2026-27, though a near-term easing in prices may limit some upside to activity. On the other hand, oil production and exports are on track to contract moderately this year. And next year’s performance is likely to stay relatively muted, as weaker prices and oversupplied markets dampen industry profitability.
The construction sector is poised for a second consecutive year of double-digit growth in 2025, lifted by surging residential and non-residential spending. The pace of construction growth in 2026 will likely ease, but to a still-sturdy rate. Notably, the government plans to ramp up capital spending in coming years, while ongoing work on major private investment projects adds a mild tailwind to the province’s economic growth.
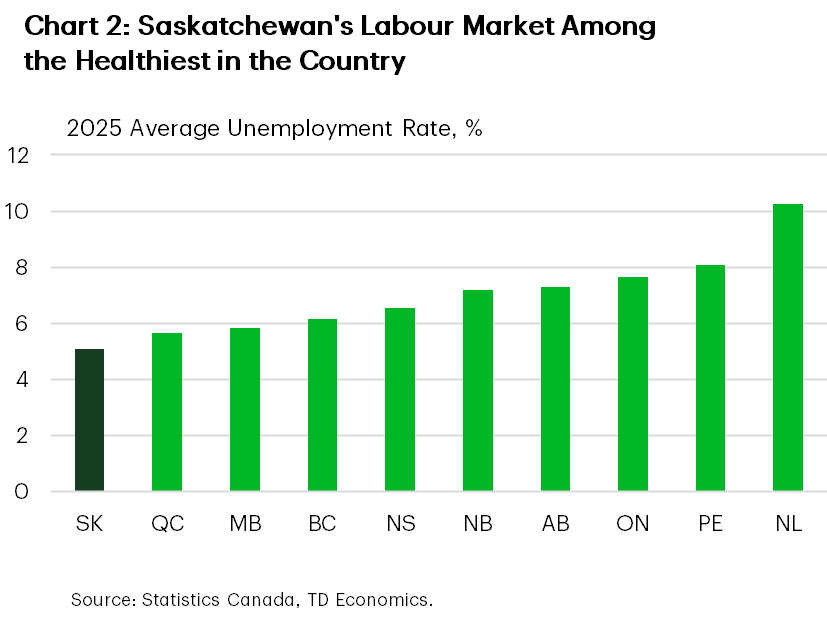
Saskatchewan’s labour market has been a clear outperformer, boasting the lowest unemployment rate among jurisdictions (Chart 2). Robust employment growth has supported real wage gains and has pushed inflation-adjusted retail spending growth ahead of most provinces. Still, the recent hiring strength has been driven almost entirely by the public sector. Next year, we expect to see a rotation back to private-sector-led hiring with the unemployment rate likely holding around current levels.
Manitoba
Manitoba Economic Forecasts
[ Annual average % change, unless otherwise noted ]
| Economic Indicators | 2025F | 2026F | 2027F |
| Real GDP | 1.5 | 1.3 | 1.9 |
| Nominal GDP | 4.0 | 3.5 | 4.1 |
| Employment | 1.7 | 1.2 | 0.7 |
| Unemployment Rate (%) | 5.8 | 5.5 | 5.2 |
| Housing Starts (000's) | 7.8 | 7.3 | 6.3 |
| Existing Home Prices | 5.9 | 6.3 | 4.3 |
| Home Sales | 3.6 | 2.8 | 4.0 |
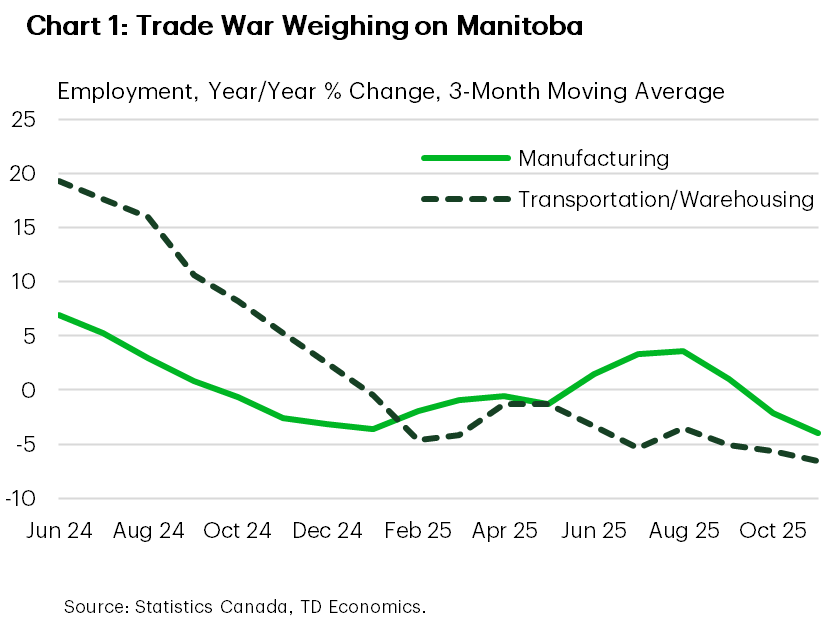
We’re tracking a 2025 real GDP gain in Manitoba that’s a tick below the 10-year average. Despite U.S. tariffs having minimal direct impact on Manitoba’s exports, the hazy trading environment has likely impacted confidence and activity in industries most reliant on the U.S. Indeed, employment in manufacturing and transportation/warehousing is down 2% on average so far in 2025 (Chart 1) and has yet to show signs of turning around unlike trends being observed nationally. On the flipside, we see the public sector making a large contribution to growth this year, consistent with hiring trends. And agricultural production likely advanced around 5% this year (despite Chinese tariffs on canola products), driven by gains in rye, corn and soybeans.
With the province having absorbed the initial blow from the trade war, we anticipate that its U.S.-levered industries will (belatedly) begin to grind out a modest recovery next year, consistent with continued solid U.S. expansion. Interprovincial trade is especially important to Manitoba. The province has its own legislation removing trade barriers, while being signatory to the recent federal-provincial-territorial interprovincial trade agreement. This should also help bolster activity next year. The Port of Churchill development is on Canada’s list of “transformative projects”, with the federal and provincial government committing funding towards the project. If implemented, the project would enhance Manitoba’s medium-term international trade. However, it’s in its very early stages, with significant hurdles still to overcome.
Despite the soft economic backdrop, overall hiring has preceded at a firmer pace in Manitoba than the rest of the country, on a year-to-date basis. This has backstopped a decent consumption performance. However, with the pace of hiring likely to cool next year in line with slowing population and labour force gains, household spending should put up a more muted performance in 2026.
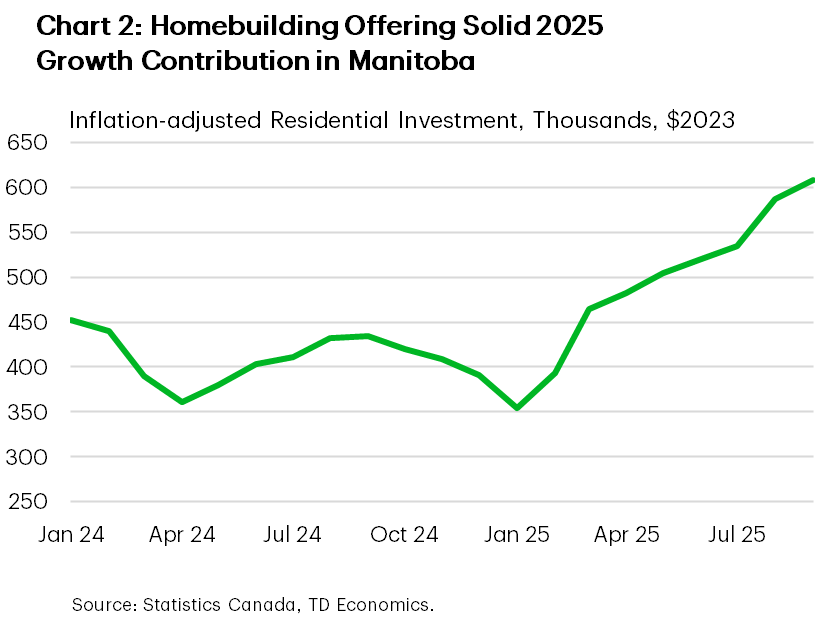
Softer hiring should also cool some of the momentum in housing demand and home price growth next year. That said, home prices are elevated, which alongside rental construction is supporting robust residential investment (Chart 2). This trend should persist next year, and provincial capital spending plans are healthy. As such, construction is likely to make another notable contribution to growth in 2026.
Ontario
Ontario Economic Forecasts
[ Annual average % change, unless otherwise noted ]
| Economic Indicators | 2025F | 2026F | 2027F |
| Real GDP | 1.5 | 1.0 | 1.8 |
| Nominal GDP | 4.0 | 3.4 | 3.8 |
| Employment | 1.0 | 0.1 | 0.5 |
| Unemployment Rate (%) | 7.6 | 7.5 | 7.0 |
| Housing Starts (000's) | 62.1 | 60.7 | 64.1 |
| Existing Home Prices | -3.2 | 0.6 | 3.2 |
| Home Sales | -4.6 | 13.0 | 10.1 |
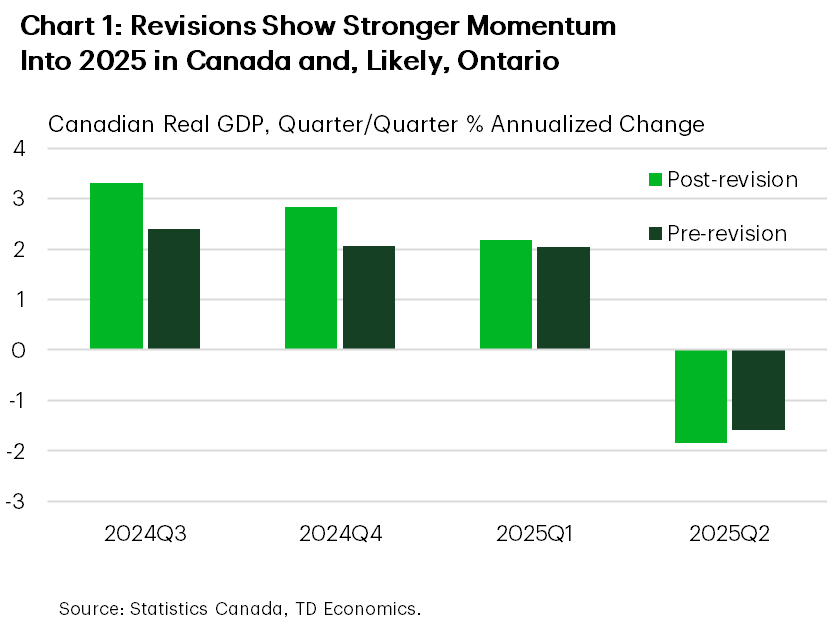
Recent data revisions suggest that nation-wide growth was about 0.5 ppts higher in 2023 and 2024 than previously thought. 2024’s revision suggests that Ontario had better-than-anticipated momentum heading into this year (Chart 1). This underpins our upgraded 2025 real GDP growth forecast. Most heartening were the sizeable positive revisions to business capital spending, which suggests a less depressed investment backdrop than initially feared. However, the picture for Ontario so far in 2025 has been less than encouraging. Provincial data suggest that Ontario’s economy barely grew in the first half of 2025, owing to retrenching homebuilding and plunging exports and private sector investment amid the trade war. The province did receive some good news on the latter, however, with the recent announcement that a $3.2 billion graphite plant will be built in St. Thomas.
Industries highly levered to the U.S. are on course to subtract from 2025 GDP growth. In the manufacturing sector, recent decisions by automakers to shift production to the U.S. and not move forward with new production that was previously planned are negative for the outlook. On the brighter side, manufacturing activity excluding autos is starting to stir, with nominal sales rising in two of the last three months to October. Exports to non-us trading partners are also up 20% year-to-date. Looking ahead to 2026, we’re forecasting a broader – though still mild –recovery in manufacturing activity, lifted by continued U.S. and Canadian growth. Ontario has also been relatively aggressive in removing interprovincial trade barriers, which could help manufacturing prospects.
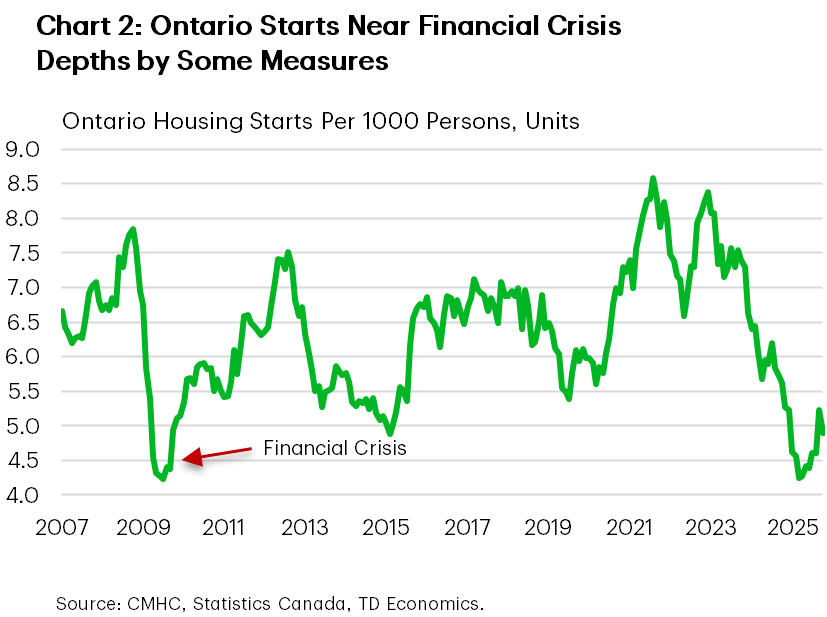
Homebuilding in the province is very subdued (Chart 2), held back by elevated costs and years of low pre-construction sales in the GTA. Amid slowing population growth and rising inventory levels, we’re forecasting another difficult year for homebuilding in 2026. In contrast, resale activity should continue rising from its low level moving forward, supported by pent-up demand, although supply/demand conditions that favour buyers will likely keep price growth cool.
Consumption held up well in the first half. However, declining retail spending volumes suggests a softer Q3 performance. This is consistent with our expectation of modest consumption gains moving forward, as muted economic growth and impeded business confidence weighs on hiring.
Québec
Quebec Economic Forecasts
[ Annual average % change, unless otherwise noted ]
| Economic Indicators | 2025F | 2026F | 2027F |
| Real GDP | 1.3 | 1.1 | 1.6 |
| Nominal GDP | 4.3 | 3.4 | 3.6 |
| Employment | 1.7 | -0.2 | 0.2 |
| Unemployment Rate (%) | 5.6 | 5.7 | 5.5 |
| Housing Starts (000's) | 60.1 | 57.2 | 51.9 |
| Existing Home Prices | 8.3 | 6.9 | 4.4 |
| Home Sales | 8.8 | 4.1 | 1.0 |
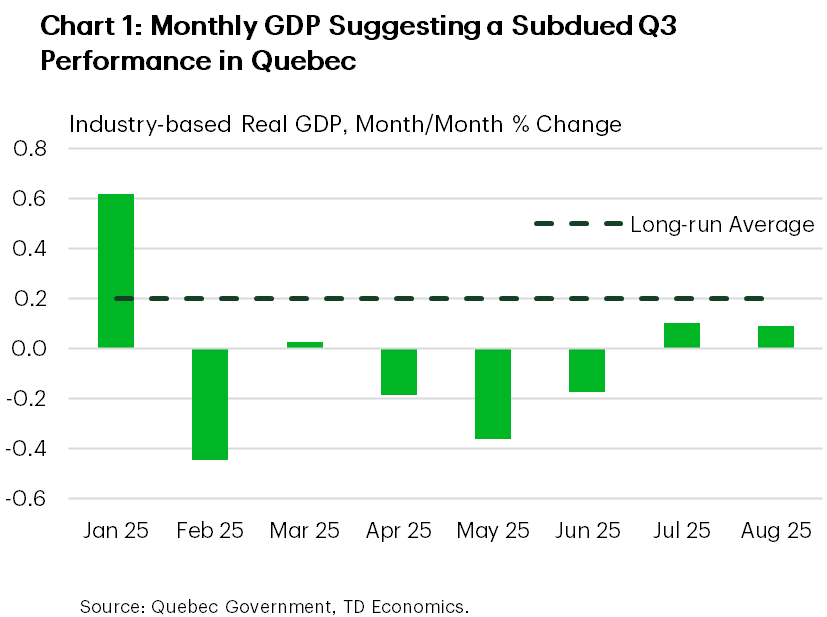
Recent revisions show that Canada had better momentum heading into this year than previously thought. Some of this improvement likely took place in Quebec, supporting our upgraded 2025 annual average GDP growth forecast. However, the province is still likely to turn in a relatively weak performance this year, partially on the back of a massive 2.4% annualized contraction in Q2 GDP. Moreover, industry-based GDP data are flagging a relatively modest Q3 rebound (Chart 1).
Industries levered to the U.S have driven the weakness this year, particularly Quebec’s manufacturing sector. Notably, exports of aluminum to the U.S. (directly targeted by U.S. tariffs) have dropped 15% so far this year. The transportation sector strike will also weigh in the near-term.
On a positive note, manufacturing sales have managed to turn higher since May, highlighting that the worst of the initial trade shock is in the rearview. What’s more, Quebec has had some success in shipping to non-U.S. markets, with exports to the EU up 27% year-to-date. This increases our confidence that 2026 will be modestly better for the province’s manufacturers, assuming no major downside on trade policy materializes during the upcoming USMCA review.
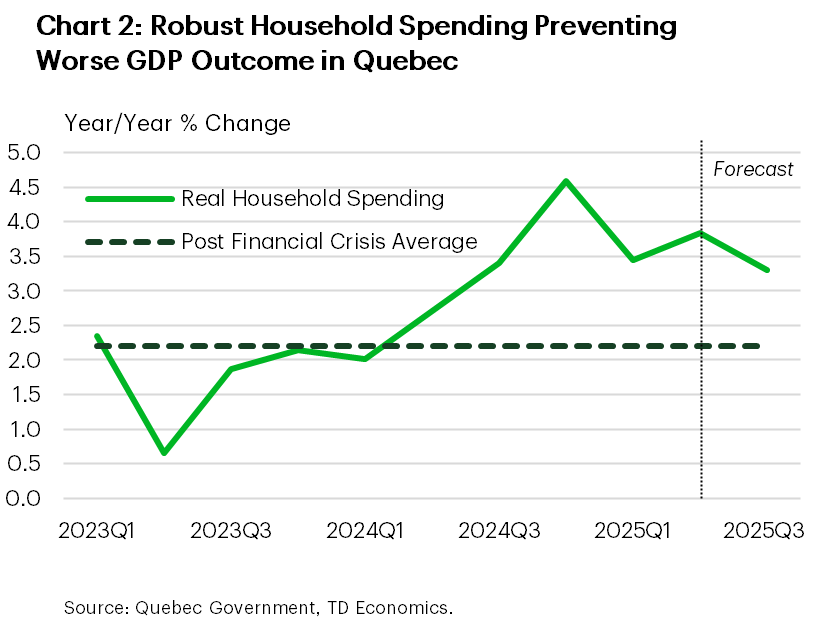
Bucking the trend in external-facing portions of the economy, household spending has been solid so far this year (Chart 2). Hiring has been resilient. Households in the province are also tapping their savings to finance consumption, with the household savings rate dropping 1.5 ppts year-on-year to a still-elevated 7.9% in 2025Q2. Moving forward, an outlook for cooling job growth should sap some steam from consumption next year, restraining the pace of improvement in overall GDP. On the flip side, households will see some modest support from measures in the latest fiscal update, including reduced contribution rates to the QPP, and the indexation of personal income taxes and social assistance benefits to inflation.
Robust housing activity has been another factor that has supported consumption. Home sales are running well above long-term norms on a per capita basis (supported by job markets), while home price growth continues to be robust. Moving forward, we continue to see solid price growth in Quebec next year, underpinned by tight supply/demand balances.
New Brunswick
New Brunswick Economic Forecasts
[ Annual average % change, unless otherwise noted ]
| Economic Indicators | 2025F | 2026F | 2027F |
| Real GDP | 1.6 | 1.3 | 1.1 |
| Nominal GDP | 3.9 | 3.5 | 3.1 |
| Employment | 1.2 | 0.4 | 0.4 |
| Unemployment Rate (%) | 7.2 | 7.6 | 7.4 |
| Housing Starts (000's) | 7.1 | 6.9 | 4.5 |
| Existing Home Prices | 5.9 | 4.9 | 4.2 |
| Home Sales | 3.4 | 6.3 | 3.0 |
We’ve nudged up N.B.’s growth outlook for both 2025 and 2026, largely on the back of recent upward revisions to national growth and the province’s sturdier-than-expected showing since our September projection. Average GDP growth of 1.5% this year and next is consistent with N.B.’s longer-term historical trend and puts it on track to keep pace with Canada.
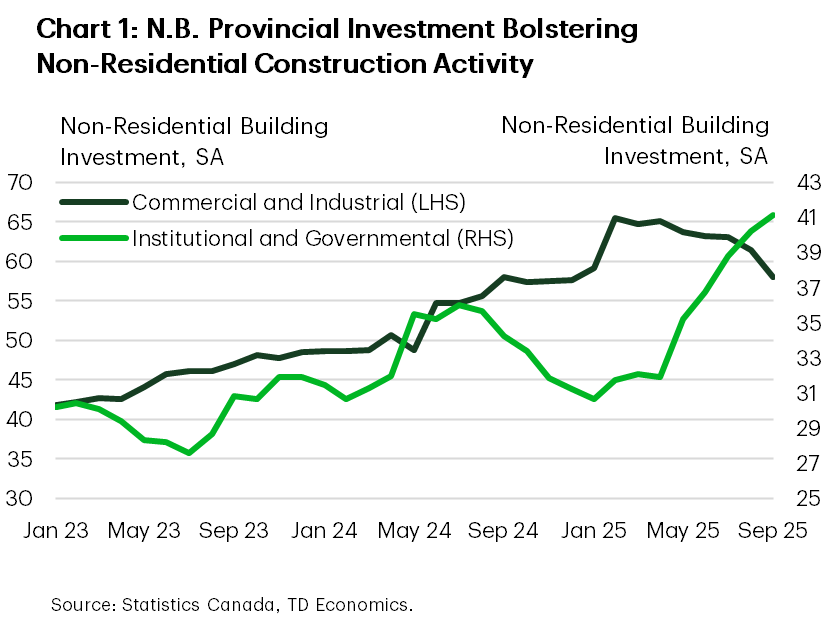
Increased infrastructure spending by the provincial government is providing a boost to construction activity. Over the past year, investment in institutional and government buildings has increased by more than 50% to reach a new record high. This is helping to offset some of the slowdown in private sector investment (Chart 1). New housing construction has also been very robust, as record-high housing starts are being fueled by strong demand for multi-unit rental properties. We expect residential building activity to moderate next year as a number of current projects reach completion. Meanwhile, resale conditions are expected to remain relatively tight, as transactions expand further and average price growth holds in the mid-single-digits.
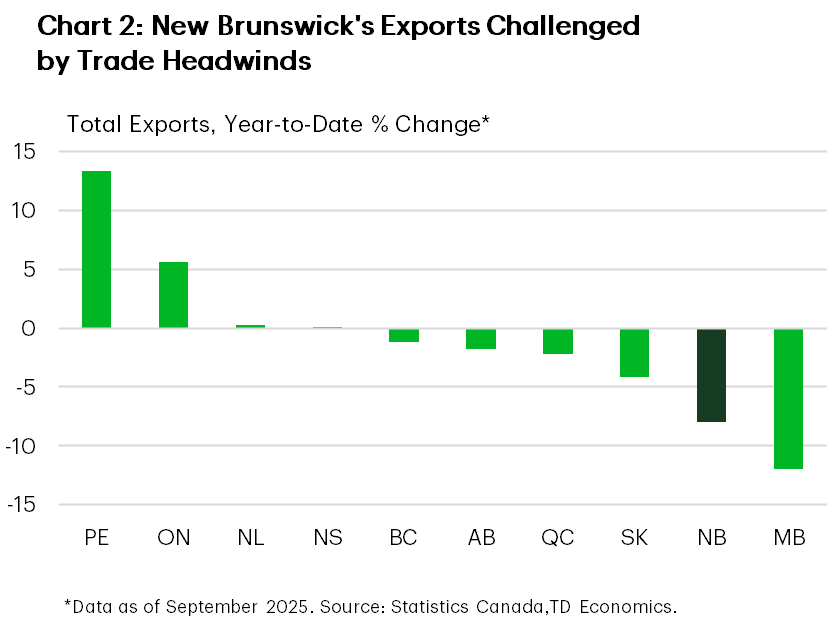
Manufacturing, transportation, and wholesale sales – the sectors most exposed to external trade – continue to face challenges from tariffs and declining U.S. demand. This is reflected in the 8% year-to-date drop in total exports, one of the weakest showing among provinces (Chart 2). By our calculations, the contractions expected in these industries will shave around 0.3 percentage points (ppts) off of headline GDP growth this year. However, we anticipate that these sectors will record slight improvements over the remainder of the forecast horizon, as exporters continue to adapt to the U.S. tariff environment.
Elsewhere, households are showing their mettle despite the ongoing trade and job market uncertainty. Retail spending growth has been running in the middle of the provincial pack this year, helped in part by the relatively low average debt level of consumers. We do expect some of this spending momentum to wane next year as population growth continues to decelerate.
In its mid-year fiscal update, the provincial government projected a deficit of $835 million in FY 2025/26 (or -1.7% of GDP)– the largest fiscal shortfall in 12 years. For now, the government remains on track to grow program spending by 5% next year, notably higher than most provinces.
Nova Scotia
Nova Scotia Economic Forecasts
[ Annual average % change, unless otherwise noted ]
| Economic Indicators | 2025F | 2026F | 2027F |
| Real GDP | 1.6 | 1.6 | 1.2 |
| Nominal GDP | 4.1 | 4.0 | 3.2 |
| Employment | 0.5 | -0.2 | 0.4 |
| Unemployment Rate (%) | 6.6 | 6.9 | 6.8 |
| Housing Starts (000's) | 9.9 | 8.3 | 6.6 |
| Existing Home Prices | 4.5 | 4.5 | 3.6 |
| Home Sales | 0.9 | 6.7 | 7.9 |
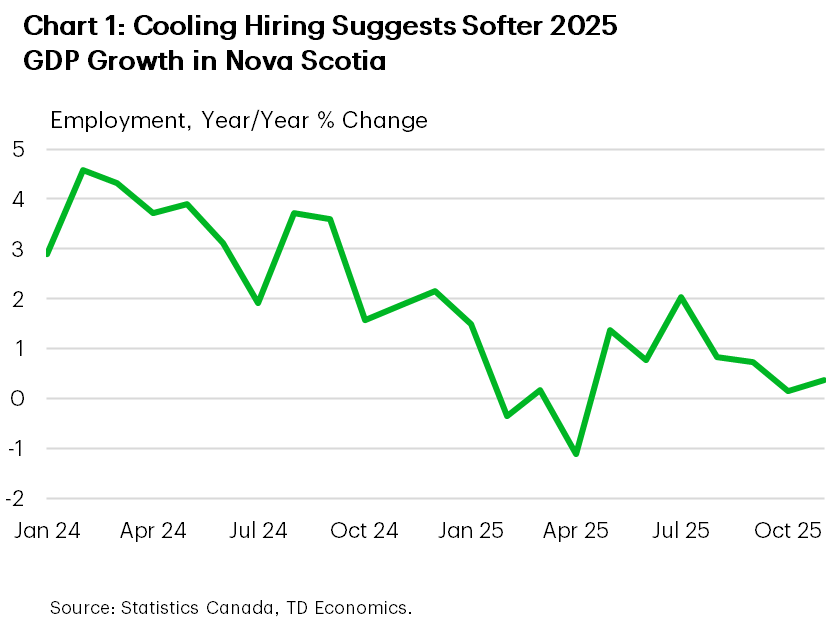
We’ve upgraded our 2025 growth forecasts for Nova Scotia, in line with significant upward revisions to Canadian GDP that show improved nation-wide momentum heading into this year. Still, while decent, growth is tracking its slowest (non-pandemic) performance in nearly a decade. This would be consistent with the cooling we’ve seen in job growth (Chart 1). We’re estimating soft performances in finance/insurance/real estate and the public sector – in line with hiring trends. The latter comes despite the province’s latest fiscal update showing a steep upward revision to FY 2025/26 program spending, on the back of healthcare.
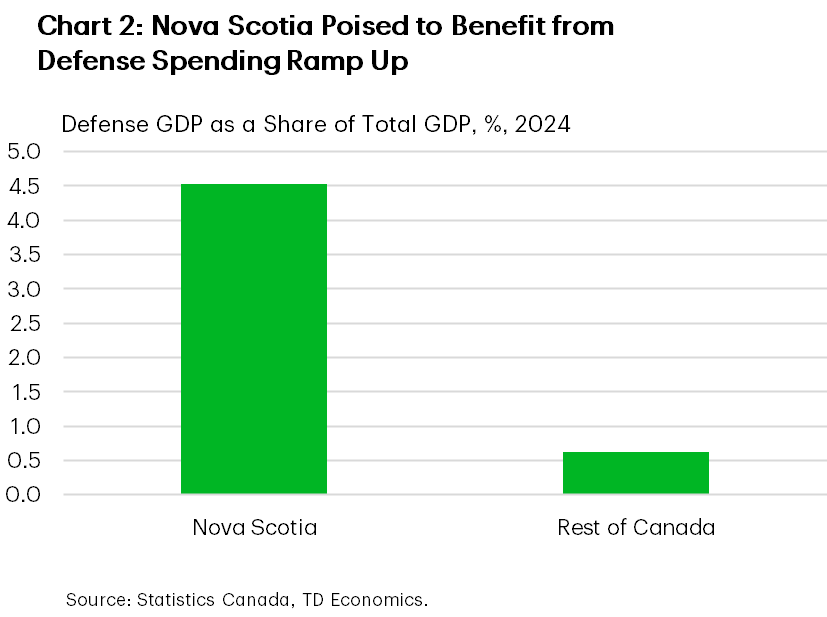
We’re expecting a similarly decent growth showing for Nova Scotia next year. The province’s large defense industry should receive an on-going lift from the federal commitment to invest $80 billion in Canadian defense and indeed, we saw Canadian government capital expenditures surge in the 3rd quarter (Chart 2). What’s more, military workers will benefit from pay raises offered by the federal government.
Construction activity has been making a solid contribution to GDP this year, lifted by residential and non-residential spending. 2026 should see more of the same, given highly elevated housing starts and construction of the large-scale QEII hospital development. What’s more, work on the new $2.1 billion Goldboro gold mine is expected to start next year. If it gets off the ground, the $60 billion Wind West offshore wind project offers significant promise over the medium term, both during the construction and operation phases.
Nova Scotia’s external-facing industries are holding up (even with 25% Chinese tariffs on the province’s seafood products). Exports to the U.S. have been flat this year (compared to a 3% Canada-wide drop), helped by what is likely a high degree of CUSMA compliance in the tire manufacturing industry. However, a more modest gain in manufacturing is likely in 2026 (flagged by some softening momentum in sales since July) as activity in domestic trading partners is subdued.
Retail sales have held up well so far this year, supported by robust wage growth. However, we see consumer spending softening in 2026, holding back the gain in GDP. Another year of weak population growth should play a role in restraining hiring below recent trends, weighing on consumption.
Prince Edward Island
P.E.I. Economic Forecasts
[ Annual average % change, unless otherwise noted ]
| Economic Indicators | 2025F | 2026F | 2027F |
| Real GDP | 2.2 | 1.5 | 1.6 |
| Nominal GDP | 4.3 | 3.9 | 3.6 |
| Employment | 0.8 | 0.4 | 0.6 |
| Unemployment Rate (%) | 8.1 | 8.1 | 8.0 |
| Housing Starts (000's) | 1.7 | 1.5 | 1.3 |
| Existing Home Prices | 2.9 | 5.1 | 3.5 |
| Home Sales | 5.6 | 4.0 | 3.9 |
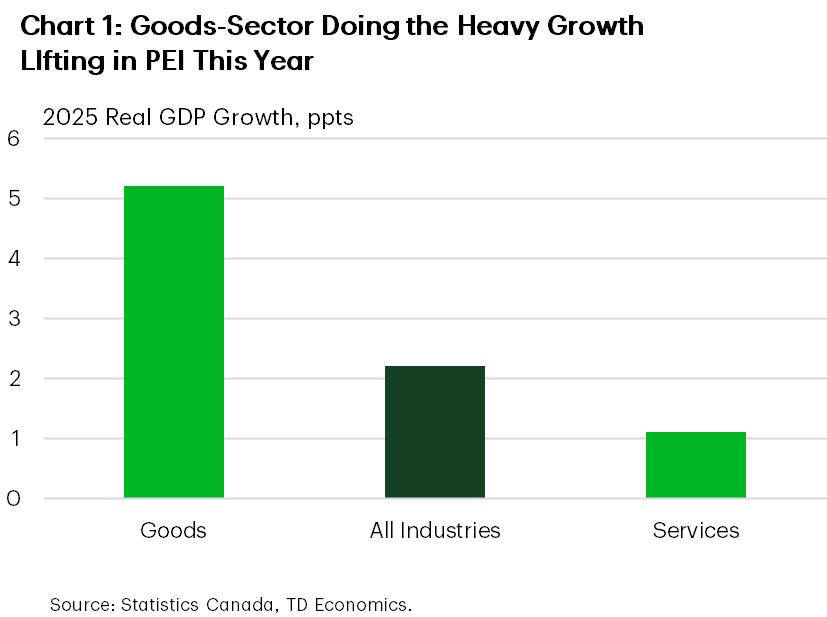
In the past decade, PEI’s real GDP growth has quietly topped Canada’s nearly every year, fuelled by stronger population growth. This outperformance looks to have been repeated in 2025, with the Island likely to sit near the top of the provincial growth leaderboard. The goods sector has been doing most of the heavy lifting on growth (Chart 1), despite what looks to be a down year for agricultural production, owing to a pull-back in non-potato crops. Surging construction activity has supplied the largest boost, with residential investment stoked by several years of robust population gains, and non-residential spending fuelled by government investments. We see construction making another strong growth contribution in 2026. The provincial government’s recently released capital plan features a 16% jump in planned capital outlays in FY 2026/27 compared to the prior target for the same year. The Island’s capital plan comes with a cost, however, as it’s debt-to-GDP ratio is forecast to climb to 35% in FY 2026/27 – the highest since at least FY 1986/87.
Manufacturing has also bucked the national trend, with shipments up 11% year-to-date, year-on-year, lifted by durable goods. International export growth has also been robust, both to U.S. and non-U.S. markets, on the back of food products. Tourism is another external-focused industry that’s enjoyed a firm 2025 (overnight stays up 10% year-to-date), buoyed by domestic visitors and a low Canadian dollar. Next year could bring a moderation to more sustainable growth rates within these industries. We’re also anticipating some firming in the loonie.
Despite the positives noted above, we’re forecasting economic growth to post its weakest (non-pandemic) performance since 2015 next year. We’ve baked in a slowdown in public sector output growth in 2026, which is notable as it accounts for about one-third of PEI’s GDP. This would be consistent with the provincial budget. The federal government also has a large presence in PEI, so federal operating spending cuts should weigh heavily on the Island. Note that the federal government accounted for 7% of the Island’s GDP in 2024, compared to 2% for Canada overall.
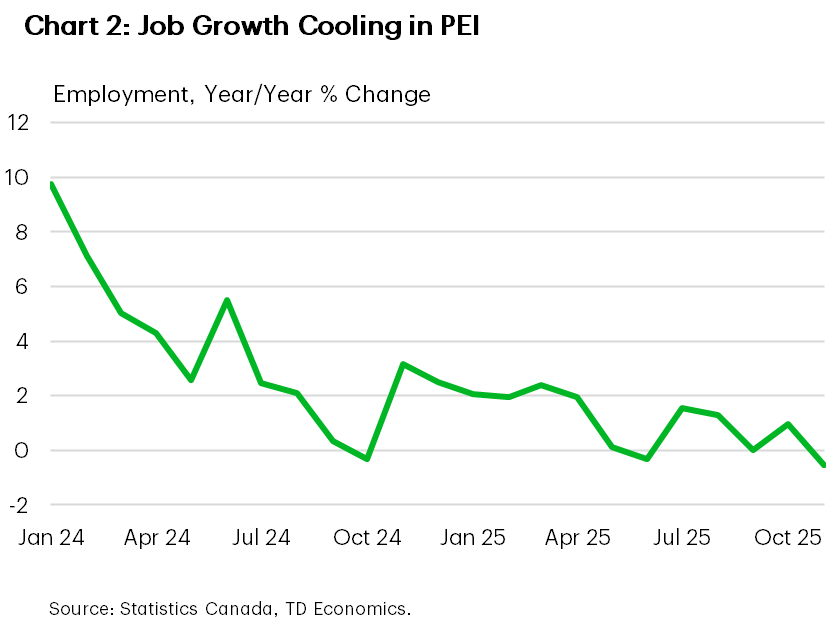
Population growth has been cooling rapidly, shifting from a 4% annual pace in early 2024 to 1.6% in 2025Q3, driven by a net outflow of non-permanent residents. We anticipate slow population growth again next year, restraining job gains and spending (Chart 2).
Newfoundland & Labrador
NFLD & Labrador Economic Forecasts
[ Annual average % change, unless otherwise noted ]
| Economic Indicators | 2025F | 2026F | 2027F |
| Real GDP | 4.1 | 1.8 | 0.9 |
| Nominal GDP | 5.9 | 4.0 | 3.1 |
| Employment | -0.2 | -0.6 | -0.1 |
| Unemployment Rate (%) | 10.3 | 10.9 | 11.1 |
| Housing Starts (000's) | 1.5 | 1.4 | 1.5 |
| Existing Home Prices | 7.8 | 3.7 | 3.0 |
| Home Sales | 7.6 | 1.7 | 4.5 |
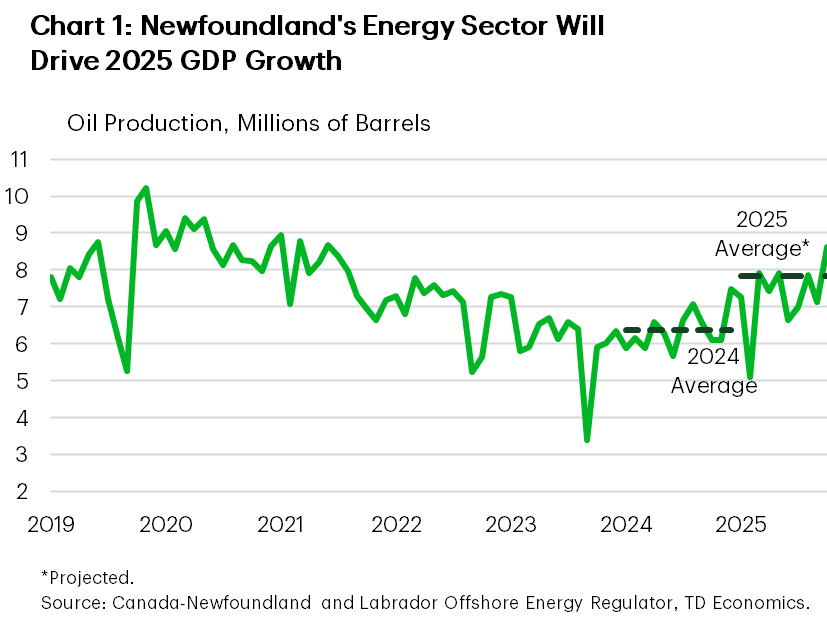
After several years of underperformance, N&L’s economy is set to record nation-leading growth in 2025. Indeed, we upgraded our already-bullish estimate relative to September. The energy sector is the driving force, contributing to over half of estimated growth for the year. All oilfields are in operation for the first time since late-2023, which has helped push year-to-date (YTD) production volumes nearly 20% higher (Chart 1) and marking the best year for the sector since 2016. Looking ahead, with the impetus from higher oil production set to fade, we expect the province’s growth rate to return back to the slow lane by 2027.
This year, the province has been better able to manage trade-related headwinds as its geographic advantage has allowed it to capitalize on global trading opportunities. Indeed, over 50% of energy shipments now head to Europe and total exports to non-U.S. trading partners are growing at the fastest pace across provinces. This relative advantage will continue to support a gradual export recovery next year.
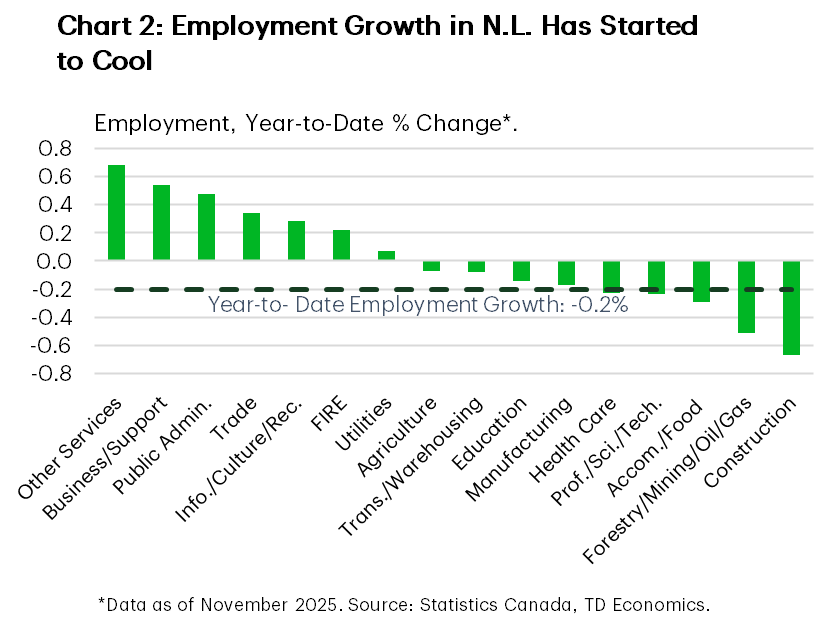
The strong economic backdrop has also supported households, who continue to spend at a decent clip. However, we’ve seen retail spending cool in recent months, likely a lagged response to the slowdown in the job market. Hiring in the province has now turned negative on a year-to-date basis, with over half the province’s industries expected to shed jobs this year (Chart 2). Unfortunately, conditions in the job market appear set to weaken further in the coming quarters, sending the jobless rate higher to around 11% by end-2026, and flattening thereafter.
The construction sector has been the glaring weak spot in the economy this year and activity will likely remain subdued over the remainder of the forecast horizon. Housing starts have fallen this year, pressuring real residential investment lower. Meanwhile, non-residential investment has also been pulling back. Notably, the government announced a significant scaling back in its capital spending plans earlier this year. Cumulative public capital investment by the year 2028 is slated to be more than $30 billion lower.
Longer-term prospects for N&L’s economy would brighten significantly should two major projects – a proposed offshore oilfield and a hydroelectricity deal with Quebec – ultimately get fast-tracked by the federal government and push ahead. There is reason to be optimistic as these projects would fall under the Eastern Energy Partnership.
Forecast Table
Provincial Economic Forecasts
| Provinces | Real GDP (% Chg.) |
Nominal GDP (% Chg.) |
Employment (% Chg.) |
Unemployment Rate (Average, %) |
Housing Starts (Thousands) |
Home Prices (% Chg.) |
||||||||||||
| 2025F | 2026F | 2027F | 2025F | 2026F | 2027F | 2025F | 2026F | 2027F | 2025F | 2026F | 2027F | 2025F | 2026F | 2027F | 2025F | 2026F | 2027F | |
| National | 1.7 | 1.3 | 1.7 | 4.2 | 3.6 | 3.8 | 1.4 | 0.4 | 0.5 | 6.8 | 6.7 | 6.4 | 256.5 | 242.5 | 228.8 | -0.8 | 4.1 | 4.4 |
| Newfoundland & Labrador | 4.1 | 1.8 | 0.9 | 5.9 | 4.0 | 3.1 | -0.2 | -0.6 | -0.1 | 10.3 | 10.9 | 11.1 | 1.5 | 1.4 | 1.5 | 7.8 | 3.7 | 3.0 |
| Prince Edward Island | 2.2 | 1.5 | 1.6 | 4.3 | 3.9 | 3.6 | 0.8 | 0.4 | 0.6 | 8.1 | 8.1 | 8.0 | 1.7 | 1.5 | 1.3 | 2.9 | 5.1 | 3.5 |
| Nova Scotia | 1.6 | 1.6 | 1.2 | 4.1 | 4.0 | 3.2 | 0.5 | -0.2 | 0.4 | 6.6 | 6.9 | 6.8 | 9.9 | 8.3 | 6.6 | 4.5 | 4.5 | 3.6 |
| New Brunswick | 1.6 | 1.3 | 1.1 | 3.9 | 3.5 | 3.1 | 1.2 | 0.4 | 0.4 | 7.2 | 7.6 | 7.4 | 7.1 | 6.9 | 4.5 | 5.9 | 4.9 | 4.2 |
| Québec | 1.3 | 1.1 | 1.6 | 4.3 | 3.4 | 3.6 | 1.7 | -0.2 | 0.2 | 5.6 | 5.7 | 5.5 | 60.1 | 57.2 | 51.9 | 8.3 | 6.9 | 4.4 |
| Ontario | 1.5 | 1.0 | 1.8 | 4.0 | 3.4 | 3.8 | 1.0 | 0.1 | 0.5 | 7.6 | 7.5 | 7.0 | 62.1 | 60.7 | 64.1 | -3.2 | 0.6 | 3.2 |
| Manitoba | 1.5 | 1.3 | 1.9 | 4.0 | 3.5 | 4.1 | 1.7 | 1.2 | 0.7 | 5.8 | 5.5 | 5.2 | 7.8 | 7.3 | 6.3 | 5.9 | 6.3 | 4.3 |
| Saskatchewan | 2.6 | 1.7 | 1.7 | 5.0 | 3.4 | 3.8 | 2.6 | 1.4 | 0.5 | 5.0 | 5.1 | 5.1 | 6.8 | 5.6 | 5.0 | 8.3 | 5.2 | 5.1 |
| Alberta | 2.5 | 1.9 | 2.1 | 4.3 | 3.8 | 4.0 | 2.8 | 1.8 | 0.8 | 7.3 | 6.9 | 6.3 | 56.8 | 52.2 | 43.0 | 3.7 | 4.4 | 4.3 |
| British Columbia | 1.8 | 1.5 | 1.7 | 4.3 | 4.0 | 3.8 | 1.2 | 0.4 | 0.7 | 6.2 | 6.1 | 5.6 | 42.7 | 41.4 | 44.7 | -2.5 | 3.6 | 3.4 |
For any media enquiries please contact Oriana Kobelak at 416-982-8061
Disclaimer
This report is provided by TD Economics. It is for informational and educational purposes only as of the date of writing, and may not be appropriate for other purposes. The views and opinions expressed may change at any time based on market or other conditions and may not come to pass. This material is not intended to be relied upon as investment advice or recommendations, does not constitute a solicitation to buy or sell securities and should not be considered specific legal, investment or tax advice. The report does not provide material information about the business and affairs of TD Bank Group and the members of TD Economics are not spokespersons for TD Bank Group with respect to its business and affairs. The information contained in this report has been drawn from sources believed to be reliable, but is not guaranteed to be accurate or complete. This report contains economic analysis and views, including about future economic and financial markets performance. These are based on certain assumptions and other factors, and are subject to inherent risks and uncertainties. The actual outcome may be materially different. The Toronto-Dominion Bank and its affiliates and related entities that comprise the TD Bank Group are not liable for any errors or omissions in the information, analysis or views contained in this report, or for any loss or damage suffered.
Download
Share: