Highlights
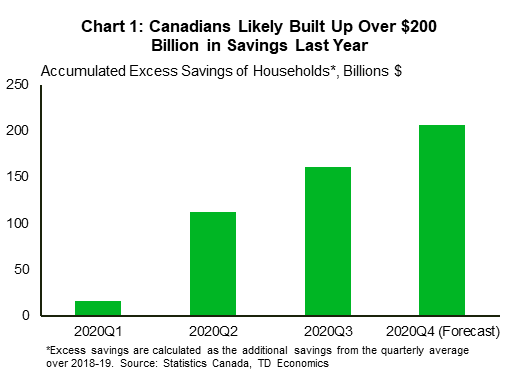
- As Canada gradually emerges out of the pandemic period, consumers have the potential to turbocharge the economic recovery. The household savings rate is well above pre-pandemic norms with an estimated $200 billion in excess savings through 2020.
- Consumers currently show a preference to pay down debt and maintain high savings. But, some of this preference will shift as restrictions loosen and job security solidifies. We expect consumer spending growth to rise by an average of 5% in 2021 and 2022. This has the potential to hit speeds of 7%-8% if households normalize spending-saving patterns faster than expected.
- The Bank of Canada has assumed a very gradual retreat of the savings rate, suggesting any unleashing of excess savings could expedite the exit from easy monetary policy.
After a year of having risks tilted uniquely to the downside on our forecasts, upside forces are finally appearing on the horizon. One area that offers tremendous possibilities is the consumer.
Our baseline forecast anticipates that households will deploy some of their savings, but ultimately maintain a savings rates roughly three times higher than their pre-crisis level at the end of 2022. However, if we are wrong and Canadians show greater initiative in dipping into their accumulated savings, consumption growth would be pumped up to 7% to 8% over 2021 and 2022. This is 2 to 3 percentage points higher than what we have incorporated in our baseline forecast.
The Bank of Canada’s Monetary Policy Report in January embedded a more conservative forecast assumption that consumers would remain firmly rooted in save-mode or debt-paydown-mode rather than spend-mode as restrictions ease. Any unleashing of excess savings could pull forward the timing of exiting from extremely stimulative monetary policy settings. The Bank’s current expectation of “sometime in 2023” reflects the timing in which economic slack is absorbed and inflation sustainably reaches the 2% target. This estimate is at least six months lagged relative to our baseline. There’s a lot that can change the timing of either of those estimates, including the possibility of stronger productivity growth exiting this pandemic cycle. However, the willingness of Canadian households to spend, be it on homes or vacations, has more consistently surprised to the upside relative to productivity. Like the rest of us, the Bank will be monitoring consumer indicators closely, and if risks skew to the upside, expect a change in tone sooner rather than later.
Canadians Saving More Because of the Pandemic
Canadians are saving at never-before-levels due to a combination of rising incomes and constrained spending. Some of this behaviour is no doubt precautionary. But, it’s reasonable to assume that ‘forced’ savings are also at play due to the current heavily restricted social and business environment.
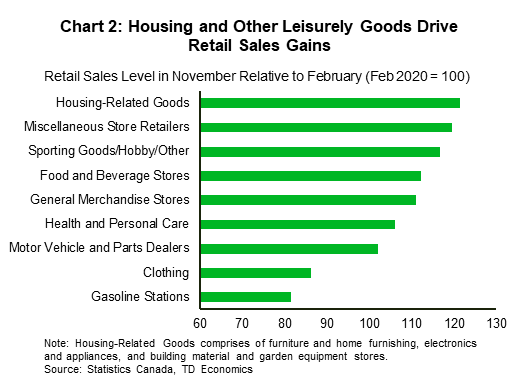
On the income side, despite employment still well below pre-pandemic levels, generous government programs and steady employment gains in higher paying sectors of the economy, have lifted income gains. By the third quarter, disposable income was 9% higher than what it was at the end of 2019. Meanwhile, health worries and business restrictions have combined to keep expenditure on high-touch services such as food and accommodation, travel and tourism, and other recreation services well below pre-pandemic levels. Although consumers have splurged in other areas, specifically housing-related goods and other leisurely items (Chart 2), this increase does not fully make up for lost spending on services. The household saving rate, which shot up to 27.5% in the second quarter, was since drawn down to 14.6% in the third quarter. But this compares to 2% at the end of 2019 and an average rate of 1.5% over the four years prior to the pandemic. We estimate that Canadians have amassed a little over $200 billion in excess savings in 2020.
Some households have put those savings towards paying down existing debt burdens. As we have written in a previous report, household debt was a key vulnerability for Canada entering the pandemic. However, the pandemic has created a unique opportunity for some Canadians to reduce credit balances. By the end of November, the balance on nonmortgage loans was 1.5% lower relative to February 2020. Despite this positive turn of events, the household debt overhang will remain high to close out 2020. This will be partly related to mortgage debt accumulation, with home purchases being prioritized across Canada.
Spending Could Ramp Up Coming Out of the Crisis
There is still reason to be cautious in the months ahead, due to the ongoing spread of the virus and slow vaccine rollout. Many business restrictions will likely need to remain in place for many more months to come, as detailed in our recent report that examined the vaccine experience of other countries. This will likely maintain a bias towards high savings and debt paydown in the near-term. However, the longevity of shutdowns can also create a stronger impulse from pent-up demand.
Having spent more than a year without access to social activities and high-touch services, consumers will be itching to have restrictions lifted, once it is safe to do so. This could spell a rapid increase in outlays, the likes of which has drawn parallels to the post World War 2 (WW2) period.
Minus the actual war, there are similarities between WW2 and the COVID-19 health crisis. For one, government spending rose dramatically during both periods. Federal government debt as a share of GDP increased by over 50 percentage points during WW2, while it is slated to rise by at least 20 percentage today. Naturally a key difference is that the spending was on investment in the war efforts back then, whereas it has primarily flowed to households this time. However, the post-war period still saw incomes boosted, in part by greater female participation in the labour market. This time, there’s more of an artificial effect from government supports, but this should naturally transition back to employment gains.
Both periods are also marked with pent-up demand. During WW2, households were restrained from purchasing many durable and luxury goods, as the country’s resources were deployed to support the troops. This time, consumers have been cut off from spending on services rather than goods. In 1946, the year after the war ended, consumption came roaring back, recording 11% growth, driven by a 105% surge in durable goods expenditure.
We doubt that consumption growth will pick up to the same extent as the post-war period since services offer less upside from pent-up demand relative to durable goods. In other words, if consumers forego spending on big ticket items such as cars now, they will still make the purchase in the future, whereas not going to a restaurant now, doesn’t necessarily mean a person will double-down to make up for all their lost experiences. In addition, the ending of the war was a more defined period, whereas the easing of pandemic restrictions will be gradual and spread over a longer period.
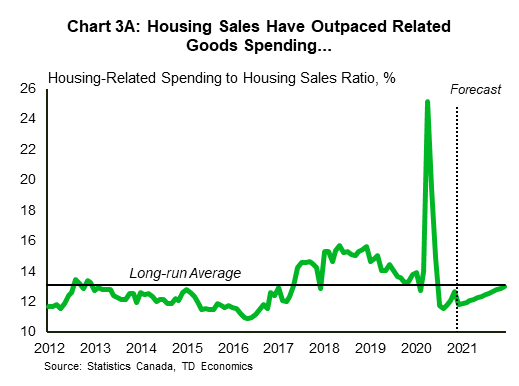
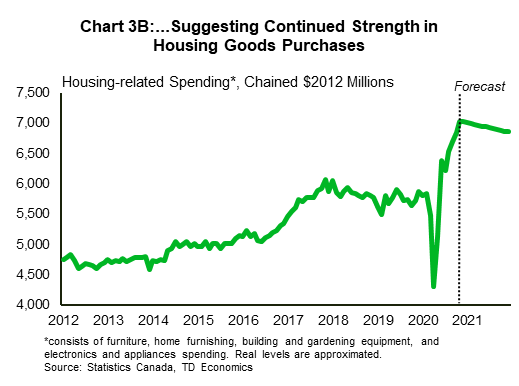
As that occurs, there is also likely to be some substitution in outlays away from goods purchases. For instance, people will ease off groceries and electronics in place of restaurants and vacations. But since consumers are saving at rates well above historical norms, they will be able to increase spending without fully compromising on other goods or services consumption. Moreover, goods expenditure could remain elevated due to continued strength in home sales activity. Typically, home sales and housing-related spending have moved in tandem. As people buy homes, they also spend more on furniture, appliances and building supplies. This is exemplified by the stable long-run ratio between housing-related spending and existing home sales (Chart 3A). However, beginning in 2019 and extending into the pandemic period, home sales outpaced housing-related spending, causing the ratio to fall below the mean last year.1 This might have been for several reasons, including hesitancy to undertake a renovation due to risks related to health security, or unpredictable government shutdowns of construction activity. Should the home sales-to-spend ratio return to its average, expenditure on housing-related goods would remain elevated over 2021 (Chart 3B).2
How Much to Spend and When? Questions for the Consumer
In all likelihood, consumers will loosen their purse strings as the vaccine rolls out and restrictions are lifted. The greater uncertainty really lies within the speed and magnitude of the ramp up. In its latest Monetary Policy Report, the Bank of Canada (BoC) projected that consumers will slowly normalize their savings rate, only returning to the historical mean by the end of 2023. In addition, the Bank assumed none of the $200 billion or so in excess savings would be used to finance additional goods or services consumption. We consider this a highly conservative assumption. In a recent poll conducted by Nanos Research Group, three out of four Canadians said their top financial priority is to pay down debt or build savings, but 11% said they plan to make a major purchase. And, as income and job security solidify with time, these preferences can quickly change.
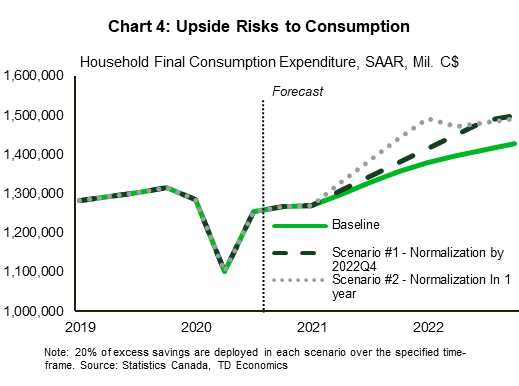
In our baseline household consumption forecast, we too embed a very gradual normalization of the savings rate and that households will draw down 10% of their excess savings for consumption purposes over the next two years (Chart 4). With this, the savings rate remains elevated at 6.3% by the fourth quarter of 2022, compared to averaging 1.4% in 2019. Consumption growth averages roughly 5% this year and next.
To demonstrate the spending-potential, we consider two scenarios that embed a faster normalization of the savings rate. In Scenario #1, we assume consumers return to pre-pandemic spending-saving patterns by 2022Q4 and deploy 20% of their accumulated savings by then.3 And in Scenario #2, we incorporate a savings rate normalization over one year and also assume 20% of the excess savings will be spent over that same period.
Both scenarios provide tremendous upside for household spending in 2021 and 2022 (Table 1). Compared to our baseline, consumption growth could be 2 to 3 percentage points higher on average over the next two years, turbocharging Canada’s economic recovery. While we do not expect this to happen, it is in the realm of possibilities if vaccines are successful in diminishing health concerns, and restrictions are largely lifted across industries.
Table 1: Real Consumption Growth (%)
| PCE Scenarios | 2021 | 2022 |
|---|---|---|
| Baseline | 5.4 | 4.4 |
| Scenario #1 | 6.2 | 7.8 |
| Scenario #2 | 8.7 | 7.0 |
Bank of Canada Monitoring the Situation
Yet another factor that could add steam to Canada’s recovery is fiscal stimulus. The federal government left $70-$100 billion in funding unaccounted for in last year’s Fall Economic Statement (FES) to aid the recovery. But due to the lack of details, we did not embed this into our baseline forecast. If included, depending on the type of spending, this could provide a sizeable boost to the economy, possibly leading to a faster absorption of excess capacity. Indeed, the economy could be back to its economic potential in early-2022 rather than later in the year, as we currently expect.
The Bank of Canada, on the other hand, sees economic slack being absorbed “sometime in 2023” even with $70 billion in fiscal stimulus embedded in its projection. But as noted earlier, it does not expect consumers to dip into their accumulated savings to finance spending in the future. Nor has it yet incorporated additional fiscal stimulus that will be accelerating growth south of the border. Specifically, the Biden Administration’s $1.9 trillion spending package is an upside risk to Canadian economic activity in the Bank’s January projections. Assuming the bill is enacted in large part, which appears to be very likely, U.S. growth could be 6% this year (see report) and Canada would benefit through the traditional export channel.
The materialization of one or both of these risks could end up altering the Bank’s forward guidance and, by extension, pull forward the timing of the rate hike cycle. In the base case, we estimate that period is most likely in the second half of 2023. The Bank will probably wait to see sustained signs of rising inflationary pressures before adjusting guidance. If evidence of a sturdier recovery starts building, expect shifts in tone to come sooner rather than later.
End Notes
- April 2020 was an outlier as lockdowns hit home sales particularly hard.
- Underlying this analysis is the assumption that home sales ease off their recent highs through 2021.
- In this scenario, the ratio between nominal consumption and disposable income in 2022Q4 is equal to what was observed in 2019Q4, excluding the impact of the spending financed by excess savings.
Disclaimer
This report is provided by TD Economics. It is for informational and educational purposes only as of the date of writing, and may not be appropriate for other purposes. The views and opinions expressed may change at any time based on market or other conditions and may not come to pass. This material is not intended to be relied upon as investment advice or recommendations, does not constitute a solicitation to buy or sell securities and should not be considered specific legal, investment or tax advice. The report does not provide material information about the business and affairs of TD Bank Group and the members of TD Economics are not spokespersons for TD Bank Group with respect to its business and affairs. The information contained in this report has been drawn from sources believed to be reliable, but is not guaranteed to be accurate or complete. This report contains economic analysis and views, including about future economic and financial markets performance. These are based on certain assumptions and other factors, and are subject to inherent risks and uncertainties. The actual outcome may be materially different. The Toronto-Dominion Bank and its affiliates and related entities that comprise the TD Bank Group are not liable for any errors or omissions in the information, analysis or views contained in this report, or for any loss or damage suffered.
Download
Share: