2026 Spring Economic Update
Smaller Deficit This Year, But Windfall Doesn’t Last
Date Published: April 28, 2026
- Category:
- Canada
- Government Finance & Policy
Highlights
- Government books look better than expected to end 2025-2026, with the deficit expected to be $11.4 billion smaller than expected. However, much of the windfall will be spent over the budget horizon.
- The update committed to $37.5 billion in new spending over six years, but much of it was accounted for by previously announced measures, including the enhanced GST rebate, the gas tax holiday and the electric vehicle rebate. New spending measures include $6 billion to expand skilled trades and the announcement of a new sovereign wealth fund.
- Overall, the slightly better near-term deficit leads to a slightly lower trajectory for the federal debt burden. However, debt servicing costs still rise through the budget horizon.
- Zooming out, measures in this update are fairly limited, as befits an “update”. The economic impacts are also likely to be limited, with the deficit trajectory beyond 2025-26 little changed. A deeper assessment of the new Canada Strong Fund awaits clarity on many unanswered questions.
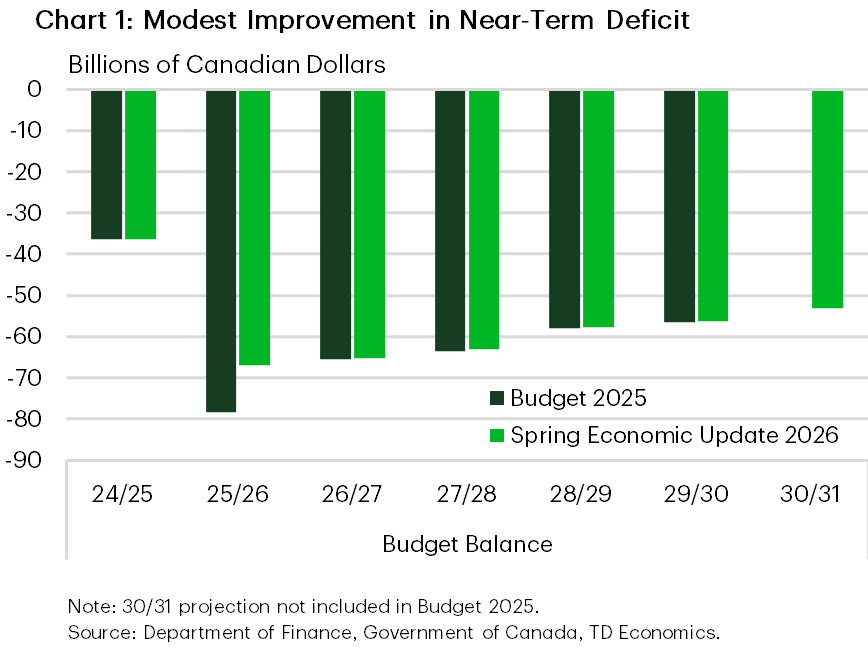
After months of deficit figures coming in lighter than expected, the Spring Economic Update showed a deficit of $66.9 billion in fiscal 2025-26 versus the $78.3 billion expected in Budget 2025 (B25). Beyond the better-than-expected starting point, the remainder of the fiscal projection is virtually unchanged with total deficits through 2029-2030 totaling $243.4 billion, versus $242.3 billion in the Budget (Chart 1).
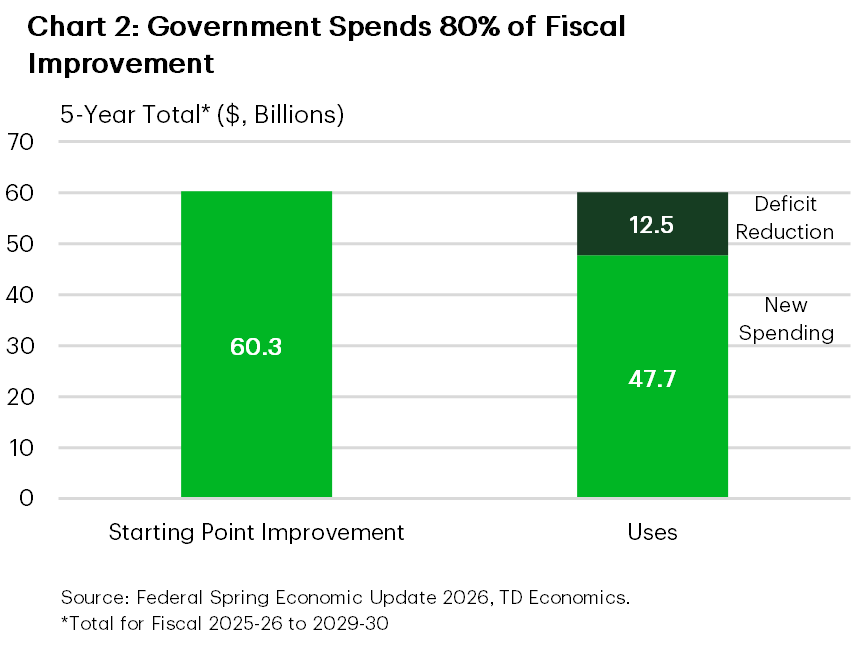
Economic and fiscal developments helped generate savings of $60.3 billion over the budget horizon. The outlook for real GDP growth was little changed since Budget 2025, but with the economy expected to be $46 billion dollars bigger in 2026, and the unemployment rate lower in 2026 (6.5% vs. 6.8% previously) and 2027 (6.2% vs. 6.4%) the revenue and expense lines both improved. The better near-term economic picture means the bulk of the fiscal benefits are front-loaded with a $17.7 billion improvement in 2025-26 powered by stronger-than-expected personal and corporate tax revenues (+$6.8 billion). Over the fiscal horizon, income tax revenues were revised higher by an average of $8.6 billion annually. Expenses were also reduced by $10.7 billion in 2025-26, though part of that includes the end of the pollution pricing scheme.
Despite the improved starting point, new initiatives are expected to cost $47.7 billion through 2029-30, about 80% of the projected savings (Chart 2). When netted off the projected savings, this leaves the expected budget deficit in 2029-30 at $56.2 billion, virtually unchanged from the $56.6 billion expected in November.
The budget deficit at that time is still expected to be 1.5% of GDP, with a 1.4% expectation now for 2030-2031. However, with the better-than-expected starting point for the economy (GDP in 2026 roughly 1.4% bigger than expected), the trajectory for the federal debt burden is lower. It now peaks at 41.9% in 2028-2029 versus 43.3% in B25, and reaches 41.8% in 2029-30 versus 43.1% in B25. Ultimately, the debt burden is again expected to essentially level off in the outer years of the fiscal horizon, similar to what was in B25.
In terms of the fiscal targets, the deficit-to-GDP ratio again declines over the forecast horizon, while the day-to-day operating balance is expected to show a $33.0 billion deficit in 2025-26 (previously $26.4 billion), and gradually returns to surplus by 2028-29. Lower borrowing requirements also reduce the projected public debt charges over the next two years. However, public debt charges still rise from 1.7% of GDP in the outgoing fiscal year to 2.1% in 2030-31 as longer-term interest rate forecasts were revised higher.
However, the economic outlook is highly uncertain, so the Spring Economic Update provided two scenarios to accompany the baseline outlook, tracing out the potential impacts of two alternative oil price trajectories. Importantly, these scenarios are not incorporated formally into the fiscal framework, so they are merely illustrative.
In the slower growth scenario, the budget deficit in 2027-28 would widen to $65.3 billion dollars (above the current $63.1 projection), while the alternative scenario would result in a $57.7 billion deficit. Ultimately, however, the impacts on the federal debt-to-GDP ratio are relatively small by the outer years. In the slower growth 42.1% by 2029-30, compared to 41.8% in the baseline and 41.1% in the higher growth scenario.
More Details For Some Measures, More Questions For Others
SEU 2026 largely adds details to programs announced in Budget 2025. These include more detail on the $51 billion Build Communities Strong Fund, updates on the now $125 billion in capital commitments under the Major Projects Office, the Defense Industrial Strategy and Defence Investment Agency, among others.
The update also commits to $37.5 billion in new spending over 5 years. Much of this was previously announced. The updated GST rebate, now called the Canada Groceries and Essentials Benefit, which increases the amount of the rebate by 25% for the next 5 years, will cost government $11.8 billion. The gas tax cut will cost $2.4 billion in fiscal 2026-27, while the electric vehicle affordability program announced as part of the revised Auto Strategy will cost $2.3 billion.
The SEU also made good on a commitment made in the Canada-Alberta Memorandum of Understanding to allow the carbon capture utilization and sequestration (CCUS) tax credit to be used for enhanced oil recovery. Notably, this was booked as a net negative on spending due to higher expected tax revenues.
One new spending measure is financial support to attract workers to the skilled trades. The government is aiming to attract 80,000-100,000 new red seal trades by 2030-31 to support infrastructure, manufacturing, mining, defence, and energy projects. This is being done through a $6 billion program aimed at subsidizing job placements/apprenticeships, education grants, and income supports.
The biggest splash was Monday’s announcement of the Canada Strong Fund – the Prime Minister’s new sovereign wealth fund. With an initial seeding of $25 billion over three years, the fund will take equity positions in domestic infrastructure, energy, advanced manufacturing and other areas, with a mandate to deliver “market-rate returns” for Canadians. The SEU unfortunately leaves more questions on this than answers. The arms-length, independent crown corporation will have a way in which retail investors can contribute to the fund to receive a bond-like instrument where the initial investment is protected while still benefiting from any positive returns. In fact, on top of the original seed capital, the only other ways in which the fund grows is through retail contributions, re-invested returns, and through a conspicuous, but little-discussed reference to “generating full value from federal assets”, which we take to mean asset sales (with the update mentioning airports in a different section).
Questions Remain on the Canada Strong Fund:
- Initial deal flow is simply the Major Projects Office list, which government is already invested in through direct funding. Does government feel the need to take an additional equity stake because the capital stack is insufficient to get these projects across the finish line? Or does government intend on taking advantage of the revenue potential of these projects to benefit Canadians?
- How does government expand on that deal flow while balancing the protection of retail contributions without any foreign exposure?
- How does the Canada Strong Fund staff up? Prime Minister Carney has had little trouble filling cabinet with heavy hitters in the finance world, yet challenges filling these very similar roles plagued the inception of the Canada Infrastructure Bank less than 10 years ago.
- How does the Canada Strong Fund’s mandate differ from numerous other crown corporations, agencies, and initiatives that are aimed at similar objectives? These include the Infrastructure Bank, Infrastructure Canada, the Business Development Bank, Export Development Canada, the Canada Development Investment Corporation, among many others. All of these initiatives/organizations have some overlapping mandate to invest in infrastructure, start-ups, high-growth firms and fill some gap in the capital stack.
Tables
Table 1: Spring Economic Update 2026 - Summary
[Billions of Dollars, unless otherwise stated]
| Fiscal Year | 24-25 | 25-26 | 26-27 | 27-28 | 28-29 | 29-30 | 30-31 |
| Budgetary Revenues | 511.0 | 511.5 | 529.6 | 546.8 | 565.9 | 589.8 | 613.7 |
| Program Expenses | 489.9 | 512.8 | 536.1 | 543.9 | 555.9 | 575.4 | 591.6 |
| Public Debt Charges | 53.4 | 54.0 | 58.7 | 65.7 | 71.6 | 75.7 | 80.9 |
| Total Expenditures | 543.3 | 566.8 | 594.8 | 609.6 | 627.5 | 651.1 | 672.5 |
| Budgetary Balance Before Net Actuarial Losses | -32.3 | -55.3 | -65.2 | -62.8 | -61.6 | -61.3 | -58.8 |
| Budget Balance | -36.3 | -66.9 | -65.3 | -63.1 | -57.7 | -56.2 | -53.2 |
| Per Cent of GDP | |||||||
| Budgetary Revenues | 16.4 | 15.8 | 15.7 | 15.6 | 15.6 | 15.6 | 15.7 |
| Program Expenses | 15.8 | 15.8 | 15.9 | 15.6 | 15.3 | 15.3 | 15.1 |
| Public Debt Charges | 1.7 | 1.7 | 1.7 | 1.9 | 2.0 | 2.0 | 2.1 |
| Budget Balance | -1.2 | -2.1 | -1.9 | -1.8 | -1.6 | -1.5 | -1.4 |
| Federal Debt | 40.7 | 41.1 | 41.5 | 41.8 | 41.9 | 41.8 | 41.6 |
Disclaimer
This report is provided by TD Economics. It is for informational and educational purposes only as of the date of writing, and may not be appropriate for other purposes. The views and opinions expressed may change at any time based on market or other conditions and may not come to pass. This material is not intended to be relied upon as investment advice or recommendations, does not constitute a solicitation to buy or sell securities and should not be considered specific legal, investment or tax advice. The report does not provide material information about the business and affairs of TD Bank Group and the members of TD Economics are not spokespersons for TD Bank Group with respect to its business and affairs. The information contained in this report has been drawn from sources believed to be reliable, but is not guaranteed to be accurate or complete. This report contains economic analysis and views, including about future economic and financial markets performance. These are based on certain assumptions and other factors, and are subject to inherent risks and uncertainties. The actual outcome may be materially different. The Toronto-Dominion Bank and its affiliates and related entities that comprise the TD Bank Group are not liable for any errors or omissions in the information, analysis or views contained in this report, or for any loss or damage suffered.