Highlights
- Despite optimism around Prime Minister Carney’s investments in affordable housing, infrastructure and efforts to diversify trade, missing from this government’s competitiveness agenda is an in-depth discussion on the barriers to productivity growth due to Canada’s tax and regulatory regime.
- These have been long cited by industry leaders as a key barrier to investment, an area that Canada has lagged international peers in the last 5 years.
- Past efforts of tax and regulation reform have failed to meaningfully reduce compliance burdens and promote economic and business dynamism – a must to seriously address the root causes of Canada’s ailing productivity.
- Competitiveness is a necessary ingredient for success across the entire spectrum of economic agents – a competitive workforce needs competitive employers. This cannot occur absent a competitive system of infrastructure, regulation and taxes to support growth.
Prime Minister Carney has unveiled a sweeping economic agenda aimed at revitalizing Canada’s competitiveness in the face of geopolitical uncertainty and deteriorating trade relations with the United States. Although his platform and more recent speeches ahead of the budget include bold initiatives – including $14 billion in establishing a dedicated federal homebuilding agency, fast-tracking and funding for major mining, energy and infrastructure projects, reducing government expenses, and even references to lowering statutory tax rates – it still does not address the fundamental lack of motivation for businesses to invest in Canada. Consistent under-investment relative to international peers has led to a widening gap in capital per worker, which is ultimately driving the weak productivity growth that Bank of Canada senior deputy governor Rogers called ‘an emergency’.
Numerous sources indicate that business leaders in Canada cite the suite of tax and regulatory compliance as two of the largest barriers to investment. Most metrics around top marginal tax rates or regulatory burden rank Canada below the middle of the pack. This relative ranking even overstates Canada’s position because problems have been papered over due to the economic benefits derived from the vertical integration and high dependence on U.S. growth drivers – something that can no longer be relied upon.
Understanding that all levels of government contribute to this problem, Canada needs leadership from the federal government, and the country’s track record on tax and regulatory reform, like many other countries, leaves much to be desired. The last attempt at tax reform occurred in the 1960’s, with a half-measure on business taxation in the late 1990’s. Despite some minimal progress with the latter, Canada did not move the needle on competitiveness and investment. And in recent years, the country has fallen behind even further.
Focusing on regulatory reform is positive but not likely to be enough to shed a long legacy of layers and complexity that has led to a reputation as a ‘difficult place to do business’.
Where Canada stands
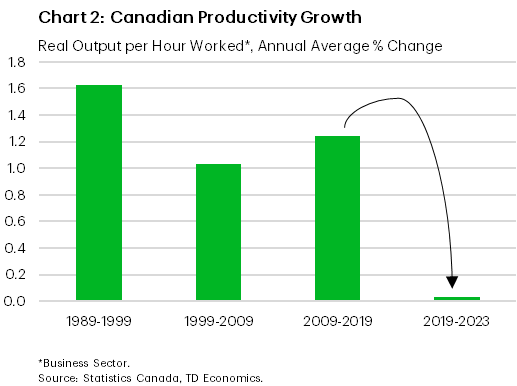
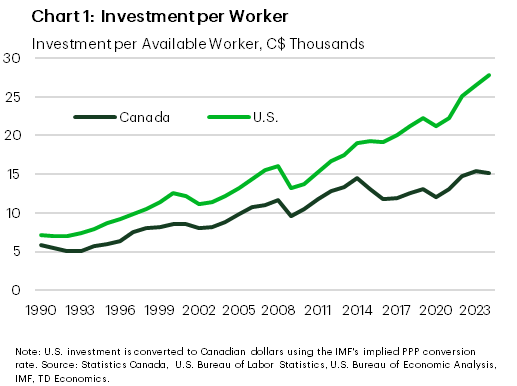
Competitiveness problems, particularly in the last 5 years, have been well-documented, including by TD Economics. For starters, Canada’s capital deepening has never recovered from the oil price crash in 2014 and has been stagnant since 2019. Insufficient investment limits the ability of Canadian firms to scale and compete globally. Compared to other OECD countries, Canada’s investment per worker ranks near the bottom, reflecting systemic issues in the business environment1. And the gap relative to the U.S. has widened out significantly since 2010 (Chart 1). Particularly in the last 5 years, this underperformance has contributed to the abysmal decline in productivity growth, measured by output per hour worked (Chart 2).
Potential factors contributing to this trend touch every part of the economy, from insufficient venture and patient capital to trade infrastructure gaps to internal trade barriers to poor commercialization of R&D within the post-secondary education sector. It extends all the way to firms lacking opportunities to scale due to a small, geographically dispersed domestic market. The tax and regulatory compliance burden typically place high on that list of barriers. A recent KPMG survey suggested that 58% of business leaders identified comprehensive tax reform as a priority in addressing business competitiveness2.
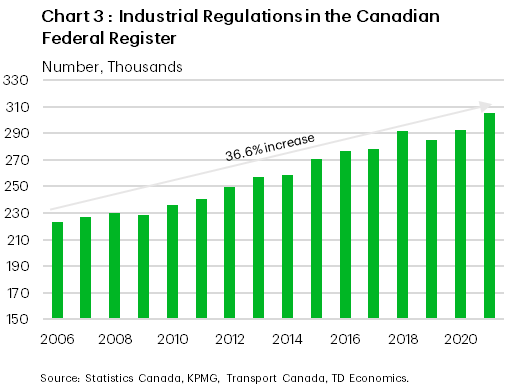
Data substantiating the size and stringency of the tax and regulatory burden are difficult to establish given the hazy nature of time and money spent on compliance costs and the irrelevance of older regulations for which compliance may not be necessary. However, one interesting study from a Transport Canada-KPMG collaboration captured the far-reaching scope of regulation. It logged all individual industrial and ministerial regulations in the Federal Register, tracking some 321,000 individual regulations. Of those, 305,500 applied to industry – a number which has increased by 36.6% between 2006 and 2021 (Chart 3).
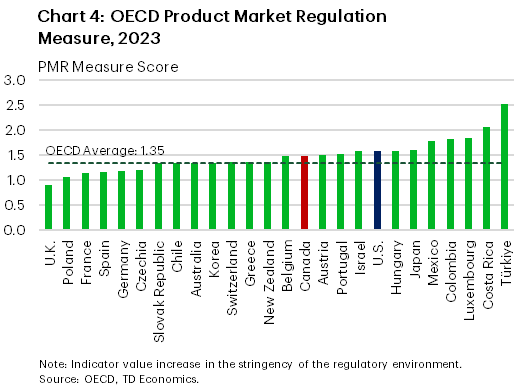
On regulatory stringency, Canada ranks poorly in the OECD’s Product Market Regulation measure at 26th out of 38 (Chart 4). This is driven mainly by the distortionary impact of public ownership in particular sectors and barriers to foreign investment3. While Canada notably outranks the U.S., the difference in investment performance in chart 1 drives home the point that U.S. firms are willing to make the investment in navigating the system, or even leveraging advantageous tax structures, as access to the U.S.’ sheer market size is worth the price of entry. Canada does not share this advantage, meaning a more pragmatic lens on regulation is needed.
Moreover, the OECD PMR statistics provide little insight into the ‘how’ or ‘why’ the regulatory burden acts as a barrier to business dynamism or new investment. But there can be no doubt that without addressing this issue, Canada will continue to find difficulty in attracting investment from either domestic or foreign multinationals, promote businesses to successfully reduce reliance on the U.S. and find a footing in raising productivity growth. Unfortunately, Canada (alongside the rest of the world) has a weak track record at addressing either tax or regulatory reform.
How to Fix a Problem like Tax Reform?
On tax reform, Canada’s last major attempt occurred over six decades ago when accountant Kenneth Carter was tasked by Prime Minister Diefenbaker with addressing fairness issues in the tax system. Between 1962 and 1966, the Royal Commission on Taxation set out a series of taxation principles that are still held up today as a model for Canada’s tax system. What ultimately came out of the commission’s work was anything but simple. It was not implemented until six years later by Prime Minister Pierre Trudeau who adopted only some of its recommendations, notably introducing the capital gains tax. The political backlash was so great that to soften the blow, Trudeau’s tax bill limited capital gains inclusion to 50%, exempted principal residences, while also lowering the top marginal personal income tax rate by over 20 percentage points and eliminating inheritance taxes.
There are two important lessons from that moment in history. First, the Carter Commission was not done with the lens of enhancing Canada’s competitiveness to attract foreign investment, facilitate firms to scale up to compete globally, or to attract and retain in-demand talent. It was done through a narrow lens of “tax fairness” and the philosophy that underpins that view. The commission’s work subsequently birthed the adage, “a dollar is a dollar is a dollar”. By referencing all the various ways Canadians can generate income, whether from employment, investments, or business, it deems all should be treated equally by the tax system. However, businesses and talent do not live in a Canadian ideological vacuum. That lens failed to appreciate the global movement of capital and people, and the speed at which a digital economy has altered the advantages of being on the technological frontier. All have been amplified since the 1960’s. This is not your grandparents economy anymore.
The commission’s recommendations were then further watered down and made less efficient from a policy perspective because tax reform is inherently a politically divisive process. Unless program spending or operational expenses are cut, it is the government deciding whose taxes go up and whose go down. No government wants to pull on that thread. In practice, incremental changes are made that achieve small objectives for a select group, often with social intentions. Common examples include supporting families with young children, small businesses, or struggling industries. This is typically achieved through tax credits or new or increased transfer payments, resulting in only a small impact on compliance and complexity.
But reducing taxes for one group of Canadians comes at the expense of another and those small impacts add-up over time. Decades of governments of all stripes have added to the Income Tax Act, leaving the country with a piece of legislation that is 3,690 pages long! Little wonder tax compliance is so costly.
So that’s the starting point that Prime Minister Carney faces.
I have Confidence in…the Objective
Tax reform efforts in Canada and globally try to avoid this kind of political wrangling by focusing on two core principles: low rates and a broad tax base. This means minimizing tax expenditures and transfers to special interests and finding the balance in rates that will support necessary government spending. This was a core principle in the Carter Commission in the 1960’s, but also more recently as well. The Henry Tax Review in Australia and Mirrlees Review in the United Kingdom, both of which occurred in 2010, were also grounded in the same academic take.
But that does little to avoid the quagmire because having a “broad base” implies eliminating tax breaks or transfers to special interest groups (businesses and individuals) and raising the effective tax rate of those impacted. These efforts receive little support because the objective itself is difficult to understand to the average taxpayer. Tax reviews with an inward view on fairness suffer from this give-and-take approach of favouring one group over another which ultimately yields little public support.
Instead, Canada’s tax reform efforts need to have a stronger purpose that Canadians can rally behind. That should be based on the same core principles, but with one eye also on global competitiveness as a north star. No country exists within a vacuum and cannot thrive without a competitive edge.
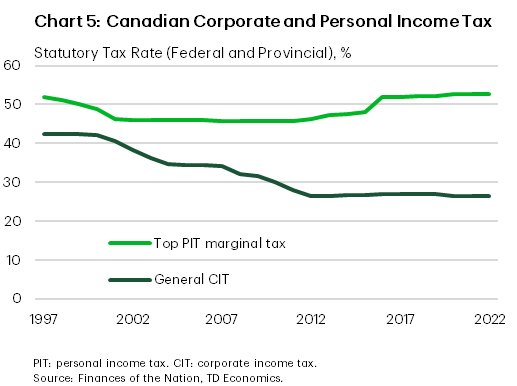
Canada did have one more kick at the can at a competitiveness-oriented tax review in the form of the 1997 technical review on business taxation led by prominent economist Jack Mintz. Over time, some elements of that report filtered into policymaking, notably focusing on marginal effective tax rates on new business investment and lowering statutory corporate tax rates (Chart 5). Business-friendly tax policies became a tentpole issue from successive Liberal and Conservative governments. But the spirit of the Mintz report was lost – a lowering in rates, in combination with eliminating tax expenditures, broadening the tax base and simplifying the tax code.
Canada was thus able to maintain its competitiveness over time relative to peers through the lens of statutory rate comparisons. But without reconsidering the bevy of tax expenditures already in place, interactions with the personal income tax side, and compliance rules, there was no change to the administrative burden and Canada failed to gain headway on competitiveness relative to other jurisdictions.
How do we strike the right balance on incentives?
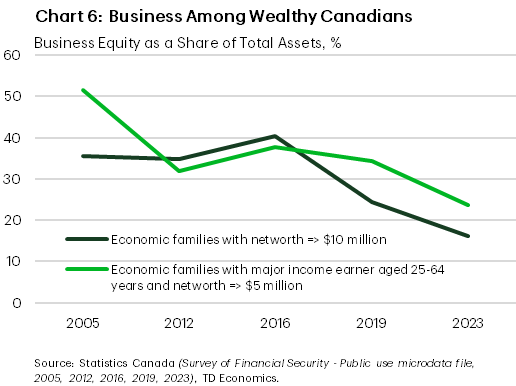
The signs are everywhere that the tax system is not incentivizing the outcomes that would evidence a strong, competitive economy – namely, the ability to attract top talent and entrepreneurs, excel in business dynamism and succeed in the scaling and commercialization of research and innovation. Data from the Survey of Financial Security show a consistent decline in the share of business assets held by wealthier Canadians. Between 2016 and 2023, the business equity share of total assets held by households with net worth above $10 million fell from 40.3% to just 16.2%. Numerous factors could be contributing to that decline – such as, an aging population shedding business assets in retirement, rapidly rising real estate valuations, or consolidation in the corporate sector. But business valuations for top firms globally have more than kept pace with other assets. And even if we broaden the scope to include less-wealthy households and hone in on only those individuals between the ages of 25-64, the trend remains the same (Chart 6). The business equity share of total assets has fallen from 37.7% to 25.3% between 2016 and 2023. This data suggests that Canadians are relying less and less on business growth to drive personal wealth gains raising some questions about its sustainability.
A long list of Canadian policy research suggests that the tax system is aimed in the wrong direction in supporting businesses. Rather than incentivizing firm creation, the process of creative destruction and supporting those businesses through their growth cycle, policies like the Small Business Deduction (SBD) and the Scientific Research & Experimental Development (SR&ED) Credit tend to result in a clustering of businesses around asset thresholds due to the phaseout of benefits as success is realized. This causes high marginal tax rates at key growth points in business assets.
Recent research4 suggests that the phaseout thresholds are high enough to not inhibit investment decisions, however the net benefit of these programs is specious given that a wealth of research suggests most of the public dollars spent are going towards small businesses that do not necessarily add to the productivity picture. Our previous research has noted that less than half of small businesses with less than 20 employees tend to adopt new technology in a given year relative to their larger counterparts5. Meanwhile, the 1997 technical report6 noted that over 60% of the total SBD claimed went to small firms that were over 10 years old.
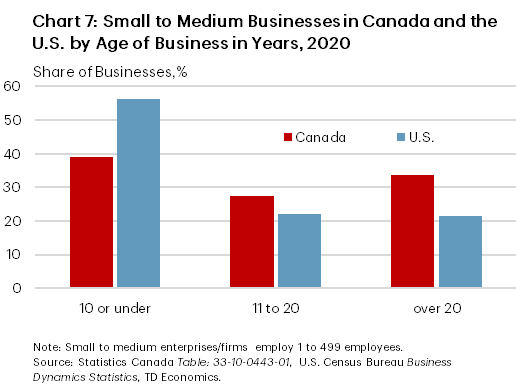
Here’s the problem with that. In a C.D. Howe report, newly-minted Nobel laureate Peter Howitt stated that Canada’s tax system is designed to support small firms, not new firms, which are more likely to adopt new technology and displace incumbents in high-growth sectors7. Indeed, data show that the share of small and medium-sized enterprises (SMEs) in Canada that are old is far higher than in the U.S. Firms employing less than 500 people under 10 years of age account for 56%of all SMEs in the U.S. versus just 39% in Canada (Chart 7). Going back to reviewing the principle of why a government would put in place a favourable tax policy, is it the intention to maintain and support existing small businesses or to help them grow into medium and larger sized businesses? Businesses that engage in creative destruction and promote productivity growth are defined as “young”, which necessarily makes them small. But the mere existence of being small doesn’t hit the mark.
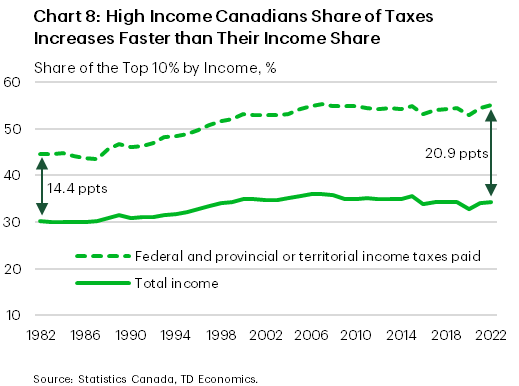
Canada’s ability to attract top talent is equally tenuous. Canada has done a much better job at keeping inequality in check. The top 1% income share peaked in 2006 and has declined since then, from 12.1% at the time, to 10.2% in 2022. Similarly, the income share held by the top 10% fell from 36.1% to 34.3% over the same period. However, the share income taxes paid by high-income earners has not declined in the same way, remaining consistent over time (Chart 8). This results in the gap between the share income earned and the share of income taxes paid having increased for the top 10% of earners from 14.4% in 1982 to 18.7% in 2006 when income shares peaked, to 21% as of 2022.
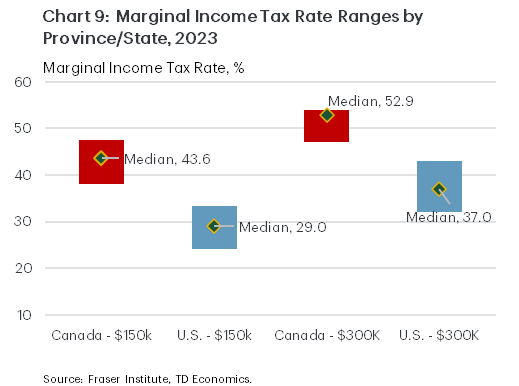
Whether you’re of the view that income taxes paid by the highest earners should be lower or higher, that ideology cannot live in exclusion of reality. Canada is not an island. In the global war for top talent in emerging and high-growth industries, the question is how Canada finds the right balance in ensuring everyone pays their fair share while still being able to attract those that would drive economic and productivity growth – particularly if individuals benefit from a higher financial return elsewhere (Chart 9).
Track record on regulatory reform equally bad
Canada has seen many efforts over the last two decades on reducing regulatory burden at both the provincial and federal levels, with mixed success. The federal government alongside the provinces have either identified red tape reduction as an administrative priority or have legislation in place to formally eliminate regulations. Federally, the government passed Canada’s Red Tape Reduction Act (RTRA) in 2015 which, like many provinces, established a one-for-one rule – each new regulation must be accompanied by a commensurate reduction somewhere else. The RTRA has since evolved into a formal red tape reduction office under the Treasury Board Secretariat, but its efforts to reduce regulation have had middling-to-no-success over the last decade.
In a series of public consultations held in 2019 on regulatory modernization8, industry stakeholders indicated that the Red Tape Reduction Act made “little to no impact on reducing regulatory burden”. This is partly due to the exception embedded in the 2015 legislation for tax compliance and departmental rules and guidance. The one-for-one rule also allows government to identify defunct rules that no longer apply any administrative burden as eligible for elimination. While this is technically important to reduce the headline regulatory count and redundancy, these are not the binding constraints that cost firms time and money and are not in the spirit of trying to improve the ease of doing business. The hope is that the RTRO will be more effective in the future having learned from past efforts.
Doing what we have always done is not good enough
We are now at a moment in time where we can no longer ignore the competitiveness costs related to tax and regulatory burden. Canada needs to treat the plummet in business investment with the same urgency it treats other crises and address all contributing factors. Tax reform and reducing regulation may not resonate with as many Canadians as trade threats and housing affordability, but they have been the ‘death by a thousand cuts’ that have left the country with a reputation as a less favourable place to invest that inhibits firm formations, innovation scalers and productivity growth. Competitiveness is a necessary ingredient for success across the entire spectrum of economic agents – a competitive workforce needs competitive employers. This cannot occur absent a competitive system of infrastructure, regulation and taxes to support growth.
Tax reform must consider the entire system with the goal of broadening the tax base while lowering statutory rates. Regulatory reviews should only consider rules and compliance that are shown to be binding constraints on costs along with eliminating exemptions for departmental guidance and tax compliance. This is a turning point in Canada’s history – let’s not waste that opportunity by sidestepping real barriers just because gaining broad support is difficult. Workers are no more secure in their jobs. Real median household income has grown less than a percentage point on average annually since 2008, and the country has seen a shrinking base of global champions among businesses. Governments must make the connection for all Canadians, including workers and businesses that Canada’s declining competitiveness cannot continue and that difficult decisions need to be made.
End Notes
- https://www.oecd.org/en/publications/2025/05/oecd-economic-surveys-canada-2025_ee18a269/full-report/raising-business-sector-productivity_443bcd88.html
- https://kpmg.com/ca/en/home/media/press-releases/2025/06/businesses-want-more-competitive-taxes-to-invest.html#survey
- https://www.oecd.org/content/dam/oecd/en/topics/policy-sub-issues/product-market-regulation/Canada_PMR%20country%20note.pdf
- https://cdhowe.org/wp-content/uploads/2024/06/Commentary_426.pdf
- https://economics.td.com/ca-small-business-health
- https://webarchiveweb.wayback.bac-lac.canada.ca/web/20071205172000/http://www.fin.gc.ca/taxstudy/wp97-11e.pdf
- https://cdhowe.org/wp-content/uploads/2024/06/Commentary_433.pdf
- https://www.canada.ca/en/government/system/laws/developing-improving-federal-regulations/regulatory-evaluation-results/what-we-heard-report-regulatory-modernization.html
Disclaimer
This report is provided by TD Economics. It is for informational and educational purposes only as of the date of writing, and may not be appropriate for other purposes. The views and opinions expressed may change at any time based on market or other conditions and may not come to pass. This material is not intended to be relied upon as investment advice or recommendations, does not constitute a solicitation to buy or sell securities and should not be considered specific legal, investment or tax advice. The report does not provide material information about the business and affairs of TD Bank Group and the members of TD Economics are not spokespersons for TD Bank Group with respect to its business and affairs. The information contained in this report has been drawn from sources believed to be reliable, but is not guaranteed to be accurate or complete. This report contains economic analysis and views, including about future economic and financial markets performance. These are based on certain assumptions and other factors, and are subject to inherent risks and uncertainties. The actual outcome may be materially different. The Toronto-Dominion Bank and its affiliates and related entities that comprise the TD Bank Group are not liable for any errors or omissions in the information, analysis or views contained in this report, or for any loss or damage suffered.
Download
Share: