Highlights
- If Canada does not play to win on labour productivity, it risks a continued drop in living standards, worsening wage stagnation and a dangerous deterioration in public services.
- The pronounced downshift in labour productivity since the pandemic has manifested in most industries.
- The goods-producing sector accounts for the lion’s share. In a turn of fortune, a decade-long outperformance in productivity is now marred by a 1.2% average annual decline since 2019. More goods sector workers are required just to produce the same level of output.
- Among industries, construction is the worst of the lot with labour productivity at a near 30-year low.
- Construction’s deepening presence will keep Canada on its backfoot relative to peers in the absence of greater innovation adoption and a reshaping of the industry.
- Canada’s service sector has also slowed, but to a lesser degree. Compared to the U.S., most major industries severely lag.
Hearing the word, productivity, often brings to mind a negative image of accomplishing more work with less people. It’s a hard sell for policymakers to get Canadians fired up on the concept, let alone to make the necessary financial sacrifices and policy adjustments toward solutions. Yet, healthy growth in productivity is key to a dynamic, prosperous, and resilient society. Productivity improvements drive real wage growth and are essential to maintaining quality public services.
So the fact that Canada’s performance has deteriorated so materially since the pandemic should be of grave concern to all Canadians, particularly younger generations. Canadian’s standard of living, as measured by real GDP per person, was lower in 2023 than in 2014. Without improved productivity growth, workers will face stagnating wages and government revenues will not keep pace with spending commitments, requiring higher taxes or reduced public services.
So what ails Canada?
Over the decade prior to the pandemic, business sector productivity grew by a respectable rate of 1.2% annually (Chart 1). Since 2019, it has ceased to expand at all, setting Canada apart as one of the worst performing advanced economies, not to mention in stark contrast to the United States (see earlier report).
We wish we could tell you that only a single or handful of industries are the culprit. However, the woes are widespread. Relative to growth in the decade prior the pandemic, only a few service industries have managed to improve their performance. Those working in the goods sectors have felt the downshift the most, where productivity has gone in reverse in the years since the pandemic. What does that mean? To get the same output, it now requires more hours from workers. Hard to believe this could occur in a digital age.
There is one sector in Canada that wears the Scarlet Letter more prominently than the others: construction. Due to its increasing size within the economy, its declining productivity has been an increasingly important source of overall weakness.
Among service-producing industries, most have experienced a productivity slowdown since the pandemic, but not as severe. Still, when compared to the U.S., stark differences occur in key service industries.
There is no silver bullet to fixing Canada’s productivity woes because the underperformance has become so pervasive. The often-cited solutions are intuitive but elusive for Canada: fostering competition, retaining skilled workers, reducing barriers to trade and investment (both internally and externally), and improving incentives for technology adoption. This is the minimum needed to keep Canadians from being the poor cousins of the G7.
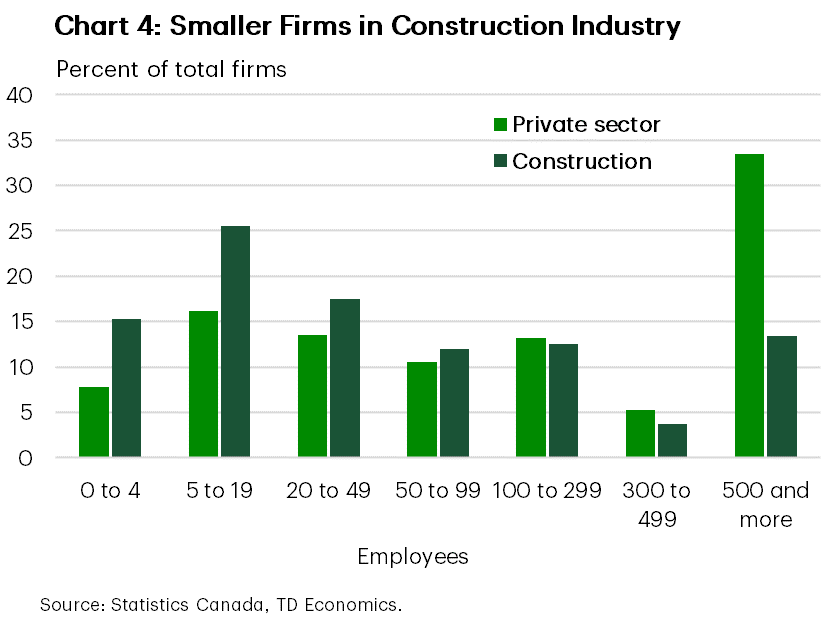
However, a focus needs to be on the construction sector, especially residential building. It is composed mainly of small firms, which are slower to adopt new technologies. Productivity has been weakest in building construction, which has the largest share of small firms. Targeted strategies to address constraints to growth could be beneficial. Harmonizing building codes and licensing requirements across provinces could help increase competition while allowing for greater returns to scale across the industry.
For service industries, greater reliance on non-permanent residents appears to have contributed to the productivity deterioration since the pandemic. This may seem counterintuitive amidst an aging labour force, but the concentration of non-permanent residents in low paid work has worsened Canada’s productivity performance.1 Raising productivity growth in services will require supportive tax and regulatory policy that encourage greater investment and accelerate technology adoption.
Goods sector productivity has contracted since the pandemic
Canada’s economy is primarily one of services. This is not a new development, but one that is steadily marching forward. The flip side of that coin is that over the past two decades, the combined activity of goods sectors — agriculture, utilities, manufacturing, and construction — has fallen from one-third to a quarter of the Canadian economy.
In terms of productivity, however, the goods sector punches above its weight. Labour productivity is over 30% higher than in the service sector. Bragging rights go to the relatively capital intensive mining, oil and gas extraction, and utilities sectors. Manufacturing, construction and agriculture have much lower levels of productivity by comparison.
Unfortunately, since the pandemic, with the exception of agriculture, forestry, hunting and fishing, productivity growth within goods-producing industries has not only slowed but has outright reversed (Chart 2). From an annual increase of 1.4% in the decade prior to the pandemic, it has declined by 1.2% annually since.
As a result, the goods sector has subtracted an average of 0.4 percentage points from Canada’s overall productivity growth every year since the pandemic. Had the sector just stayed flat, Canada’s pace would have risen 0.5% annually. Although this performance still pales to that of five years prior, it would have been sufficient to outpace the Euro Area.
Construction productivity has been in decline for decades
Chart 3 breaks down the problem. The utilities sector experienced a signficant deterioration since the pandemic, but this is not a primary area of concern as it was largely due to record-high temperatures that led to a decline in the production of hydroelectricity in 2023.2
The sectors of concern start with mining and oil and gas extraction, which experienced healthy productivity gains in the decade prior to the pandemic but has since fallen 0.5% annually. While measuring productivity in the sector is challenging (see text box below), there are some attributes unique to Canada. Investment in the sector has fallen in part as key infrastructure such as the Keystone XL pipeline was cancelled, but also as a result of reduced investment in the wake of carbon pricing and the energy transition.3 Although this is a necessary transition, decarbonization is likely to further weigh on investment in the sector. Given its relatively high level of labour productivity, this automatically presents a productivity challenge for Canada over the next several years.
Manufacturing is experiencing the smallest decline relative to its pre-pandemic average, but here too productivity has swung from gains to losses, with a particularly sharp drop over the past year.
And then there’s the construction sector, which has experienced the worst productivity of any goods sector. This is a longstanding pattern that has worsened, injecting more pain into Canada due to its rising share of economic activity.
Construction has generated no productivity growth over the past forty years! It’s not a uniquely Canadian problem, but rather global in nature. For instance, U.S. productivity growth in construction has been worse relative to Canada over the last 30 years and only slightly better since the pandemic. Studies in the U.S. have shown resources moving from higher productivity regions to lower – the opposite of allocative efficiency. The decline in productivity has coincided with an increase in land-use regulations, suggesting that non-economic factors have played a central role.4,5
The same appears to be true in Canada. For example, as documented by CMHC, there are considerable differences in residential construction productivity across the country, suggesting that differences in regulations and permitting play a role in productivity performance.6 More than other sectors, construction is characterized by very small firms – 40% have fewer than 20 employees (Chart 4). Smaller firms have been shown to have lower levels of productivity and are slower to adopt new technologies than larger firms.7 They also face larger regulatory burdens relative to their size than larger businesses, which materially weighs on productivity.8 There are a number of ‘low-hanging fruit’ barriers to growth in construction such as building codes, permitting and licensing requirements that differ across provinces and make it difficult for firms to operate across jurisdictions. A lack of standardization is another challenge that makes innovation harder to scale up across the industry.
Construction is growing in importance
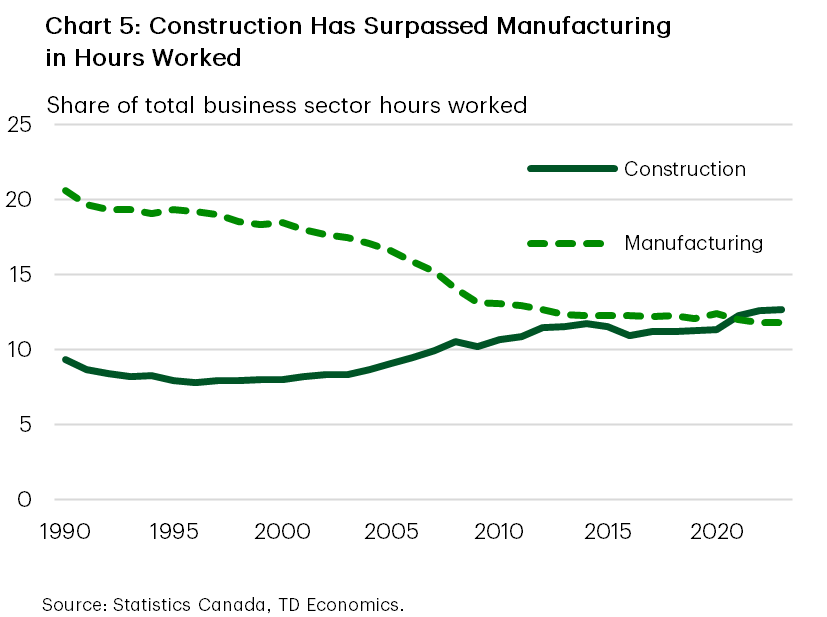
Unfortunately, the poor performance of the construction sector is an increasingly important driver of Canada’s overall productivity story because it is growing as a share of the economy more than other countries (Chart 5). In 2023, the construction sector represented 12.6% of all labour hours worked in Canada, up from 8% in 1997. Isolating to just the goods-producing sector, construction hours worked now exceed those in manufacturing, nearly doubling from 23% in 1997 to 42% of today.
Now consider the increasing shift of resources into construction activity rather than other areas, and the impact on total Canadian productivity intensifies. Adding this “reallocation effect” to the “within-sector effect” described above reveals a construction sector that has subtracted 0.5 percentage points from annual productivity growth since the pandemic. It has accounted for the vast majority of the decline in overall Canadian productivity relative to the pre-pandemic period.
And the problem deepens when we cast an eye forward. Construction is unlikely to become less important over the next five years, or more. Canada suffers from a housing deficit, suggesting a need for more resources to be sucked into the sector. The Bank of Canada’s recent Monetary Policy Report reduced their forecast for overall Canadian productivity over the next two years citing “constraints on housing construction coming from structural factors, such as the availability of land, zoning restrictions and a lack of skilled labour.”9
The rising importance of construction increases the urgency to improve productivity in the sector. But this requires more outside-the-box thinking, including moving to more prefabricated or modular building, developing a reskilled workforce around it, and rethinking the building code to allow for more flexibility in the sources of materials used that maintain the same results in terms of safety and durability. There are examples of this in other countries, such as Sweden, where modular building has a significant presence.10
The Curious Case of Productivity in Canada’s Oil & Gas Sector
Canada’s oil and gas sector has one of the highest productivity levels in the Canadian economy as well as some of the highest wages. Due to the size of its productivity outperformance relative to the rest of the economy, the sector has played an outsized role in driving Canadian productivity. Although the sector has seen labour productivity growth ebb and flow over several decades, it was on an encouraging upswing in the years leading up to the pandemic.11 Nonetheless, a decline in labour hours in the sector weighed materially on aggregate labour productivity growth.
Underneath the surface, things get even more complicated. Labour productivity can be broken down into the amount of capital per worker, the skills of those workers, and the technology that determines how inputs (capital and labour) are turned into outputs (termed multifactor productivity or MFP). In the textbook case, lifting productivity growth is simply a matter of increasing the capital and skills of workers and/or spurring innovation (MFP growth).
But in the real world, the oil and gas sector appears to have a counterintuitive relationship between the amount of capital it adds and growth in innovation. While the sector has consistently increased capital per worker, MFP has generally declined over the past 50 years. How could this be for a sector that has seen a steady stream of innovation from the early-days of steam-assisted gravity drainage in oilsands development to digital oil field technologies recently.
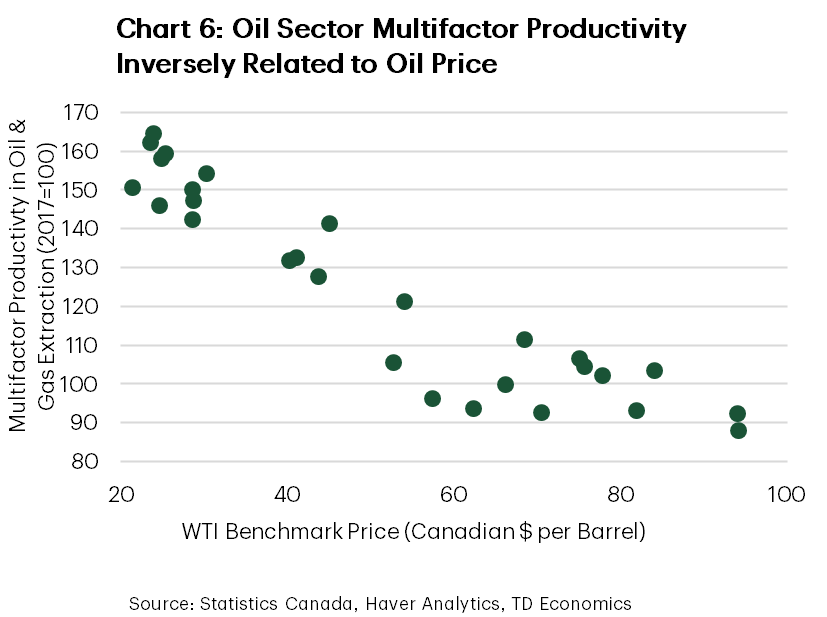
One reason is that the productivity statistics do not account for the price of the non-renewable resource. As oil prices have risen, companies have been induced to invest more into difficult deposits that take more labour and capital to extract. This shows up in an inverse relationship between oil prices and MFP (Chart 6).
A second reason is that productivity statistics do not account for the non-renewable nature of the resource. Even without the price effect, more labour and capital must necessarily be expended as easier geology deposits are exhausted. This contributes to the statistical underestimation of MFP growth.12
Finally, the sector must increasingly contend with the necessity of reducing its carbon footprint. This requires both investment and innovation – carbon capture and storage as an example – that does not necessarily raise output in the sector.
All of this suggests caution in interpreting weak MFP in the oil and gas sector and its negative effects on Canadian productivity growth. Labour productivity should be the focus.
A select few service industries have seen faster productivity growth since pandemic
It’s not all downbeat news. A few sectors stand out with improved productivity growth since the pandemic. Among them are wholesale and retail trade, information and cultural industries, accommodation and food services, and real estate, rental, and leasing. Many of these industries were hit hardest by the pandemic with greater employment disruptions, reinforcing the belief that productivity growth is about fewer people. As of 2023, hours worked in retail trade and real estate, rental and leasing was still lower than in 2019.
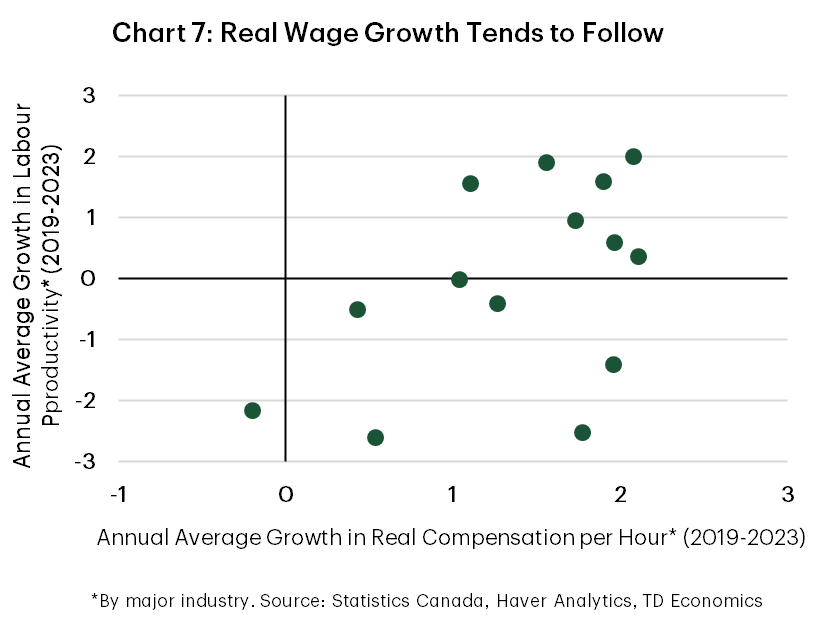
However, as in the past, gains from productivity are showing up in rising compensation for these workers. Since the pandemic, real (inflation adjusted) compensation per hour has grown faster in sectors with greater productivity growth. Service industries have experienced annual average growth in real compensation of 1.8% compared to 1.0% in goods sectors. The strongest productivity sectors have seen the strongest wage growth (Chart 7). Information and cultural industries have experienced real wage growth of 2.1% annually and accommodation and food services are not far behind at 2%.13
It is too early to say whether the pandemic shock has caused more permanent changes to these industries. Some of the productivity improvement may reflect trends in automation and digitization since the pandemic. This offers hope that as digital technologies and artificial intelligence (AI) are more widely adopted, productivity growth could accelerate. As we have argued (see report), Canada has a significant share of high-skilled occupations that could benefit from considerable improvements in productivity through AI.
Canada lags the U.S. across most industries, especially services
And this is where the big push must ultimately come from. Canada has lagged U.S. productivity growth for the past several decades, but the deterioration has worsened since the pandemic. Since then, the U.S. has seen business sector productivity growth of 1.6% annually, while Canada has failed to produce any advancement. From 2019 through 2022 (the latest detailed industry data available for the U.S), the U.S has outperformed Canada across most major industries.
U.S. productivity has been particularly strong within retail trade, information, and cultural industries (including telecommunications), professional, scientific, and technical services, and accommodation and food services. Although many of these same industries have led productivity growth for Canada more recently, they have consistently and significantly lagged the U.S. over the past two decades.
The greatest cross-country wedge has occurred within the professional, scientific, and technical services and accommodation and food services. The U.S. experienced accelerated and robust growth of 3.8% for the former and 3.9% for the latter from 2019 to 2022. By contrast, productivity growth in Canada’s professional services sector slowed from its pre-pandemic average. Productivity growth improved in the retail sector, but to a much smaller degree than in the United States.
Some of the challenges are longstanding. Canada has been a laggard in adopting information and communication technology (ICT) and meaningfully slower growth within this area explains much of the growing U.S.-Canada productivity gap in the two decades prior to the pandemic.
In fact, there’s only one sector that has consistently outperformed its American counterparts over the past decade and through the pandemic: finance, insurance, real estate, rental and leasing (FIRE). In the decade prior to the pandemic, labour productivity in the sector grew by 2.2% annually in Canada compared to 1.0% in the U.S. Since the pandemic, the gap has increased, with growth of 3.2% in Canada and just 0.4% in the United States. Output of the financial sector in the U.S. was impacted to a much higher degree by the Global Financial Crisis, but that does not explain Canada’s more recent outperformance. Some of it may reflect catch up growth, as the U.S. sector exhibits higher levels of labour productivity than Canada. While comparable data on the details between the two countries is only available to 2020, in the five years prior to the pandemic, the sectors in both countries saw similar contribution from investment-driven growth in capital per worker, but Canada’s industry saw relatively faster MFP growth.


Maintaining A Competitive Tax Regime
An internationally competitive tax system is an important contributor to investment and productivity. Canada made a concerted effort to lower its corporate income taxes in the early 2000s and had lower corporate income tax rates than international peers through the decade that preceded the pandemic. However, this advantage has eroded considerably in recent years as other countries have lowered tax rates. The Tax Cuts and Jobs Act of 2018 for example lowered the U.S. corporate income tax rate by fourteen percentage points from 35% to 21%. Several European countries also reduced their tax rates over this period. With these changes abroad, Canada’s average tax rate is now roughly in line with the U.S. and OECD average, but higher than Europe. A tax rate just in line with the U.S. is probably not sufficient to counteract the country’s inherent strengths in drawing in investment and talent. Canada must aim to do better in order to level the playing field.
The profitability of new investments is also influenced by a host of other measures that interact with the tax system, including interest, depreciation, inventory cost, fees, and other deductions. A measure that includes these factors is the marginal effective tax rate (METR).14 Canada’s METR was temporarily reduced below peers by accelerated depreciation measures in 2019, which allowed investment in manufacturing and processing machinery and equipment to be fully deducted from taxes. The deduction was, however, temporary, and is set to be fully phased out by 2028. As this temporary measure expires, Canada’s METR will rise considerably, raising the cost of new investment and weighing on productivity growth.15
Some might wonder if these tax credits have been effective, considering Canada’s deteriorated investment and productivity backdrop over the last several years. The flip side of the lens is to consider how much worse the investment impulse would be in Canada in their absence. Unwinding it would fly in the face of “do no harm” principle, reducing Canada’s competitiveness during a period when the struggle runs so deep. In addition, measurements like the METR do not include regulations or provisions in the tax code that favour certain industries over others. These have also been shown to impede markets signals, weigh on productivity and reduce competitiveness.16
Bottom Line
Canada has seen its productivity go from bad to worse since the pandemic. Labour productivity was temporarily and artificially lifted by pandemic lockdowns in early 2020 when hours were cut more than overall economic activity. But in the three years since productivity has declined every single year, with the decline worsening in 2023 relative to 2022. An outright decline in productivity in the goods sector explains much of Canada’s moribund productivity growth. While the service sector slowed more modestly, this is nothing to crow about. It stands in sharp contrast to the improved performance stateside.
Addressing Canada’s productivity issues requires comprehensive strategies, including promoting competition, incentivizing technology adoption, reducing barriers to growth across jurisdictions, and implementing smarter regulations. At a minimum, government should focus on doing no harm, maintaining incentives for capital investment. The expiry of the accelerated depreciation allowance (discussed in textbox above) is a move in the wrong direction, raising the cost of new investment. Reforming the tax code more broadly to reduce the cost of new investment should be a policy priority. Focusing on improving productivity in construction sector is particularly urgent due to its growing economic importance. If Canada does not play to win on labour productivity, it risks a continued drop in living standards, worsening wage stagnation and a dangerous deterioration in public services.
End Notes
- Smith, Philip. Accounting for the Decline of Canada’s Real GDP per Capita Since Mid-2022. International Productivity Monitor, Centre for the Study of Living Standards, Spring 2024. Available at: http://www.csls.ca/ipm/46/IPM_46_Smith.pdf
- Statistics Canada. “Hydroelectricity generation dries up amid low precipitation and record high temperatures: Electricity year in review 2023.” March 5, 2024. Available at: https://www.statcan.gc.ca/o1/en/plus/5776-hydroelectricity-generation-dries-amid-low-precipitation-and-record-high-temperatures
- Wang, W., “The Oil and Gas Sector in Canada: A Year After the Start of the Pandemic.” Economic and Social Reports. Vol. 1, no.7. Statistics Canada. July 28, 2021. Available at: https://www150.statcan.gc.ca/n1/pub/36-28-0001/2021007/article/00003-eng.pdf
- Goolsbee Austan and Syverson, Chad., “The Strange and Awful Path of Productivity in the U.S. Construction Sector.” NBER Working Paper 30845, National Bureau of Economic Research, January 2023. Available at: https://www.nber.org/system/files/chapters/c14735/c14735.pdf
- D’Amico, Leonardo and Glaeser, Edward L. and Gyourko, Joseph and Kerr, William R. and Ponzetto, Giacomo A. M., “Why Has Construction Productivity Stagnated? The Role of Land-Use Regulation.” December 30, 2023. Available at: https://ssrn.com/abstract=4679195 or http://dx.doi.org/10.2139/ssrn.4679195
- Laberge, Mathiue. “What is Canada’s Potential Capacity for Housing Construction?” Web log. The Housing Observer (blog) (May 16, 2024). Available at: https://www.cmhc-schl.gc.ca/blog/2024/what-canada-potential-capacity-housing-construction#:~:text=Even%20with%20a%20record%2Dhigh,over%20400%2C000%20homes%20per%20year
- Baldwin, John R, Leung, Danny, and Rispoli, Luke. “Canada-United States Labour Productivity Gap Across Firm Class Sizes.” The Canadian Productivity Review. Catalogue no. 15-206-X, no 0.33. March 10, 2014. Available at: https://www150.statcan.gc.ca/n1/en/pub/15-206-x/15-206-x2014033-eng.pdf?st=WuWeixPT
- Tu, Jiong. “The Impact of Regulatory Compliance Costs on Business Performance.” Innovation, Science and Economic Development Canada. 2020. Available at: https://ised-isde.canada.ca/site/paperwork-burden-reduction-initiative/en/survey-regulatory-compliance-costs/impact-regulatory-compliance-costs-business-performance-october-2020
- Bank of Canada. Monetary Policy Report - July 2024. Bank of Canada, July 24, 2024. Available at: https://www.bankofcanada.ca/wp-content/uploads/2024/07/mpr-2024-07-24.pdf
- Anderson, Christina. “How and American Dream of Housing Became a Reality in Sweden.” New York Times, June 8, 2024. Available at: https://www.nytimes.com/2024/06/08/headway/how-an-american-dream-of-housing-became-a-reality-in-sweden.html
- Due to the size of its productivity outperformance relative to the rest of the economy, movements in resources in and out of the sector can play an outsized role in driving Canadian productivity. In the five years prior to the pandemic one of the key drags on Canada’s productivity was the decline in production and hours in the oil and gas sector.
- Gordon, Stephen. “What Explains the Weak Growth in Total Factor Productivity in Non-Renewable Resource Extraction Industries?” Web log. Worthwhile Canadian Initiative (blog) (June 26, 2024). Available at: https://worthwhile.typepad.com/worthwhile_canadian_initi/2024/06/tfp.html
- Without productivity growth, increases in wages imply a decrease in relative competitiveness. This is a particular challenge for export-facing industries. As a result of poor productivity growth, the cost of labour relative to output has risen faster in Canada than in the United States, making it harder for Canadian companies to compete at the going exchange rate.
- Bazel, Philip and Mintz, Jack. 2020 Tax Competiveness Report: Canada’s Investment and Growth Challenge. The School of Public Policy, University of Calgary, September 2021. Available at: https://www.policyschool.ca/wp-content/uploads/2021/09/FMK2_2020-Tax-Competitiveness_Bazel_Mintz.pdf
- Ibid.
- Farhi, Emmanuel and Baqauee, David. The Impact of Firm Misallocation on Aggregate Productivity: A Quantitative Analysis. Harvard University, 2020. Available at: https://scholar.harvard.edu/files/farhi/files/misallocation_main.pdf
Disclaimer
This report is provided by TD Economics. It is for informational and educational purposes only as of the date of writing, and may not be appropriate for other purposes. The views and opinions expressed may change at any time based on market or other conditions and may not come to pass. This material is not intended to be relied upon as investment advice or recommendations, does not constitute a solicitation to buy or sell securities and should not be considered specific legal, investment or tax advice. The report does not provide material information about the business and affairs of TD Bank Group and the members of TD Economics are not spokespersons for TD Bank Group with respect to its business and affairs. The information contained in this report has been drawn from sources believed to be reliable, but is not guaranteed to be accurate or complete. This report contains economic analysis and views, including about future economic and financial markets performance. These are based on certain assumptions and other factors, and are subject to inherent risks and uncertainties. The actual outcome may be materially different. The Toronto-Dominion Bank and its affiliates and related entities that comprise the TD Bank Group are not liable for any errors or omissions in the information, analysis or views contained in this report, or for any loss or damage suffered.
Download
Share: