A Regional Look at Canadian Inflation
Omar Abdelrahman, Economist | 416-734-2873
Date Published: September 27, 2021
- Category:
- Canada
- Provincial and Local Analysis
Highlights
- Base-year effects, supply-side constraints, and pent-up demand have colluded to lift inflation above 3% y/y in nine of the ten provinces.
- While inflation has been running hot across most of Canada, the national headline CPI figures still conceal large regional divergences. Atlantic Canada, Alberta, and to a lesser extent, Quebec, are experiencing higher than average inflation rates at or above the 4.4% mark. On the flip side, price pressures in B.C. and Saskatchewan have been less notable.
- Regional differences in inflation rates are not uncommon in Canada. In some provinces, gaps tend to become amplified during business cycle turning points and/or significant oil price swings.
- Indeed, during the current upcycle, energy has been one of the key drivers of the widening price differentials, with underlying core inflation trending within a tighter range. Shelter is another factor dividing provincial performances.
- Looking ahead, the gap between CPI inflation rates across the provinces should narrow as energy price movements ease, base-year effects wane, and the recovery becomes more synchronized across the provinces.
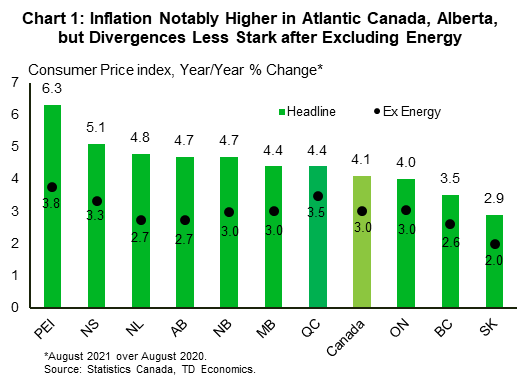
Following years of subdued performance, the pandemic has changed the inflation picture globally and in Canada. In August, year/year CPI inflation rose to 4.1% in Canada, the highest since 2003. The drivers – from weak base-year effects, supply chain constraints, and pent-up demand – have been discussed at length (see discussion in our latest report). The extent to which these pressures have lasting power remains highly contested. But beneath the headline figure, there also lies stark and interesting regional differences (See Chart 1, Tables 1 and 2). Atlantic Canada, Alberta, and to a lesser extent, Quebec have been witnessing above-average inflationary pressures. Meanwhile, B.C. and Saskatchewan's inflation rates have been comparatively benign. A closer look shows that much of the variation between regions can be chalked up to differences in contributions from energy prices in the respective CPI baskets. These contributions manifest in higher transportation (gasoline) and shelter (utilities) inflation. Other areas of shelter, such as rent, are another wedge factor, though to a smaller extent.
Looking ahead, we expect that the gap in inflation rates across the provinces will narrow in the coming months. In the post-vaccine world, growth performances should become more synchronized, and base-year effects should ease as the impacts of last year's oil price slump fade. We suspect that inflation in Canada will remain elevated in the coming quarters as the reopening impacts continue to make their way to higher consumer prices (see our latest Quarterly Economic Forecast). Moreover, food inflation has additional upside risk, and shelter inflation may exhibit some persistence. These forces should be equally impactful in all provinces. We note, however, that some provinces, like B.C. and Quebec, could face more upside risks due to tighter labour markets.
Historical Context on Provincial Inflation
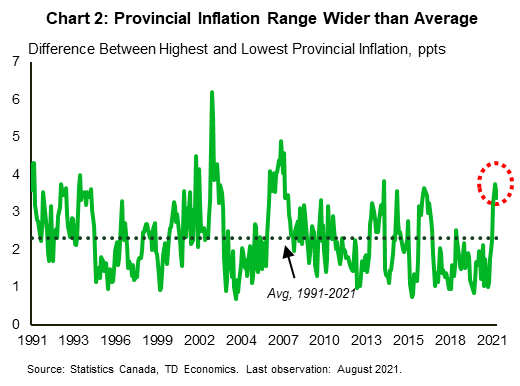
Before dissecting the drivers behind the current inflation rate gaps, some historical context on provincial inflation trends can be useful. From a longer-term perspective, inflation across all provinces has averaged remarkably close to the 2% target since the Bank of Canada's inflation targeting framework began in 1991. That said, at any point in time, deviations will occur between the provinces. In fact, the range between the highest and lowest inflation rates across the ten provinces has, on average, been in the order of 2 percentage points (Chart 2). In turn, the current range (at 3+ ppts) is higher than average, but is not unusual when placed in the context of past business cycle turning points and oil price swings.
A wedge between provincial inflation rates can be driven by idiosyncratic drivers, such as new taxes, utility charges, and minimum wage changes. Inflation differences can also stem from more amplified business cycles. Indeed, Alberta has seen periods of unusually high growth during past oil booms, which pushed its economy further into excess demand than in other provinces, leading to higher inflation. Broadly speaking, Alberta and Atlantic Canada have tended to record more inflation volatility historically. A closer examination also suggests that these episodes were largely driven by variations in the respective energy components.
Base Effects and Energy Playing a Sizeable Role
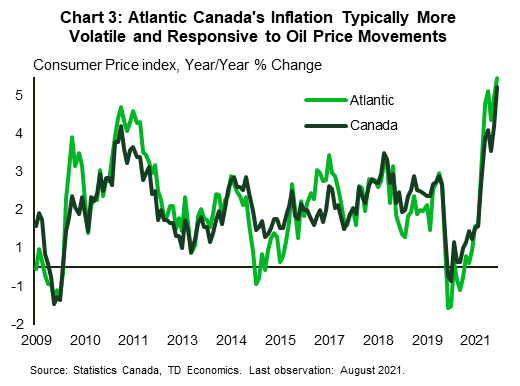
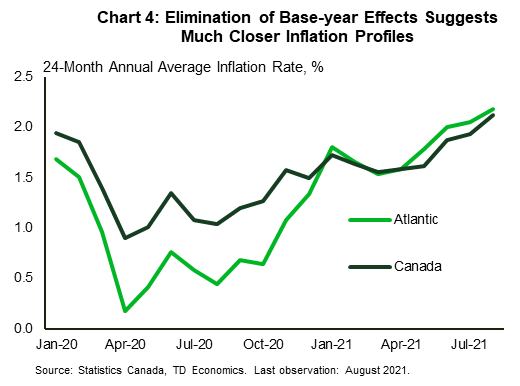
Chart 3 examines recent trends in Atlantic Canada relative to the country. While inflation across this region has averaged close to the national rate over the past two decades, it has exhibited greater movements during business cycle turning points and oil price swings.1 The same dynamic has been on display this time around. In fact, PEI's and Nova Scotia's inflation rates have recently surged past the 6% and 5% marks, respectively. Energy prices impact two key expenditure categories in the CPI basket - transportation (through gasoline prices) and shelter (through electricity, natural gas, and fuel oil prices). The core measures in Chart 1 show how the gap in inflation rates in these provinces shrinks considerably after controlling for energy prices. For one, base-year effects appear to be stronger in the region (except, perhaps, for N&L), with energy prices having fallen more drastically in 2020. This gave way to higher inflation this year simply as a result of last year's more pronounced weakness. A look at the two-year inflation rate (annualized) helps strip out these base-year effects. And indeed, this measure confirms that Canada's and Atlantic Canada's underlying inflation dynamics are closer than meets eye after accounting for last year's base effects (See Chart 4, Table 2).
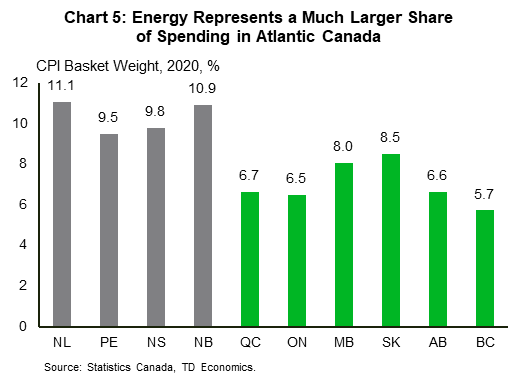
Importantly, the more outsized impact is also largely reflective of the significantly higher share of energy consumption in Atlantic Canada's CPI basket (Chart 5). Indeed, the weight of energy in the CPI basket stands at an average of 10.3% in these four provinces, compared to 6.7% nationally. Not only is the share of gasoline in total spending higher (thus resulting in higher transportation inflation), but the region also uses more fuel oil in its utilities mix (which has implications for shelter inflation). For Alberta, energy prices have also been higher than Canada's, largely reflecting a surge in electricity charges as well as gasoline and natural gas prices. However, headline inflation in Alberta was much closer to the national average up until July. Price pressures were comparatively less notable across other spending categories (such as owned and rented accommodation).
The Other Suspects: Shelter's Key Components
No discussion on inflation would be complete without a mention of shelter. This component has been among the largest contributors to year/year growth in Canada's inflation rate. It also accounts for the largest weight in the CPI basket in all ten provinces. The notable rise in shelter inflation is a theme reverberating across all provinces, barring perhaps Saskatchewan. It's easy to see why. Most resale markets are tight, with sales-to-listings ratio elevated. With new home prices having surged, homeowners' replacement costs have spiked by more than 10% across the country.
On the shelter front, PEI and Nova Scotia stand out with higher inflation rates yet again. But it is important to note that shelter inflation has some overlap with the broader "energy" category. It was noted above that heating fuel accounts for a larger share of utilities spending in these provinces than in the rest of the country (and is an area that is also witnessing notable upward pressure, see Table 1). Rent inflation has also been notably higher across these provinces. Though the data is somewhat dated, this aligns with increased interprovincial migration into Nova Scotia, and to a lesser extent, PEI. At the same time, provinces with large metropolitan areas (B.C. and Ontario) may have seen less pronounced rent pressures as higher income earners opted to switch away from apartments to single-detached and multifamily homes. With the underlying drivers of housing markets now more synchronous across most major markets, we expect shelter inflation to converge closer to the national average. Resale activity is moderating across all markets. Rent prices are rebounding, in tandem with reopening plans, a partial return to offices, and affordability constraints in some home ownership markets. Meanwhile, mortgage costs, an area experiencing deflation, should start picking up across the provinces as borrowing rates gradually (though modestly) tick up.
Divergent Capacity Pressures Are Less Apparent For the Time Being
Beyond energy and shelter, it is difficult to discern further meaningful divergence across provincial inflation rates. Alberta's inflation, for instance, is much closer to the national average after removing energy costs. PEI, Nova Scotia, and Quebec appear to be witnessing more broad-based strength across the spending categories (See Table 1 and 2), even after accounting for the volatile energy category and base-year effects. This could be explained by an earlier reopening, higher mobility, and speedier economic recoveries in these economies. Still, their inflation wedge shrinks considerably after controlling for the two drivers and base-year effects.
And elsewhere, other themes shaping the inflation narrative at the national level have been broadly consistent across the provinces. All provinces are witnessing an increase in recreation and health and personal care inflation. These are spending categories linked to reopening plans. And indeed, Ontario, the latest province to fully reopen close-contact industries, saw the lowest contribution from these categories combined in August. The semiconductor shortage is a common supply constraint that has reverberated similarly across all provinces, as reflected in sharply rising vehicle prices. Food has been a positive contributor to CPI growth in all provinces, with its impact starting to show up more recently.
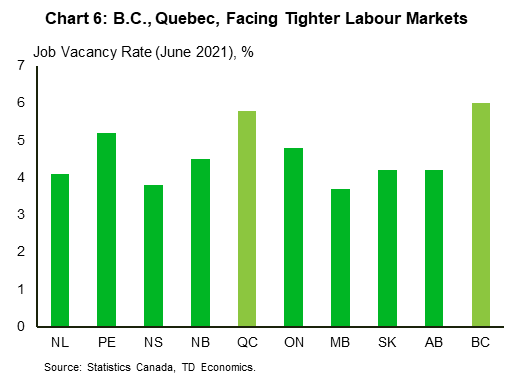
For provinces witnessing more muted inflation than the national average, the reasons are less apparent. In Saskatchewan, more subdued inflation in shelter appears to be a key driver. this could potentially be explained by consistently large interprovincial outmigration flows. Saskatchewan's comparatively lower inflation readings could also signal some underlying slack. The province's employment has been moving sideways recently, despite an earlier reopening. B.C.'s case is more surprising at first glance. The province has been among the first to reopen, and its labour markets are closer to recovery than in any other province. A large part of its inflation underperformance reflects its lower exposure to energy in the CPI basket (see Chart 5). The share of private vehicle transportation - an area witnessing notable price pressures - is also lower in B.C. But either way, we suspect that a more robust economic recovery and tighter labour markets (Chart 6) will eventually make their way to wage and inflationary pressures in the province, narrowing its CPI underperformance relative to Canada's. On this note, Canada has been witnessing lackluster wage growth in recent months. B.C. and Quebec boast the highest job vacancy rates and among the lowest unemployment rates in the country. In turn, wage growth in both provinces has picked up by more than Canada's. Further momentum on the wage growth front is possible in these provinces amid tighter labour markets.
Table 1 - Year/Year % Change in the Consumer Price Index - From August 2020 to August 2021
Table 1 shows the year/year percentage change in the consumer price index in August, 2021, across the different expenditure categories and provinces. Atlantic Canada and Alberta stand out with higher inflation rates, and B.C. and Saskatchewan are at the lower end. PEI has the highest inflation rate (6.3%), followed by Nova Scotia (5.1%), Newfoundland & Labrador (4.8%), Alberta and New Brunswick (4.7%), Quebec and Manitoba (4.4%), Ontario (4%), B.C. (3.5%), and Saskatchewan (2.9%). The "energy" aggregation divers a significant portion of these divergences. The Atlantic provinces, alberta, and Manitoba show notably higher energy inflation (20%+), with Alberta (33.9%), PEI (31.6%), and Nova Scotia (24.1%) the highest. Energy inflation is still high but lower in Saskatchewan (12.7%), B.C. (18.5%), Ontario (19.1%), and Quebec (17.6%). In turn, these same regions also exhibit the highest transportation inflation rates (at 11%+), notably higher than B.C. (4.6%), Saskatchewan (7.3%), and Ontario (8%). Shelter is another area where energy inflation shows up, with elevated water/fuel/electricity inflation in Atlantic Canada and Alberta. Broad-based strength spanning other areas of shelter, such as rented and owned accommodation, can be seen in PEI and Nova Scotia, alongside Manitoba. The all-items ex-energy category shows a narrower wedge between provincial inflation rates, but PEI and Nova Scotia are still among the top performers, joined by Quebec, which is witnessing more upward price pressures elsewhere. Alberta's inflation outperformance shrinks after using this "core" measure. Controlling for shelter inflation also narrows the wedge between the provinces, though to a lesser extent.
| Category | NL | PE | NS | NB | QC | ON | MB | SK | AB | BC |
| All-Items | 4.8 | 6.3 | 5.1 | 4.7 | 4.4 | 4.0 | 4.4 | 2.9 | 4.7 | 3.5 |
| Food | 3.6 | 3.3 | 2.9 | 4.3 | 2.5 | 2.6 | 1.8 | 2.3 | 3.5 | 2.5 |
| Alcohol/Tobacco | 12.2 | 2.6 | 3.9 | 1.5 | 5.7 | 0.6 | 3.6 | 5.0 | 0.8 | 1.1 |
| Shelter | 3.6 | 11.2 | 6.5 | 4.2 | 4.2 | 4.8 | 6.8 | 1.2 | 5.4 | 5.5 |
| Rented Accommodation | 2.9 | 7.9 | 7.4 | 8.6 | 3.7 | 0.5 | 4.9 | -0.6 | 0.5 | 0.8 |
| Owned Accommodation | 1.0 | 6.9 | 4.1 | 2.3 | 4.5 | 6.0 | 7.0 | 3.0 | 2.9 | 7.0 |
| Water/Fuel/Electricity | 9.5 | 25.4 | 11.3 | 5.8 | 4.0 | 6.0 | 8.5 | -1.6 | 21.6 | 6.2 |
| Household Operations/Furnishings | -2.6 | 0.5 | 0.2 | -1.3 | 2.4 | 2.4 | -1.2 | 1.4 | -0.2 | 0.3 |
| Clothing & Footwear | -1.0 | 0.1 | -0.8 | 0.0 | -0.3 | 0.1 | 0.3 | -1.0 | -1.2 | 1.3 |
| Transportation | 13.2 | 11.3 | 12.2 | 13.1 | 9.6 | 8.0 | 10.4 | 7.3 | 12.4 | 4.6 |
| Health and Personal Care | 1.1 | 2.0 | 1.7 | 2.3 | 3.2 | 3.8 | 1.5 | 0.9 | 1.4 | 2.2 |
| Recreation, Education, Reading | 2.7 | 3.8 | 2.9 | 1.6 | 3.2 | 0.6 | 1.1 | 2.6 | 3.3 | 3.8 |
| Energy | 23.6 | 31.6 | 24.1 | 21.0 | 17.6 | 19.1 | 22.7 | 12.7 | 33.9 | 18.5 |
| All-Items Ex Energy | 2.7 | 3.8 | 3.3 | 3.0 | 3.5 | 3.0 | 3.0 | 2.0 | 2.7 | 2.6 |
| All-Items Ex Shelter | 5.1 | 4.8 | 4.6 | 4.8 | 4.3 | 3.6 | 3.4 | 3.4 | 4.5 | 2.6 |
Table 2: Two-Year Annual Average % Change in the Consumer Price Index - From August 2020 to August 2021
Table 2 shows the two-year (24-month change) annualized percentage change in the consumer price index in August, 2021, across the different expenditure categories and provinces. This measure shows a much narrower wedge in inflation rates across the provinces. Still, PEI, Alberta, and to a lesser extent Quebec, stand out with notably higher inflation rates here. For Alberta, 2-year energy inflation is very high, even after controlling for base effects. For PEI, it is notable strength in its shelter category. For Quebec, price pressures appear to be more divided elsewhere (health/personal care, household operations). Saskatchewan and B.C. have the lowest 2-year (annualized) inflation rates.
| Category | NL | PE | NS | NB | QC | ON | MB | SK | AB | BC |
| All-Items | 2.1 | 3.0 | 2.2 | 2.0 | 2.4 | 2.0 | 2.1 | 1.7 | 2.6 | 1.8 |
| Food | 1.8 | 3.2 | 2.5 | 2.9 | 2.5 | 2.2 | 1.8 | 2.3 | 2.5 | 2.1 |
| Alcohol/Tobacco | 7.3 | 2.2 | 2.2 | 0.8 | 3.3 | 0.0 | 2.0 | 1.8 | 0.4 | 2.0 |
| Shelter | 2.5 | 5.5 | 2.8 | 2.7 | 2.8 | 3.4 | 3.2 | 0.7 | 3.5 | 3.3 |
| Rented Accommodation | 5.0 | 7.9 | 3.1 | 5.4 | 2.6 | 1.0 | 3.3 | -1.1 | 0.7 | 1.2 |
| Owned Accommodation | 0.8 | 4.8 | 3.3 | 2.3 | 3.5 | 4.4 | 4.3 | 1.5 | 1.9 | 3.9 |
| Water/Fuel/Electricity | 4.8 | 5.1 | 1.6 | 1.9 | 0.5 | 2.6 | 2.8 | 0.3 | 13.0 | 3.7 |
| Household Operations/Furnishings | -1.0 | 0.8 | 0.1 | 0.0 | 1.5 | 1.3 | -0.5 | 1.4 | 0.0 | 0.6 |
| Clothing & Footwear | -2.2 | -1.3 | -0.3 | -1.5 | -1.6 | -0.4 | -0.5 | 0.0 | -0.2 | -0.2 |
| Transportation | 4.7 | 4.1 | 5.0 | 4.9 | 4.3 | 3.3 | 3.6 | 2.9 | 6.3 | 1.4 |
| Health and Personal Care | 1.5 | 2.2 | 1.9 | 1.5 | 2.7 | 2.1 | 1.6 | 1.4 | 1.1 | 2.6 |
| Recreation, Education, Reading | 0.5 | 0.0 | -0.7 | -1.1 | 0.5 | -1.9 | 1.1 | 1.9 | 0.6 | 0.3 |
| Energy | 7.9 | 6.8 | 4.7 | 4.1 | 4.1 | 5.3 | 7.0 | 4.6 | 16.7 | 6.2 |
| All-Items Ex Energy | 1.4 | 2.5 | 1.9 | 1.8 | 2.3 | 1.8 | 1.8 | 1.4 | 1.7 | 1.6 |
| All-Items Ex Shelter | 2.0 | 2.2 | 2.0 | 1.9 | 2.3 | 1.4 | 1.6 | 2.0 | 2.4 | 1.2 |
Bottom Line
Some interesting divergences have emerged between provincial inflation rates. However, a look at history suggests that this is not uncommon during business cycle turning points and times of significant changes in oil prices. A closer look at the data confirms that differences in energy inflation and the relative importance of energy in the CPI basket account for the bulk of the differences. To a lesser extent, shelter has also been playing a role. While inflation is expected to remain elevated in Canada in the coming months, we expect the gaps across the provinces to broadly narrow. Still, B.C. and Quebec appear to face more upside risks to inflation due to their sturdier economic recovery and tighter labour markets.
Disclaimer
This report is provided by TD Economics. It is for informational and educational purposes only as of the date of writing, and may not be appropriate for other purposes. The views and opinions expressed may change at any time based on market or other conditions and may not come to pass. This material is not intended to be relied upon as investment advice or recommendations, does not constitute a solicitation to buy or sell securities and should not be considered specific legal, investment or tax advice. The report does not provide material information about the business and affairs of TD Bank Group and the members of TD Economics are not spokespersons for TD Bank Group with respect to its business and affairs. The information contained in this report has been drawn from sources believed to be reliable, but is not guaranteed to be accurate or complete. This report contains economic analysis and views, including about future economic and financial markets performance. These are based on certain assumptions and other factors, and are subject to inherent risks and uncertainties. The actual outcome may be materially different. The Toronto-Dominion Bank and its affiliates and related entities that comprise the TD Bank Group are not liable for any errors or omissions in the information, analysis or views contained in this report, or for any loss or damage suffered.
Download
Share: