The Regional Divide in Canadian Homebuilding
Rishi Sondhi, Economist | 416-983-8806
Date Published: January 29, 2026
- Category:
- Canada
- Latest Research
- Real Estate
Highlights
- Canadian housing starts are trending at about 260,000 annualized units, close to post-war highs. However, in per capita terms, recent homebuilding activity is a cast in a more moderate light, while the housing supply gap remains large at an estimated 400,000 units.
- Healthy homebuilding levels have been mainly driven by purpose-built rental units, supported by strong demand, government incentives, and financing programs. Meanwhile, ground-oriented ownership housing construction has lagged.
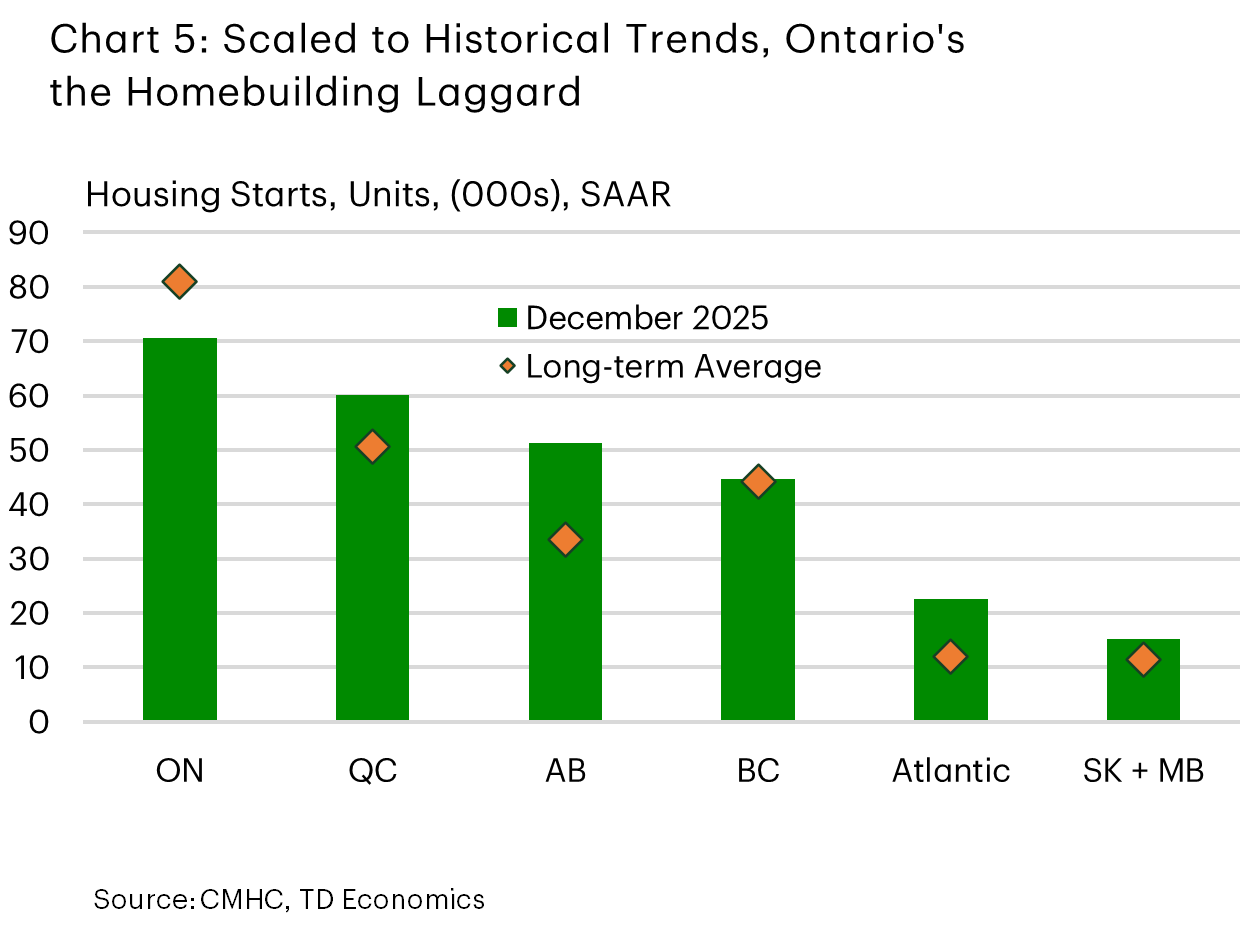
- Housing starts are at or above long-term averages in every region but Ontario, supported by past robust population growth and relatively tight supply. Starts have been particularly elevated, relative to long-run norms, in Alberta and the Atlantic region. Quebec’s market has been propped up by the rental market while condo construction has been surprisingly resilient in B.C.
- Ontario, particularly the Greater Toronto Area, has exhibited the weakest homebuilding activity with condo starts at very low levels, impacted by falling prices, investor pullback, and high construction costs.
- Canadian population growth has sharply moderated since 2024, and this is starting to weigh on fundamentally-driven housing demand while weakening rents.
- Moving forward, housing starts are expected to decline in most regions due to sharply slowing population growth, rising vacancy rates, climbing unsold inventories and weak pre-construction sales activity in the GTA market. Federal initiatives like Build Canada Homes could provide support, although the program comes against the context of a broader slowdown in federal housing spending.
- Even with the pace of housing starts likely to cool, tremendously weak population growth should ensure that the gap between demographically-driven demand for new homes and new housing completions closes in 2027.
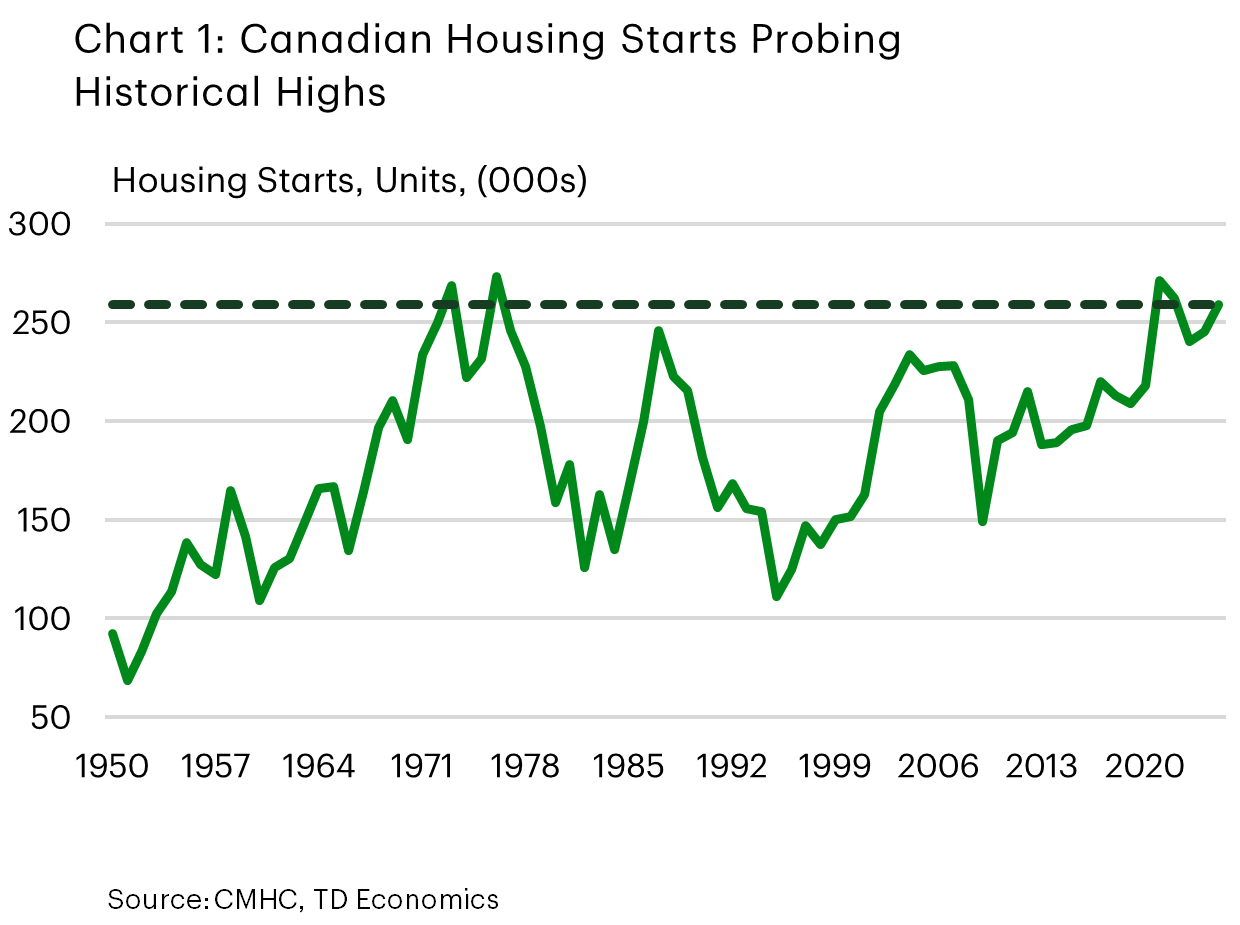
On an historical basis, Canadian homebuilding is indeed running strong. Housing starts are trending at a 264k annualized pace – a rate that’s only been topped a few times during the entire post-war period (Chart 1). Homebuilding reached slightly loftier levels during the super-charged housing market activity of the pandemic. Housing starts were also higher at times during the 1970s, amid solid demographics, firm population growth and a favourable regulatory environment. Still, housing starts have never topped 273k units over an entire calendar year, so their current run-rate is quite impressive.
Here we’d note that a housing start is recorded when the concrete is fully poured for a building’s foundation. This process can take several months (or longer) and as such, housing starts may offer a lagged snapshot of the most up-to-date conditions (relative to other indicators like pre-construction sales, for example). Housing starts are used in this analysis as they are an industry-standard series that is analyzed and forecasted because they represent a firm indication that actual construction on a project has begun. And, they are reliable data covering many housing cycles that can be compared across regions.
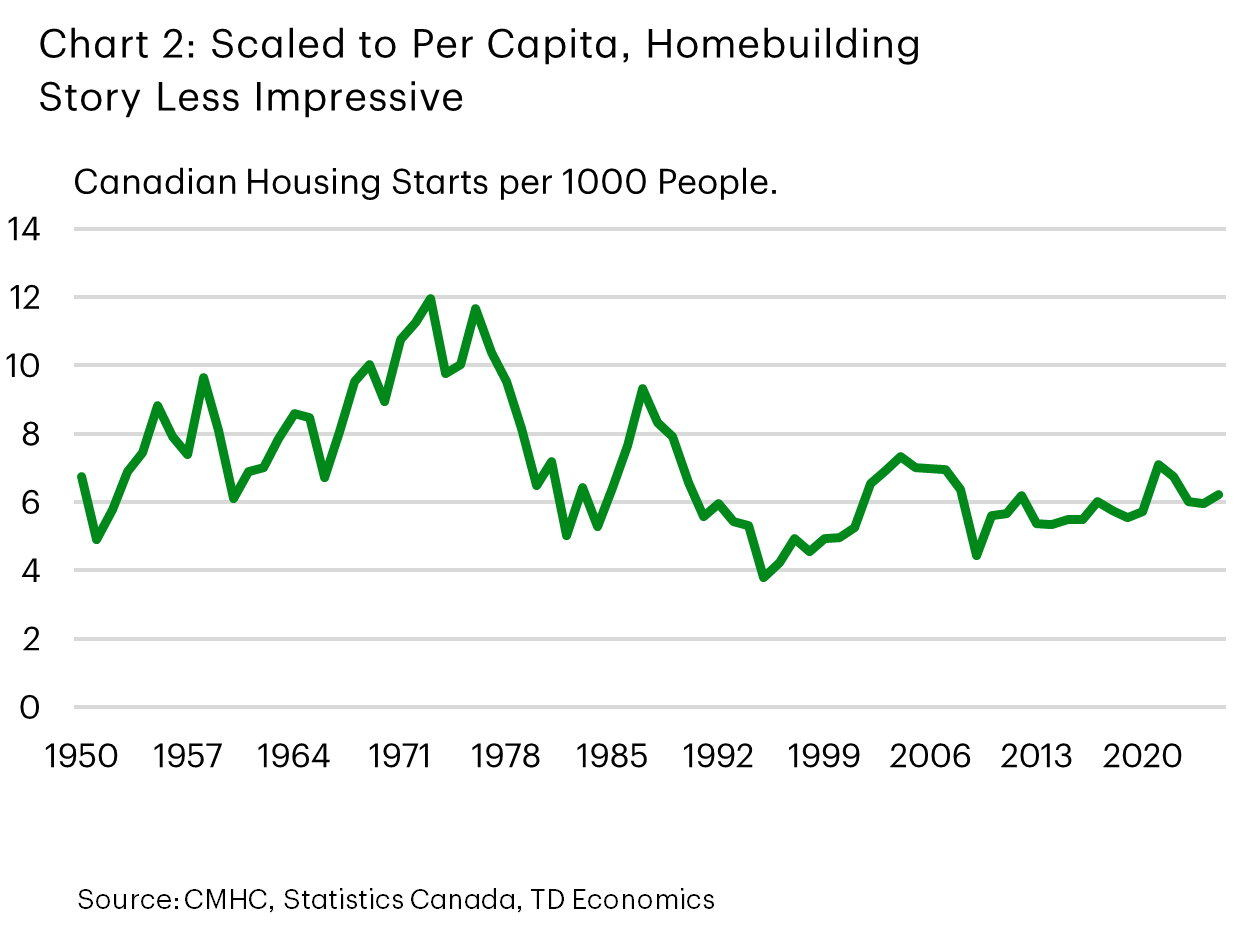
Peeling away the onion on the topline housing starts measure does remove some of its shine. The rapid rise in homebuilding has come against a backdrop of a multi-year population surge of historic proportions, which is only now unwinding. Indeed, on a per capita basis, the rate of housing starts looks much more pedestrian (Chart 2). And, while headway has been made, this healthy pace of starts has yet to close the gap between demographically-driven demand for new homes and new supply that yawned higher during the 2022-2024 population boom. In aggregate, we figure that this gap amounts to about 400k units, although we’d note that this estimate doesn’t distinguish between different structure types. For instance, given several quarters of falling prices, it would be tough to argue that there’s a condo shortage in the GTA. However, there has been a multi-decade period where construction of ground-oriented units (detached, semis, towns/rows) have been de-emphasized, and where housing shortages are likely among (if not the most) pronounced.
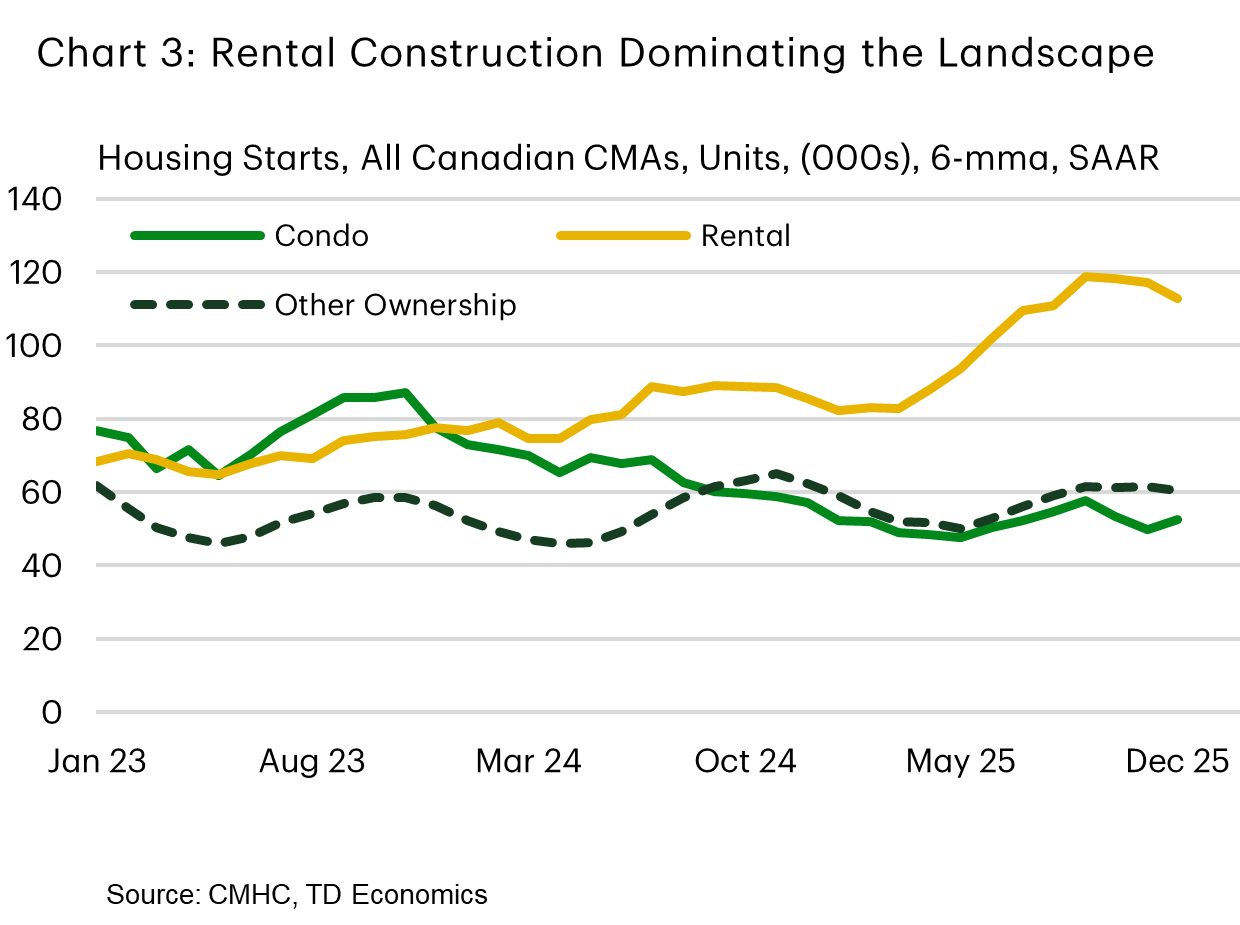
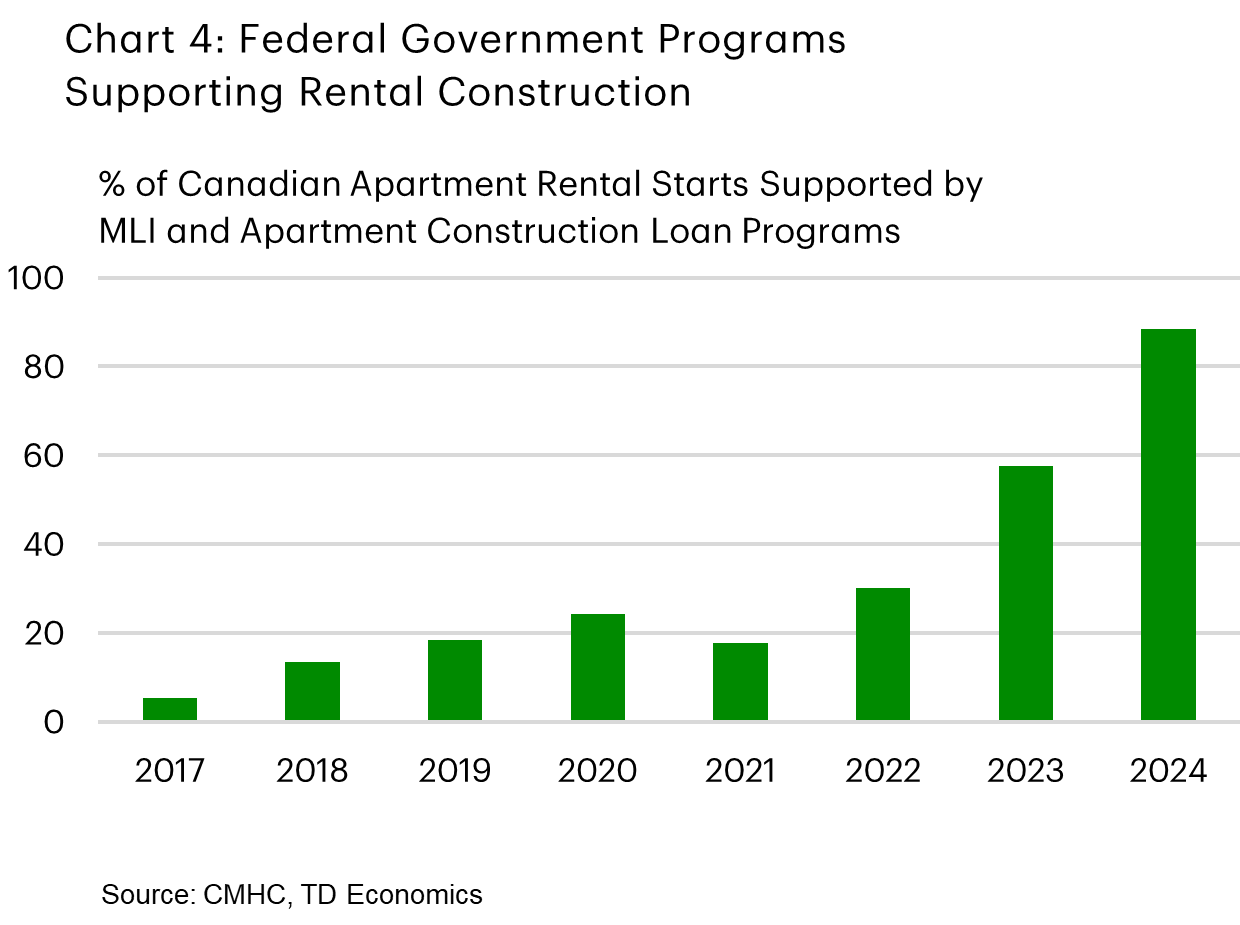
The other important caveat is that not every market is firing on all cylinders. The current, hot pace of homebuilding is being disproportionately driven by purpose-built rental units (Chart 3). Support has come through robust demand, cuts to the GST/HST that builders pay to construct these units, and federal government programs offering attractive financing - like the Apartment Loan Construction Initiative, and MLI Select (Chart 4). What’s more, some would-be condo projects have been converted to rental, due to comparatively favourable project economics. While construction of these units has helped cool rent growth - supporting affordability for renters - building of other, ownership-based units has lagged.
Location, Location, Location
Housing trends can typically vary widely by region, but there’s some regional synchronicity in the current homebuilding cycle. Indeed, starts are holding at or above long-run averages in every market except Ontario (Chart 5).
Looking across Canada:
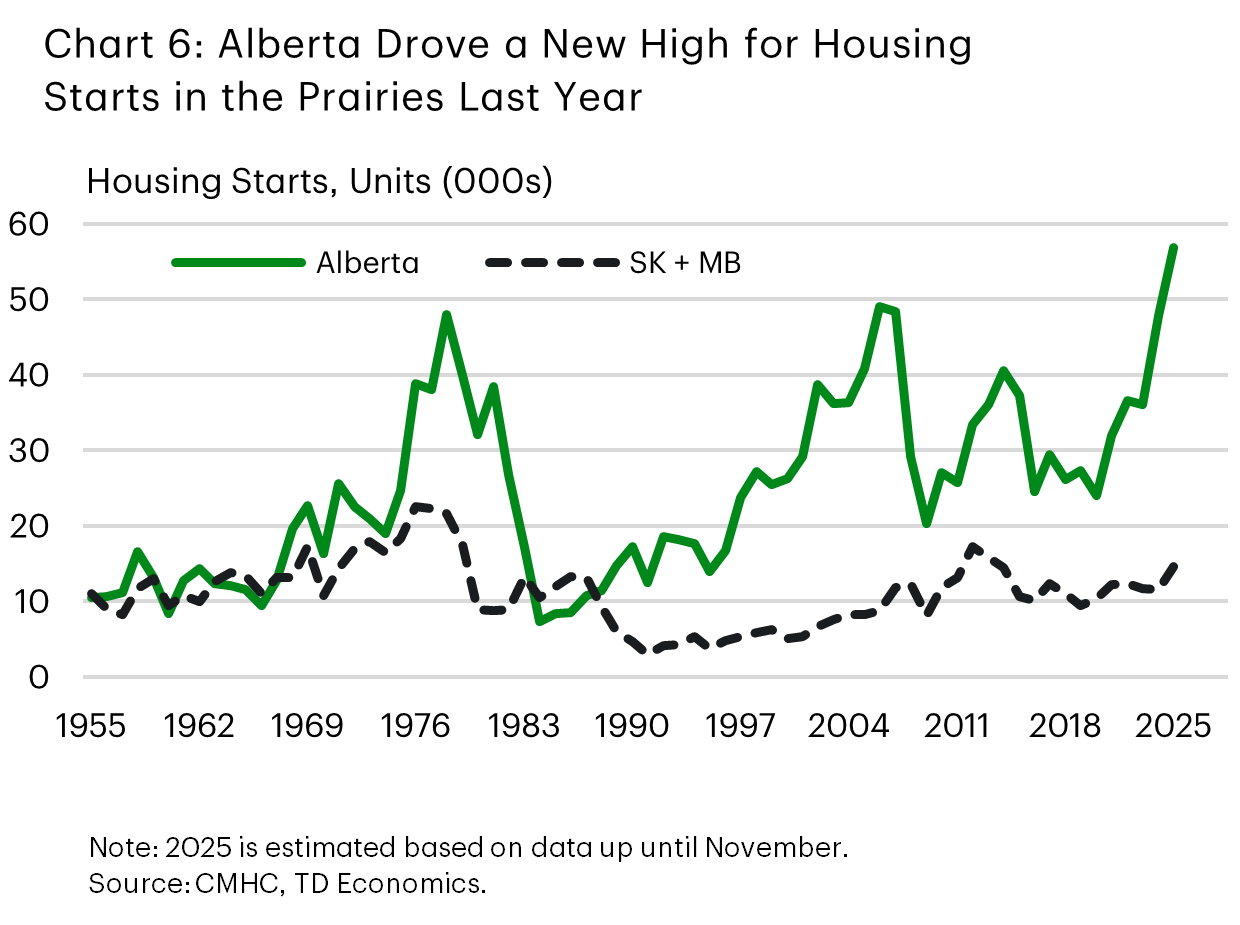
Healthy Homebuilding in Prairies
In the Prairies, starts are extremely elevated (Table 1, Chart 6). Starts are running above long-term averages in Saskatchewan and Manitoba (driven by rental construction), but Alberta has been the overwhelming force behind this record performance. Rental construction has been very strong in Alberta, supported by nation-leading population growth and relatively firm job gains, particularly for younger populations who are more likely to be renters. Notably, employment was up 2% in 2025 for the 20-34 age group, following an 8% gain in 2024. More recently, rents have stopped surging in Alberta, amid cooling population growth, but were still an average of 35% higher in Calgary and Edmonton, relative to their pre-pandemic level, in 2025Q3. In the ownership market, there was a solid rise in the construction of semi-detached and row housing last year. Calgary and Edmonton have recently changed zoning by-laws to allow more diverse supply on lands that were previously zoned for single-family homes, which could be helping this trend.
| Table 1: Housing Statistics | ||||||
| Starts (Ann, 000s, 6-mma, Dec 2025) | Starts (Ann, 000s, 6-mma (1990-2025 average) |
Purpose-built Rental Starts (% Share of 2025 Total)* | Condo Starts (% Share of 2025 Total)* | Ground-oriented Starts (% share of 2025 Total)* | Completions (Dec-25 diff from 2011-2025 average, %)* | |
| Canada | 264.4 | 197.7 | 50% | 24% | 26% | 39% |
| ON | 70.6 | 70.1 | 39% | 31% | 30% | 20% |
| QC | 60.1 | 42.5 | 85% | 0% | 15% | 50% |
| BC | 44.7 | 32.7 | 41% | 49% | 10% | 105% |
| AB | 51.2 | 31.6 | 38% | 20% | 42% | -15% |
| Atlantic | 22.6 | 11.1 | 75% | 0% | 25% | 180% |
| SK + MB | 15.1 | 9.6 | 44% | 16% | 40% | -17% |
Rental Construction Prolific in Quebec and the Atlantic
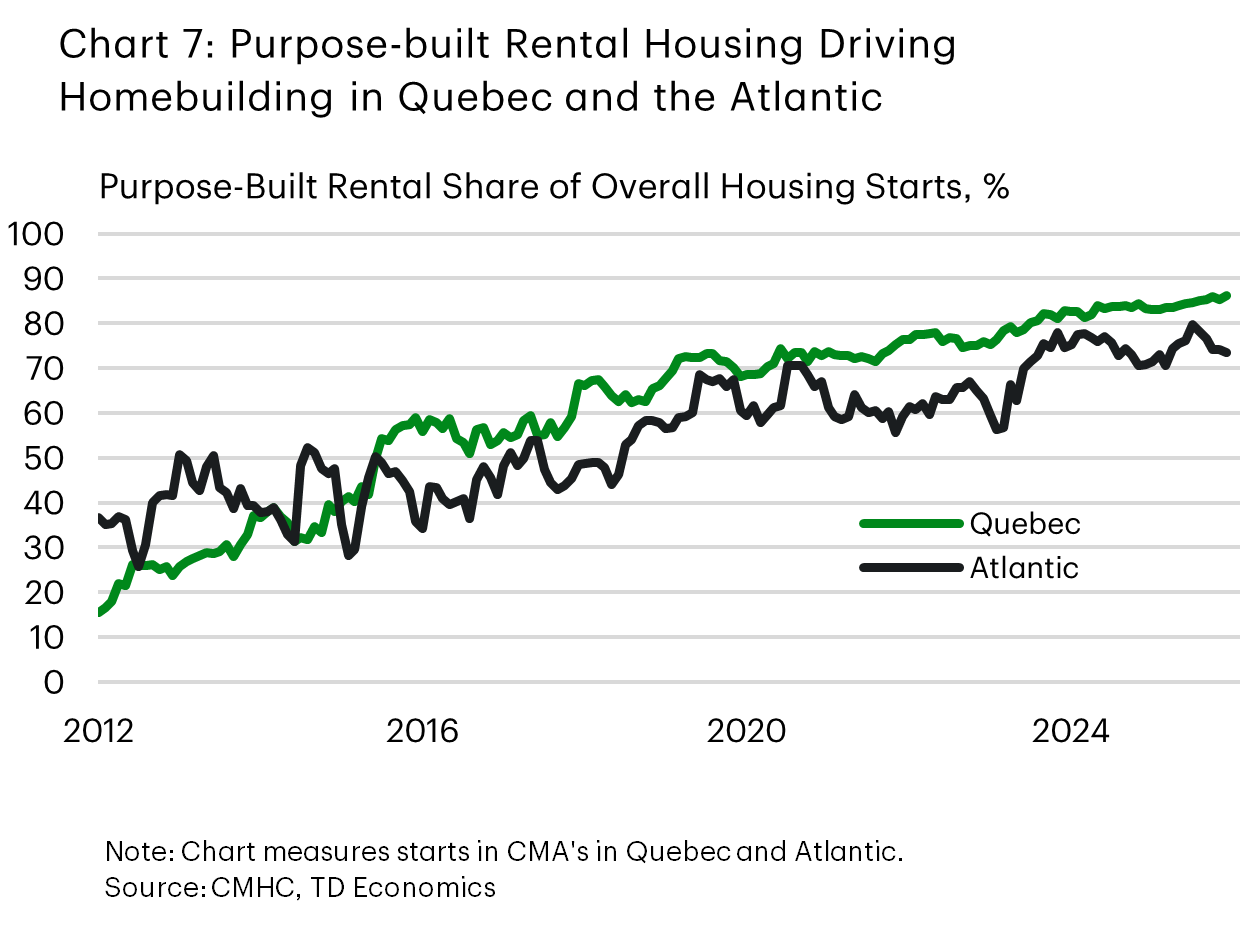
Statistics Canada data1 suggests that construction costs haven’t risen as much in Quebec as some of the other large provinces like Alberta and Ontario (Table 2), supporting a healthy pace of starts. There’s been a mild increase in starts of ground-oriented units, consistent with high home prices and low levels of unsold inventories. The propensity to rent has typically been higher in Quebec than other parts of the country. However, homebuilding has become dominated by purpose-built rental construction (Chart 7), likely supported by significant ownership affordability deterioration. Asking rents are highly elevated (about 60% above their pre-pandemic levels), driven by low vacancy rates and past population growth. However, rent growth cooled to 2% last year from 9% in 2024, even with the Tribunal administratif du logement’s record rent increase recommendation of 5.9% for 2025.
While the Atlantic region is much smaller than Quebec, we’ve grouped it in with la belle province because it shares many of the same dynamics. For instance, housing starts saw a robust gain in 2025 and construction has been overwhelmingly skewed towards rental units, driven by the same factors as Quebec. Also mirroring Quebec, ownership units have seen a smaller gain in starts this year, supported by low unsold inventories and high home prices.
| Table 2: Housing Statistics (Continued) | ||||||
| Units Being Built (Dec-25 diff from 2011-2025 average, %)* | Rental Vacancy Rate (% Diff, 2025 vs 1995 - 2025 Average)* | Asking Rent ($, Monthly rent, 1-bedroom, 2025Q3)** | NHPI (% Diff, Nov-25 from Feb-20, i.e. pre-pandemic)*** | Average Resale Price ($000s, Dec 2025) | Building costs (% Diff, 2025Q4 from 2019Q4, i.e. pre-pandemic) | |
| Canada | 49% | 7% | 1581 | 20% | 689 | 69% |
| ON | 30% | 21% | 1725 | 15% | 832 | 84% |
| QC | 42% | -1% | 1276 | 41% | 559 | 55% |
| BC | 61% | 46% | 1841 | 17% | 953 | 51% |
| AB | 65% | 14% | 1378 | 28% | 524 | 78% |
| Atlantic | 138% | -40% | 1402 | 23% | 398 | 54% |
| SK + MB | 49% | 0% | 1283 | 38% | 382 | 54% |
British Columbia Holding Firm
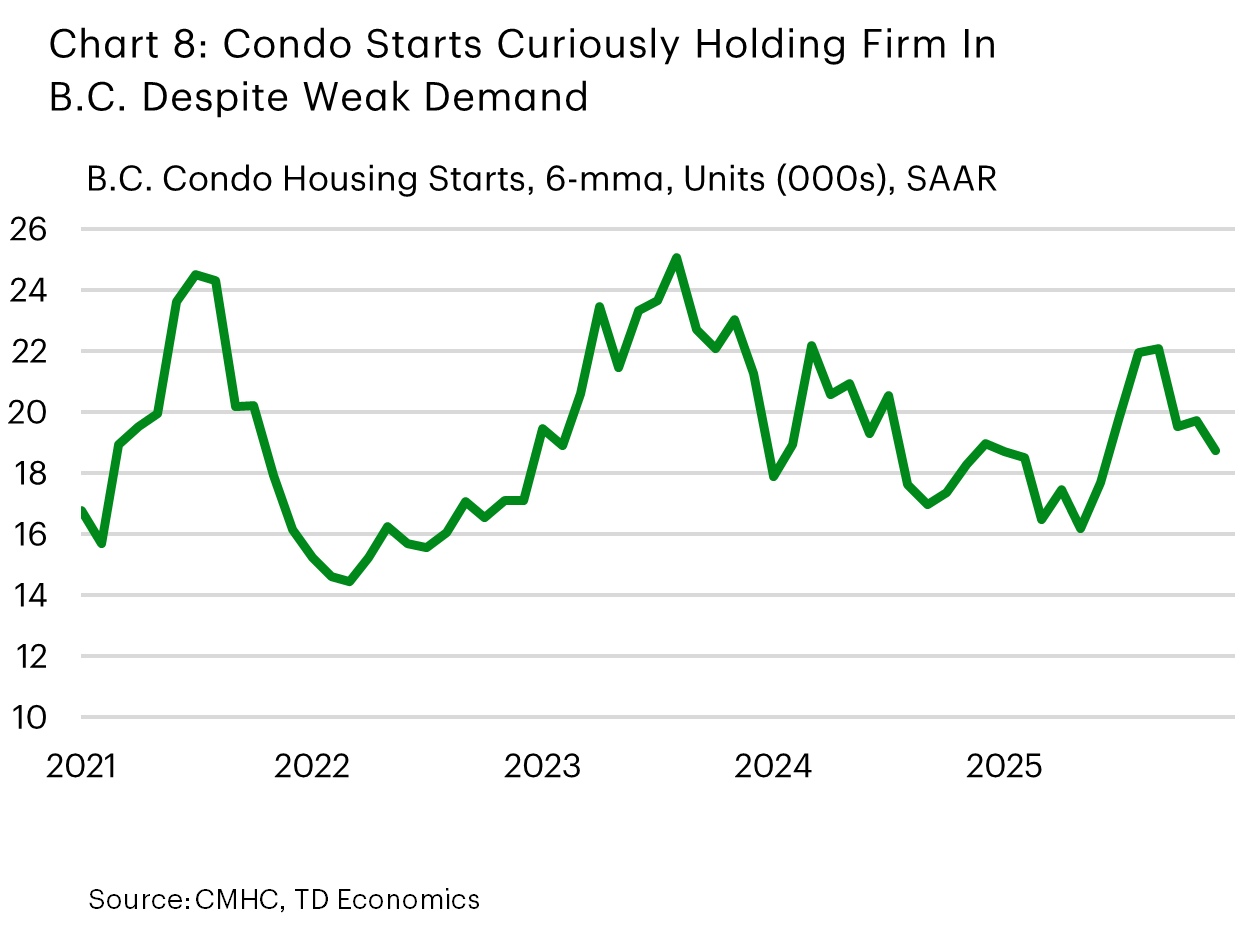
While elevated, starts dropped last year in B.C. on a dip in detached/semis/towns and condos and a steeper decline in rental construction. No gains in the first category make sense amid a weak demand backdrop and falling prices. For instance, in the resale market, per capita home sales are 35% below long-term averages. What’s more peculiar, however, is that condo starts haven’t fallen by more (Chart 8). As condo demand is seemingly holding up better in the GVA than in the GTA, we wouldn’t expect as precipitous a decline in construction as we’ve seen in Ontario (see next section), but we would certainly expect condo building to be weaker than the modestly lower performance we saw in 2025. It should be noted that new home prices have only dropped about 5% from their 2022 level (which would support project profitability), per unit construction costs in major B.C. markets aren’t as high as they are in Ontario (where new home prices are also lower), and they haven’t seen as much of an increase compared to Ontario over the past several years. Still, with demand persistently low, it may just be a matter of time before we see a more meaningful downtrend in condo building. Notably, internal intelligence suggests that current conditions are softer in the GVA condo space that what the starts data (which again, can offer a lagged picture) are showing.
Purpose-built rental construction pulled back in 2025 after a healthy 2-year run, but remains elevated. Support has come from Vancouver’s Housing Strategy, targeting 20k purpose-built rental units from 2018 – 2027. Vancouver’s updated strategy bumps this target up to 30k units from 2024 to 2033. The province’s “BC Builds” program (which aims to speed up development) has also helped lift purpose-built rental construction since its inception in 2024.
Ontario Stands Alone
In Ontario, housing starts have seen some recovery from the very subdued levels seen early in 2025. Still, the province is the weakest in Canada (relative to its own history) and starts are trending at levels observed between 2015-2019, before 1) ultra-low interest rates helped super-charge pandemic-era activity and 2) the 2022-2024 population surge.
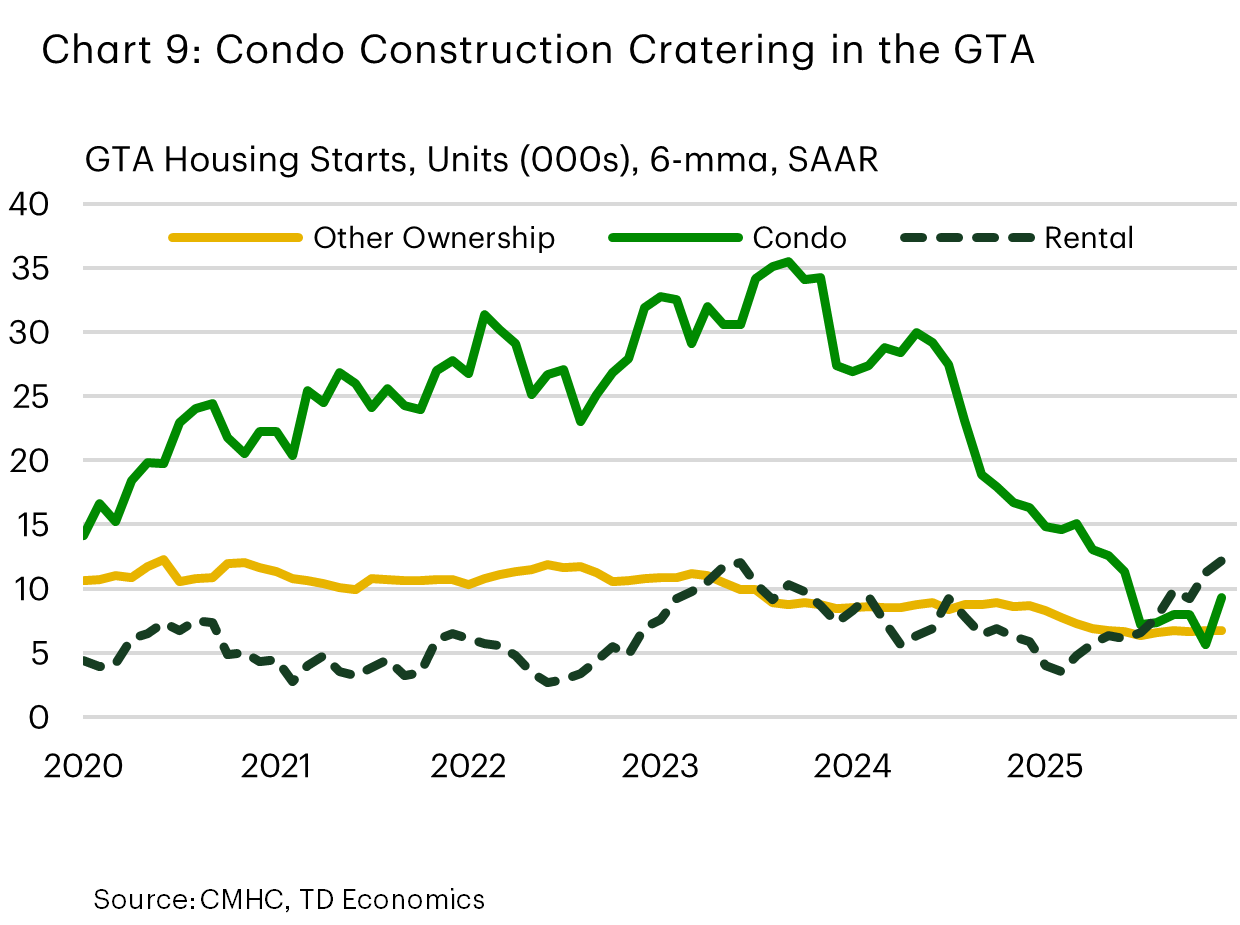
In the GTA, condo construction is trudging rock bottom-depths, with starts trending near their lowest level since the Global Financial Crisis (Chart 9). Condo pre-sale activity is equally challenged in Toronto, likely impacted by a swoon in investor activity. Rising interest rates have simultaneously made these units more difficult to buy and made it more challenging for investors to who had pre-qualified at lower, pandemic-era interest rates, to close on their properties. At the same time, falling condo prices reduced attractiveness of these assets in the eyes of investors, especially with supply piling into the market after years of robust construction activity, and rents falling amid sharply decelerating population growth.
At the same time, construction of other types of ownership housing is muted. Statistics Canada data suggests that new home prices have declined 8% from their peak in 2022. Further price declines would improve pre-sale activity, but there’s limits as to how much they can drop while keeping projects viable. Toronto is a high cost jurisdiction (and, relative to pre-pandemic levels, construction costs in Ontario have likely seen the largest increase of any region in the country) owing to factors like input prices and government fees. An increase in purpose-built rental construction is providing partial offset, but total GTA starts are trending their lowest level since the first wave of the pandemic in 2020.
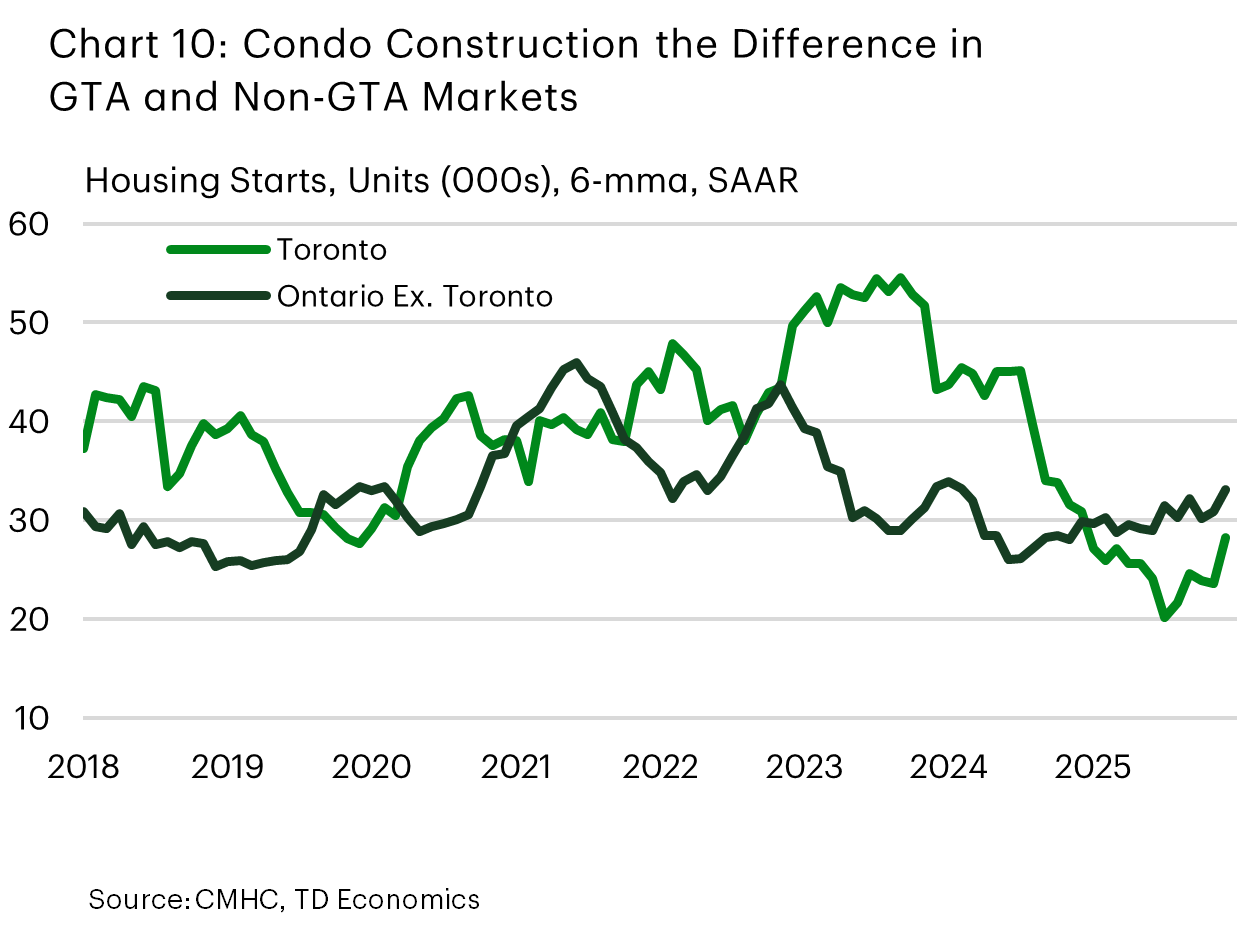
The situation is better outside of Toronto, supported by a flatter-trend in condo construction and a rise in purpose-built rental units (Chart 10). Indeed, the trend is firmer than the GTA in Eastern and Northern Ontario as well as places like Kitchener and London.
Canadian Homebuilding set to Ease
We see the pace of housing starts easing across most jurisdictions over the next couple of years (Table 3). The recent momentum in labour demand is likely to soften amid sub-trend economic growth. Note that interest rates will likely be neutral for the outlook, as we don’t envision much movement in bond yields going forward, and believe that the Bank of Canada won’t change its policy rate.
| Table 3: Canadian Housing Starts | |||
| Housing Starts | 2025 | 2026 | 2027 |
| Canada | 258.5 | 242.5 | 228.8 |
| ON | 65.2 | 60.7 | 64.1 |
| QC | 59.4 | 57.2 | 51.9 |
| BC | 44.2 | 41.4 | 44.7 |
| AB | 55.0 | 52.2 | 43.0 |
| Atlantic | 20.7 | 18.1 | 13.9 |
| SK + MB | 14.0 | 12.9 | 11.3 |
The largest drag on housing demand will come through population growth which should be weak through 2027 and will weigh first and foremost on the rental market. However, with the rate of household formation set to slow to a trickle this year and remain low in 2027, we think that the housing supply gap will be closed sometime next year. If we’re right, this will be a remarkable turnaround from where the country was as early as last year. An important point here is that while housing completions are likely to make-up for their prior shortfall, they will probably need to be amped up even further, on a sustained basis, if affordability were to be restored to its pre-pandemic level (see report).
On the more supportive side for construction will be the federal pledge (matched by Ontario) to cut the GST/HST for first-time homebuyers on the purchase of new homes valued at under $1 million. This policy change is not yet in force but could be in first half of 2026. If it is indeed passed into law, our models suggest it could offer a boost of about 3k home sales across Canada in 2026, lifting starts above what they otherwise would have been in 2027 and 2028.
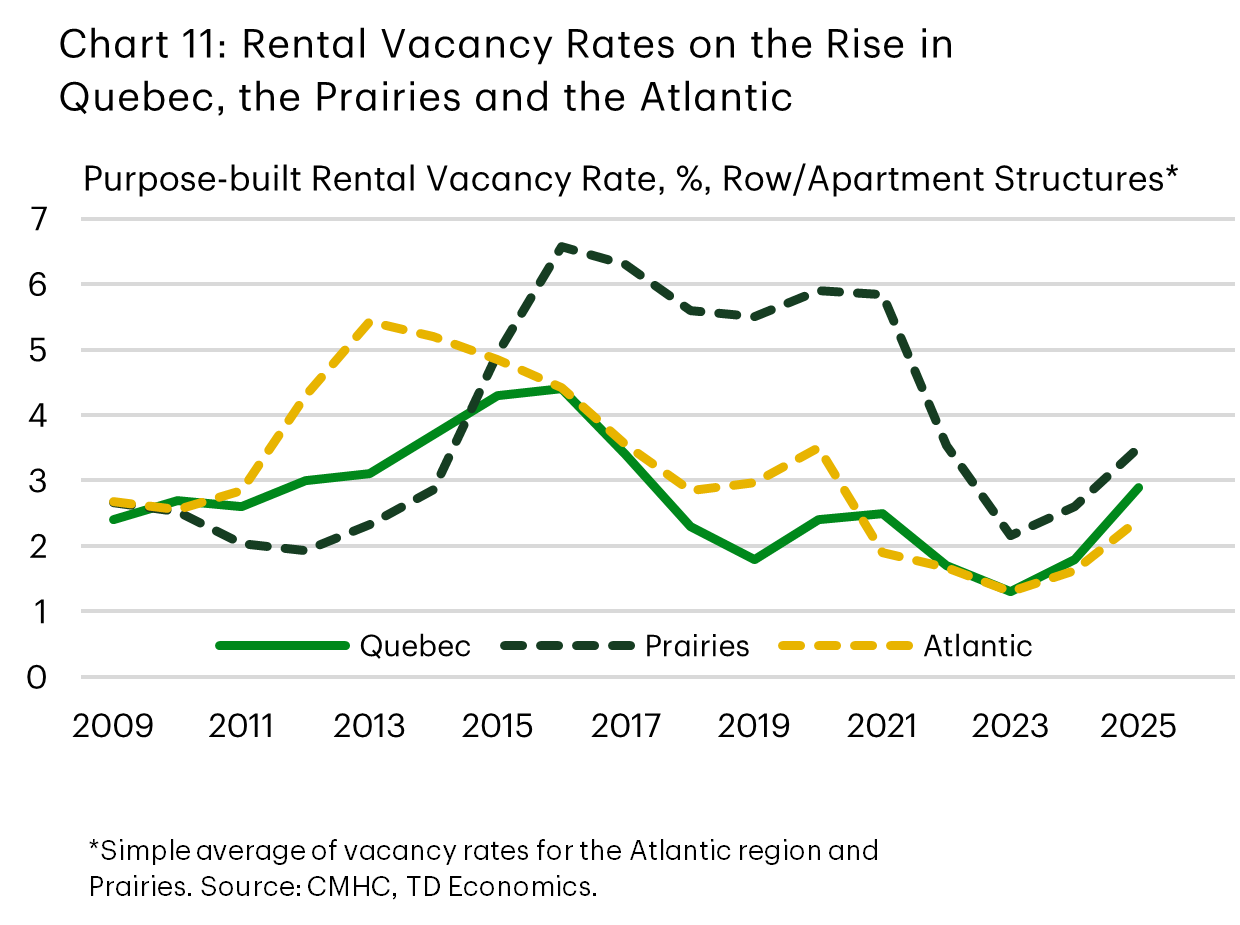
Across regions, purpose-built rental construction will likely drive go-forward trends in the Atlantic, Quebec, and even in the Prairies. We think it will cool a touch in these provinces from its super-heated, likely unsustainable 2025 pace. Note that rental construction has momentum in these markets and vacancy rates only begun to turn meaningfully higher in 2025 (Chart 11). Accordingly, it could take until 2027 until we see a deeper slowdown, even as vacancy rates see more upward pressure from a wave of completed rental projects in these regions. Preventing an even steeper drop will likely be a steady rise in demand for ownership units, supported by continued household income growth. Ownership affordability is also still decent, relative to historical norms, in most of the Prairies and Newfoundland and Labrador.
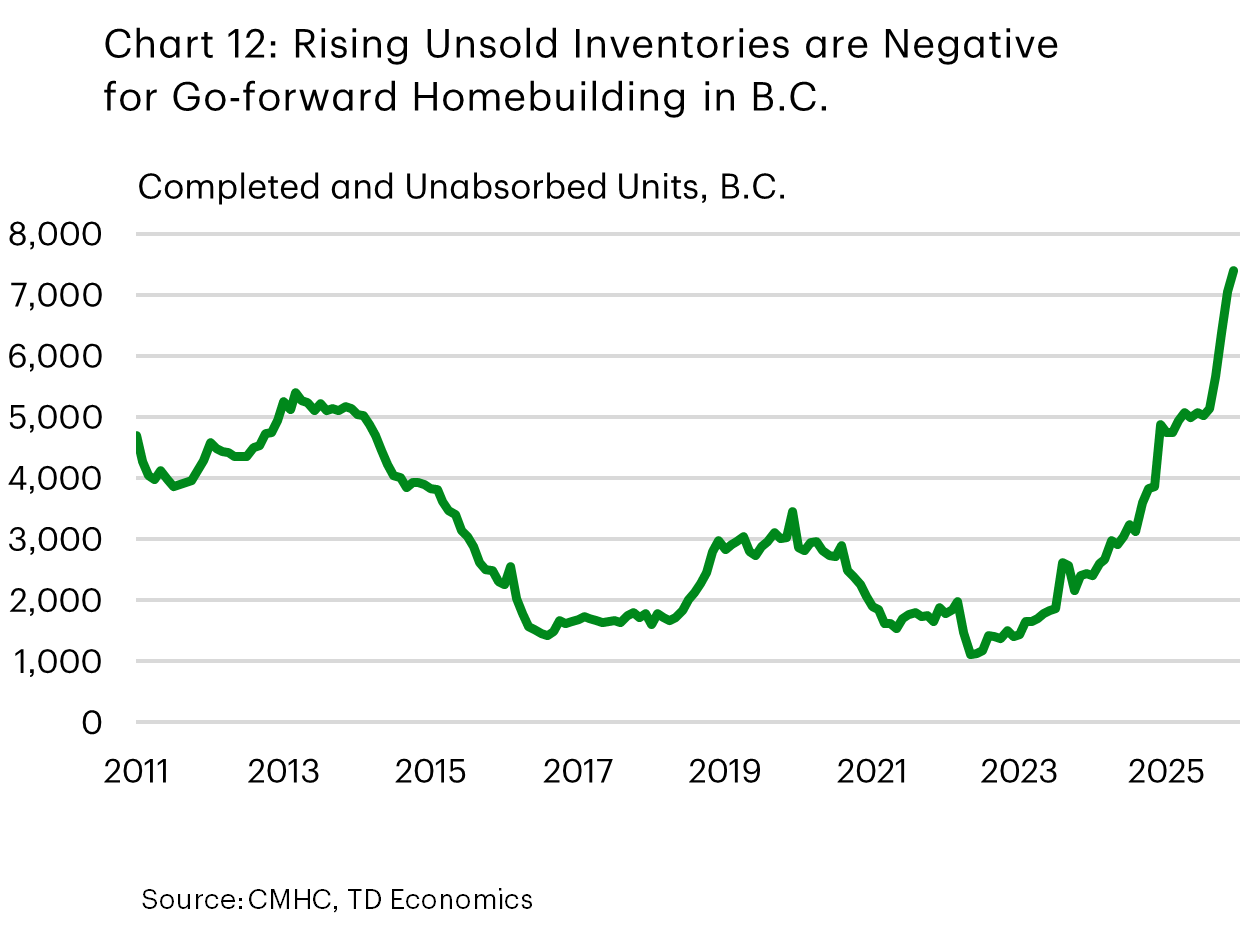
We see housing starts dipping below their 2025 levels in B.C. this year. The extremely elevated level of completed and unabsorbed units in key markets like Vancouver and Victoria suggest some ramp down in condo construction is likely (Chart 12). At the same time, rental construction could be downwardly pressured by rental vacancy rates that climbed to their highest level since 2000 in 2025. However, government programs, like B.C. Builds, will likely provide some offset to these forces. In 2027, we think starts could improve a touch, as housing demand picks up over the next few years, supported by pent-up demand and improving economic conditions.
In Ontario, housing starts are likely to trend around their 2025 lows for the next few years, restrained by the GTA. Industry data2 indicates that pre-construction sales dropped about 35% for single-family homes in the region last year. Meanwhile, they were down by an even more pronounced 55% for condo units, with the 2k units sold being 90% below the 10-year average. These sales ultimately become starts, so the go-forward picture is bleak. Furthermore, while the number of condo units under construction in the GTA is dropping, there are still about 55k units being built. Once complete, these units could add to the climbing stock of completed and unabsorbed units, further discouraging building activity. In the rental market, construction probably won’t be nearly as soft, but asking rents have fallen in the GTA and surrounding areas (down about 4-8% from recent peaks in the GTA, Hamilton, and Kitchener-Waterloo-Cambridge), and vacancy rates are creeping higher (though are still below long-run norms).
In terms of risks to the outlook, the federal government has established Build Canada Homes (BCH), whose mandate is to support the construction of affordable housing and generate demand for “innovative and sustainable” building methods, such as prefabricated construction. The Parliamentary Budget Office estimates that BCH could generate 26k homes over 5 years (a 2% annual boost to housing starts at their current trend)3. However, given that it’s still early days for BCH, we treat it as an upside risk to the forecast. The federal budget also introduced the Build Communities Strong Fund, which includes a $17 billion stream for housing-enabling infrastructure. To access this infrastructure, provinces will need to provide cost-match funding, substantially reduce development charges, and not levy other taxes that hinder the housing supply.
The BCH rollout also comes at a time when federal funding for other housing programs is being cut, which would be a counterweight4.
Bottom Line
Canadian homebuilding is robust, propped up by purpose-built rental construction.
Regionally, housing starts are above long-term norms in every market but Ontario. Purpose-built rental construction has lifted markets everywhere, while elevated home prices have also supported construction of ownership units in markets outside of Ontario.
Canadian housing starts are likely to trend lower moving forward, weighed down by slowing population growth, climbing rental vacancy rates, rising unsold inventories in key markets like B.C. and weak pre-sales activity in Ontario.
End Notes
- The data referenced is Statistics Canada’s Building Construction Price Index. The Building Construction Price Indexes are quarterly series that measure change over time in the prices that contractors charge to construct a range of new commercial, institutional, industrial and residential buildings. The contractor’s price reflects the value of all materials, labour, equipment, overhead and profit to construct a new building. It excludes value-added taxes and any costs for land, land assembly, building design, land development and real estate fees. The measure isn’t a complete picture of costs, because of what it excludes and because it includes contractor profits. However, it’s used in this report because of its timeliness and availability. We assumed that contractor profit margins are similar over time and across regions, so variations in the metric would more represent cost changes.
- BILD, New Homes Monthly Market Report, https://www.bildgta.ca/wp-content/uploads/2026/01/BILD-New-Home-Sales-Media-Backgrounder-December-2025-Altus-Data-Solutions-FINAL.pdf, December 2025
- Office of the Parliamentary Budget Officer, Build Canada Homes and the Outlook for Housing Programs Under Budget, https://www.pbo-dpb.ca/en/publications/RP-2526-020-S--build-canada-homes-outlook-housing-programs-under-budget-2025--maisons-canada-perspectives-entourant-programmes-logement-dans-cadre-budget-2025, December 2, 2025.
- Ibid.
Disclaimer
This report is provided by TD Economics. It is for informational and educational purposes only as of the date of writing, and may not be appropriate for other purposes. The views and opinions expressed may change at any time based on market or other conditions and may not come to pass. This material is not intended to be relied upon as investment advice or recommendations, does not constitute a solicitation to buy or sell securities and should not be considered specific legal, investment or tax advice. The report does not provide material information about the business and affairs of TD Bank Group and the members of TD Economics are not spokespersons for TD Bank Group with respect to its business and affairs. The information contained in this report has been drawn from sources believed to be reliable, but is not guaranteed to be accurate or complete. This report contains economic analysis and views, including about future economic and financial markets performance. These are based on certain assumptions and other factors, and are subject to inherent risks and uncertainties. The actual outcome may be materially different. The Toronto-Dominion Bank and its affiliates and related entities that comprise the TD Bank Group are not liable for any errors or omissions in the information, analysis or views contained in this report, or for any loss or damage suffered.
Download
Share: