Part of a Cycle: A Recession Primer
Maria Solovieva, CFA, Economist | 416-380-1195
Date Published: March 9, 2023
- Category:
- Canada
- Financial Markets
- Labour
- Consumer
Highlights
- Recession chatter has prompted numerous questions about recessions, and how they are predicted. In this primer, we demystify what a recession is, and what we are looking for to determine if that is where the economy is headed.
- A commonly used rule of thumb is two consecutive quarters of contraction in real Gross Domestic Product (GDP). In practice, economists look at a wider swath of indicators to determine if a decline in economic activity has been significant enough to call it a recession.
- There are a variety of signals we watch to gauge the risk of recession, including market-based and leading economic indicators.
- The key thing to remember about recessions is they are temporary – lasting 11 months on average. The natural state of the economy is to growth, recessions are just part of the cycle.
Since last summer, recession chatter has reached a fevered pitch. More than half of economists surveyed by Bloomberg are predicting that a recession is imminent over the next year. This is an understandable response to the historically aggressive interest rate hikes central banks have unleashed over the past year to wrestle inflation back down from its 40 year-highs. This has prompted numerous questions about recessions in general and how they are predicted. Here we will attempt to demystify what a recession is, and what we are looking for to determine if that is where the economy is headed.
To hear more about recessions from our Chief Economist, Beata Caranci, see this video.
What is a recession?
In the U.S., recessions are declared by a committee of experts at the National Bureau of Economic Research (NBER), which defines a recession as “a significant decline in economic activity that is spread across the economy and that lasts more than a few months.” More specifically three criteria need to be met to some degree – depth, diffusion, and duration – to call a recession. Although extreme conditions revealed by one criterion may partially offset weaker indications from another.
One commonly used rule of thumb is two consecutive quarters of contraction in economic activity as measured by GDP. However, that definition can lead us astray. For example, by that rule the U.S. was in recession in 2022 when GDP contracted in the first two quarters of the year. However, employment made sizeable gains keeping the unemployment rate near a 55-year low – hardly recessionary conditions. This is why the NBER looks at a wider swath of indicators, which are real personal income ex-transfers, nonfarm payroll and household survey employment, real personal consumption expenditures, wholesale/retail sales adjusted for inflation, and industrial production. The NBER does not have a fixed rule about how each measure is weighted in their decision. However, real personal income ex-transfers, nonfarm payroll employment have carried the most weight in recent decades.
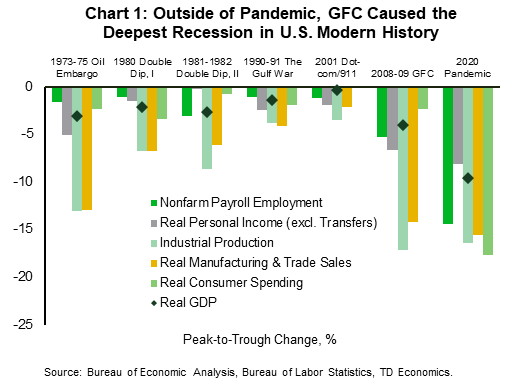
Since the Great Depression, which lasted 44 months from August 1929 to March 1933, there have been 14 official recessions in the U.S. that lasted 11 months, on average. Over this period, the longest was the Global Financial Crisis (GFC), which lasted 19 months from December 2007 to June 2009 and the shortest one was the recent pandemic recession that lasted three months. Out of the six recessions between 1970 and 2020, the GFC was the most severe as measured by these economic factors (Chart 1).
In Canada, recession determinations are a little bit different. In practice, economists rely on the C.D. Howe Institute’s Business Cycle Council determination of cycle dates. Like NBER, the Council takes a three-dimensional approach in its analysis (duration, amplitude and scope), defining a recession as “a pronounced, persistent, and pervasive decline in aggregate economic activity”. Contrary to the famous rule of thumb, the Council asserts that a one-quarter decline in GDP could be qualified as a recession if it’s followed by weakness in contiguous quarters and accompanied by pervasive deterioration across multiple sectors of the economy. To determine this, the Council uses two diffusion indexes of GDP by industry. One uses an unweighted average of changes in different subsectors of the economy. The other relies on statistical techniques to determine the underlying trend in economic output. Finally, when measuring aggregate economic activity, the Council pays particular attention to changes in both GDP and total employment.
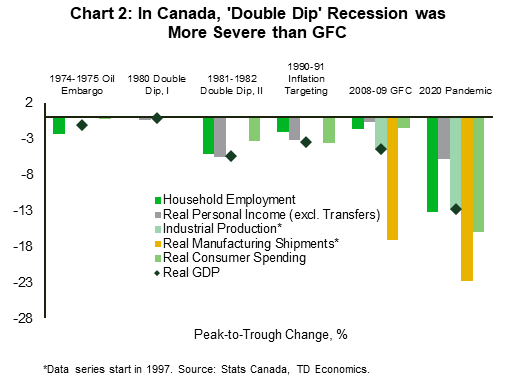
According to C.D. Howe’s methodology, since the Great Depression (which lasted 47 months in Canada) there have been 11 official recessions that lasted 11 months, on average. The Council also ranks recessions on a scale of 1 to 5 (with 5 being the most severe), and out of the six recessions between 1970 and 2020, the last three were assigned category 4. Looking only at GDP and employment figures, the most severe contraction was the double-dip recession experienced in the early 1980s, when a combination of an oil price shock, high inflation, and the resulting significant tightening in monetary policy weighed on economic activity (Chart 2). The longest recession was in 1990-92, which lasted 26 months, and was the result of a then-new inflation targeting regime, exacerbated by inflationary excesses built up in the previous decade, and speculation in the real estate market accompanied high debt levels.
How can we tell if a recession is coming?
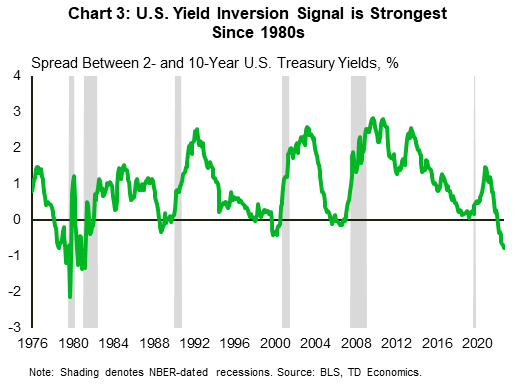
Most investors want to know when a recession is coming. There are plenty of market-based indicators watched for recession signals. In the U.S., one with the strongest track record is a yield curve inversion – a point when long-term interest rate is below shorter-term ones, suggesting markets expect an economic downturn and interest rate cuts by the central bank. In the last year, the inversion between short- and long-term maturity interest rates reached the widest point since 1981 and has been in place for more than eight months (Chart 3).
Economists also look at leading indicators to suggest when a downturn may be imminent. Changes in other leading indicators – economic or financial data series that change in advance of the rest of the economy are also used to track a slowdown or a recession. For example, the Organization for Economic Co-operation and Development (OECD) calculates Composite Leading Indicators (CLIs) for 12 member and 6 non-member countries. Historically, the CLI-based business cycles and turning points align very well with periods of recessions and could be indicative of acceleration and deceleration in real GDP growth. Today, CLIs in Canada and the U.S. point to an economic slow-down. Nevertheless, it’s important to remember that the main message of CLI movements over time is the increase or decrease, rather than the amplitude of the changes. They could be useful in predicting an economic downturn but, on occasion, prove to be false. Neither do they tell us much about the potential magnitude of an economic deterioration.
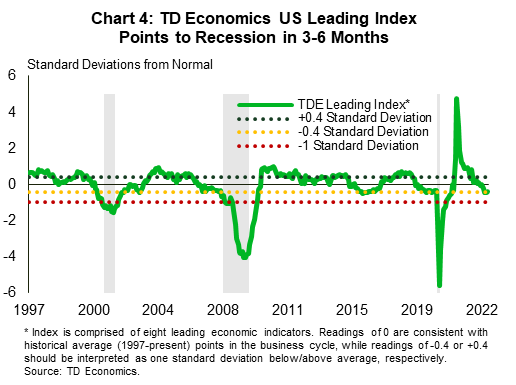
We track our own Leading Economic Indicator (LEI) for the U.S., as shown in Chart 4. It has dropped to a level that is predictive of a recession in the next three to six months. The weaker LEI is primarily driven by a contraction in durable goods orders, housing permits and the ISM Manufacturing Index. However, it’s important to note that this level has sent a false signal, as was the case in 2015-2016.
A relatively newer way to tell if a recession has started in the U.S. is by comparing the three-month average unemployment rate relative to its lowest level of the previous year. This rule, named after Claudia Sahm, a former Federal Reserve and Council of Economic Advisors economist, stipulates that if the difference reaches half a percentage point, the economy has just or is about to enter a period of contraction. While the level of unemployment rate is regarded as a lagging indicator, the data is released sooner than other indicators and can provide a clean signal for a recession before it officially began. Based on this rule, the economy is not near a recession yet.
Each recession is unhappy in its own way
Paraphrasing a classic, all expansions are equally happy; each recession is unhappy in its own way. Surely, there are similarities among downturns, but each recession is triggered by a unique event while its dynamic is dictated by distinctive ingredients prevailing in the economy. These ingredients could amplify severity of the downturn or absorb it – especially if accompanied by a timely implementation of targeted fiscal and monetary policies.
The pandemic recession is an obvious example of an economic fallout triggered by an extreme event, the magnitude of which didn’t predetermine its severity. The unprecedented shut-down of economic activity prompted an equally unprecedented coordinated fiscal and monetary support helped mitigate the severity, making the deepest recession since the World War II also the shortest.
In contrast, the build-up to the GFC recession was longer in the making. Its catalyst was rising interest rates that triggered a decline in U.S. house prices, which was amplified by a massive consumer debt burden that became too expensive to maintain. In the U.S., this was one of the most severe recessions in the American history and had long-lasting effects on growth. Nevertheless, the deleveraging cycle that followed the initial shock, helped U.S. families step on a more sustainable path and come out of it more financially secure. In contrast, Canada didn’t experience the same degree of severity but neither has it gone through a deleveraging cycle. As a result, Canadian households remain more financially vulnerable to an economic downturn today.
What’s in the tea leaves?
There needs to be a catalyst to trigger a downturn in the economy. Currently, the most likely candidate is more interest rate hikes than the economy can handle. Central banks’ fastest tightening cycle in the history of inflation targeting will take many months to affect the economy and prices. Unfortunately, there is considerable uncertainty about how these policy lags will play out, so we won’t know if central banks went too far with the policy rate until …well, they do.
That’s why the current risk of recession is elevated. Our forecast calls for a sizeable slow-down in consumer spending and job losses in the U.S. and Canada, and a prolonged period of sub-trend economic growth. Even if this isn’t a recession, this period will still be painful to those who lose their jobs. There are a few factors that suggest any coming downturn could be more modest than previous episodes. Consumers on both side of the border still have sizeable savings that should support consumption. Although in Canada, a big portion of it will be directed towards covering a rising cost of debt servicing – the reason we have a much softer growth outlook for the Great White North. The labor market is also coming from a period of remarkable strength. Even, with some cooling, we think the job market should remain resilient relatively to past economic slowdowns.
As Beata pointed out in the video, it’s important to remember that recessions are temporary. The natural state of the economy is to grow, and a recession is just part of a cycle.
Disclaimer
This report is provided by TD Economics. It is for informational and educational purposes only as of the date of writing, and may not be appropriate for other purposes. The views and opinions expressed may change at any time based on market or other conditions and may not come to pass. This material is not intended to be relied upon as investment advice or recommendations, does not constitute a solicitation to buy or sell securities and should not be considered specific legal, investment or tax advice. The report does not provide material information about the business and affairs of TD Bank Group and the members of TD Economics are not spokespersons for TD Bank Group with respect to its business and affairs. The information contained in this report has been drawn from sources believed to be reliable, but is not guaranteed to be accurate or complete. This report contains economic analysis and views, including about future economic and financial markets performance. These are based on certain assumptions and other factors, and are subject to inherent risks and uncertainties. The actual outcome may be materially different. The Toronto-Dominion Bank and its affiliates and related entities that comprise the TD Bank Group are not liable for any errors or omissions in the information, analysis or views contained in this report, or for any loss or damage suffered.
Download
Share: