Provincial Resale Market Outlook:
Flickers in Ontario and B.C., Cooling Elsewhere
Rishi Sondhi, Economist | 416-983-8806
Matt Palucci, Economic Analyst
Date Published: July 3, 2026
Highlights
- National sales are expected to grind higher through 2026H2, supported by pent-up demand and lower bond yields, but remain below pre-pandemic norms until the second half of 2027.
- B.C. and Ontario should see better sales momentum in the second half, although levels are likely to remain low through the forecast horizon and loose supply/demand balances should keep price growth soft into next year.
- Regional price trends remain uneven in 2026. Saskatchewan and Newfoundland and Labrador are expected to outperform, while Alberta records a sub-trend gain. Meanwhile, other parts of Atlantic Canada and Quebec are slated to ease. In 2027, price growth should remain modest across most provinces, constrained by weak population growth and only gradual improvement in labour markets.
At the halfway point of the year, we’re taking stock of resale housing markets. At the national level, recent data have tracked our prior forecasts made in March, such that we’re still expecting Canadian average home prices to dip 0.3% in annual average terms this year. Our estimate of first half price growth is roughly unchanged from March. Looking ahead, we still see subdued second half gains, consistent with loose supply/demand balances, followed by a modest acceleration in price growth in 2027.
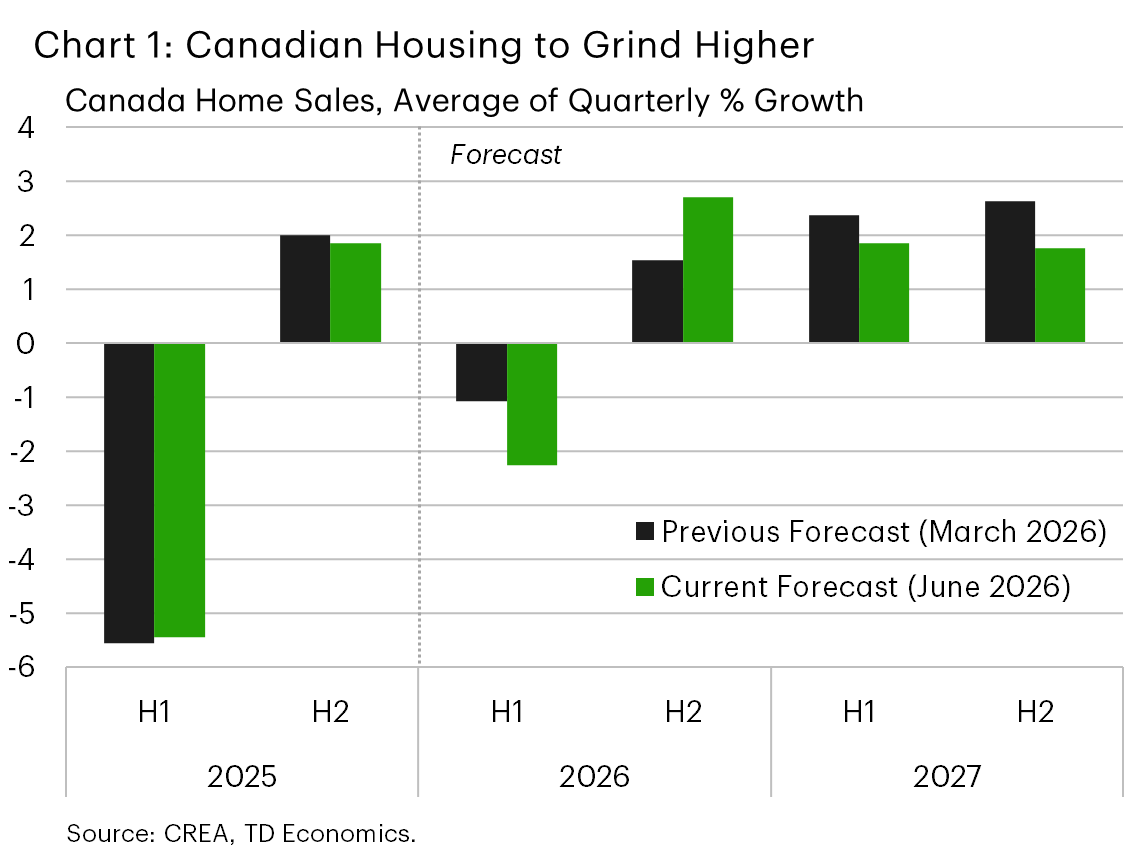
Forecasts for 2026 annual average growth in Canadian home sales have been downgraded a touch on a weaker-than-expected first quarter. However, that may have been the low point for housing, as Q2’s gain is tracking as we’d previously expected and we’ve upgraded expectations for the back half of the year (Chart 1).
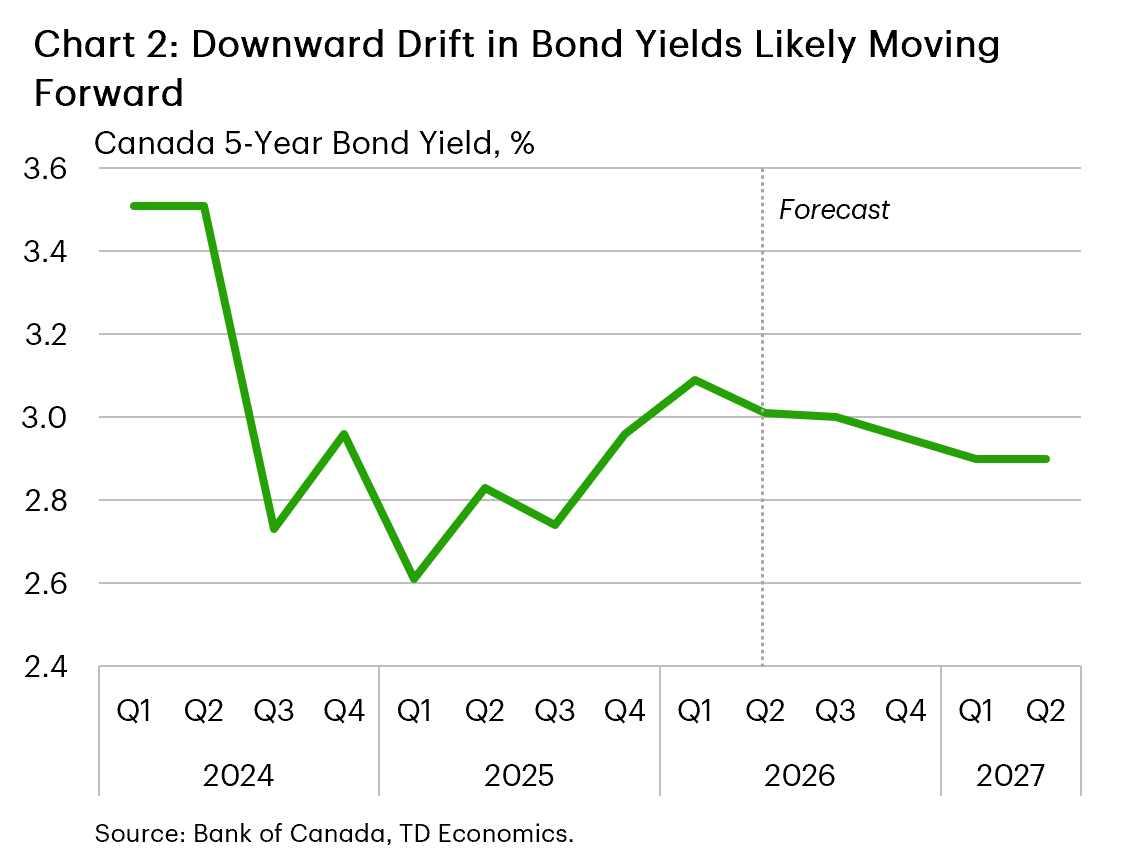
Supporting our upgraded 2026H2 Canadian home sales growth forecast is pent-up demand and some anticipated downward drift in bond yields (Chart 2). Of course, even though sales growth is likely to be positive, the level of sales should remain low. In fact, our forecast sees sales taking until 2027H2 to approach their pre-pandemic level, restrained by weak population growth and modest hiring activity over the projection horizon.
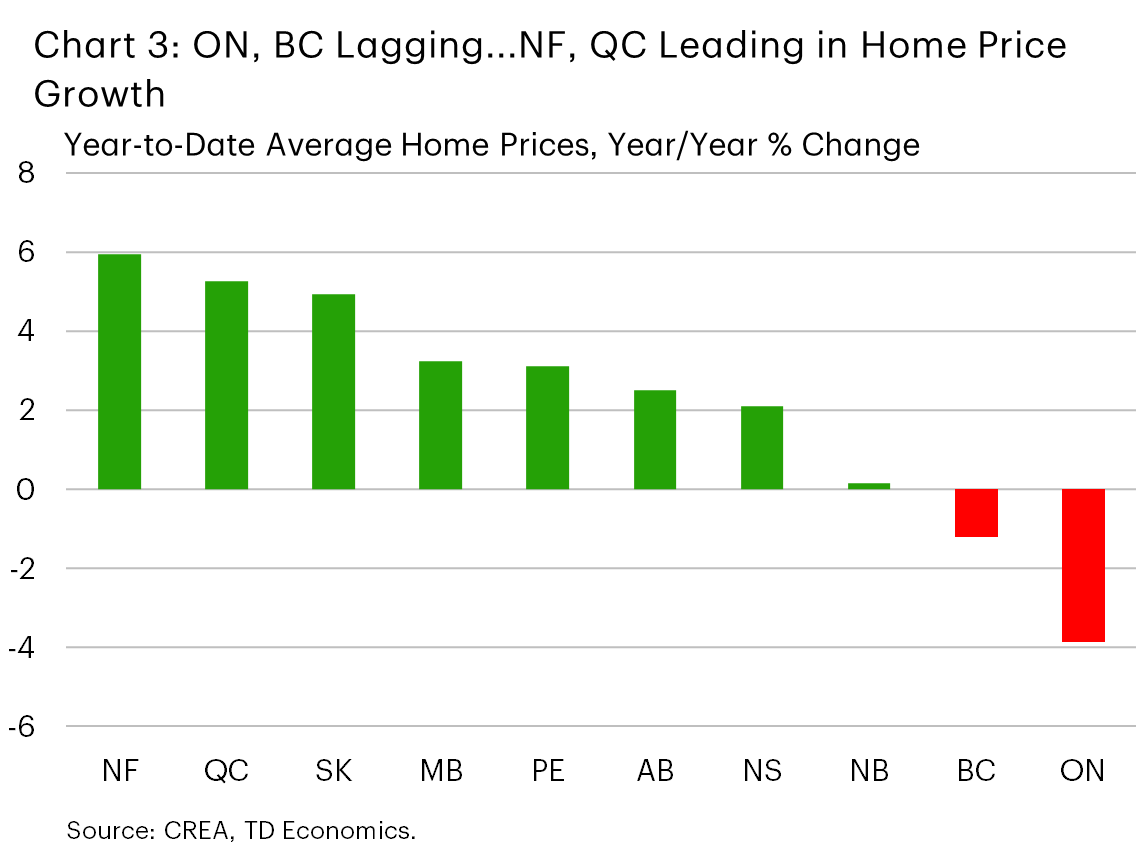
Our roughly unchanged national numbers mask some tweaks that we’ve made regionally to our forecasts. As is typically the case, price trends vary widely by region (Chart 3).
Upgraded, But Still Soft Activity in B.C. and Ontario
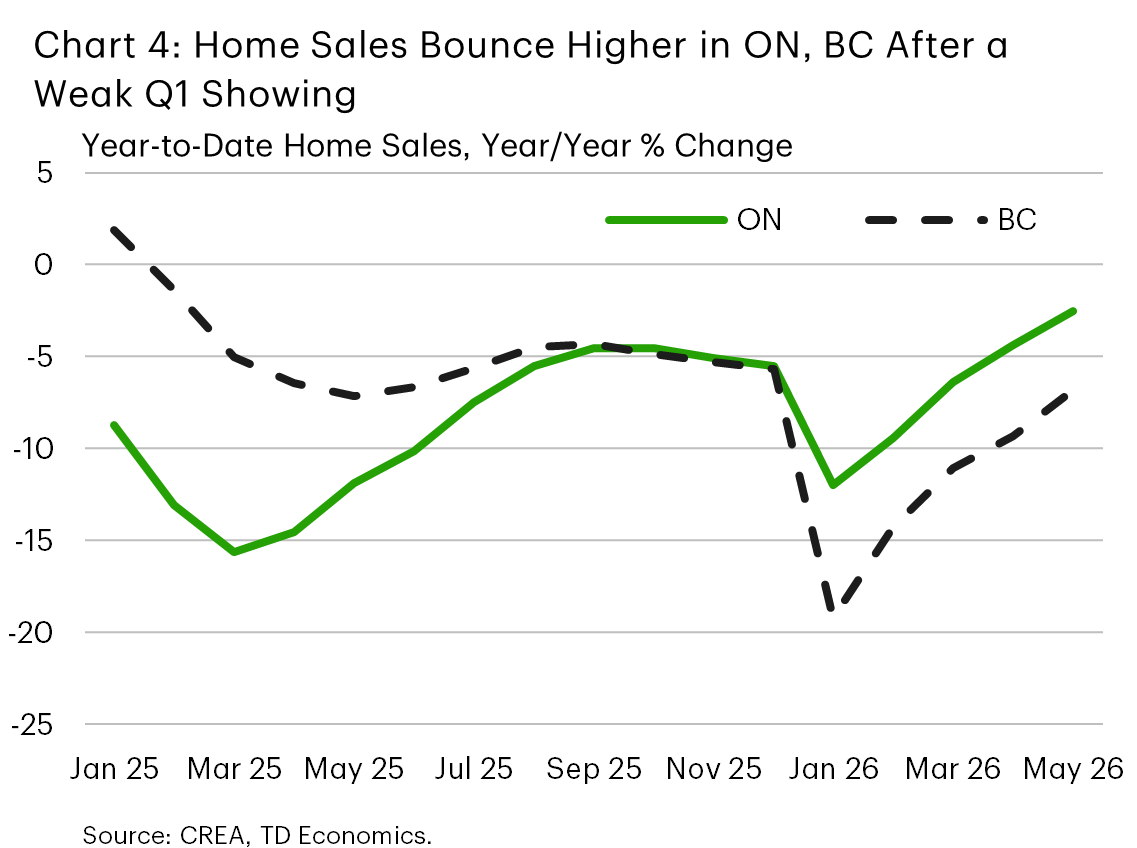
We’ve upgraded our sales growth expectations for B.C. and Ontario for 2026H2. However, part of the story is a rebound from a weaker-than-expected first half, supported by what looks to be significant pent-up demand in both markets. Price expectations between sellers and buyers may also be becoming more aligned, greasing the wheels for transactions and supporting an improving trend in activity (Chart 4). Looking ahead to next year, recent affordability improvements should support rising sales activity. Still, sales levels are likely to trail their 10-year averages in both markets by a comfortable margin.
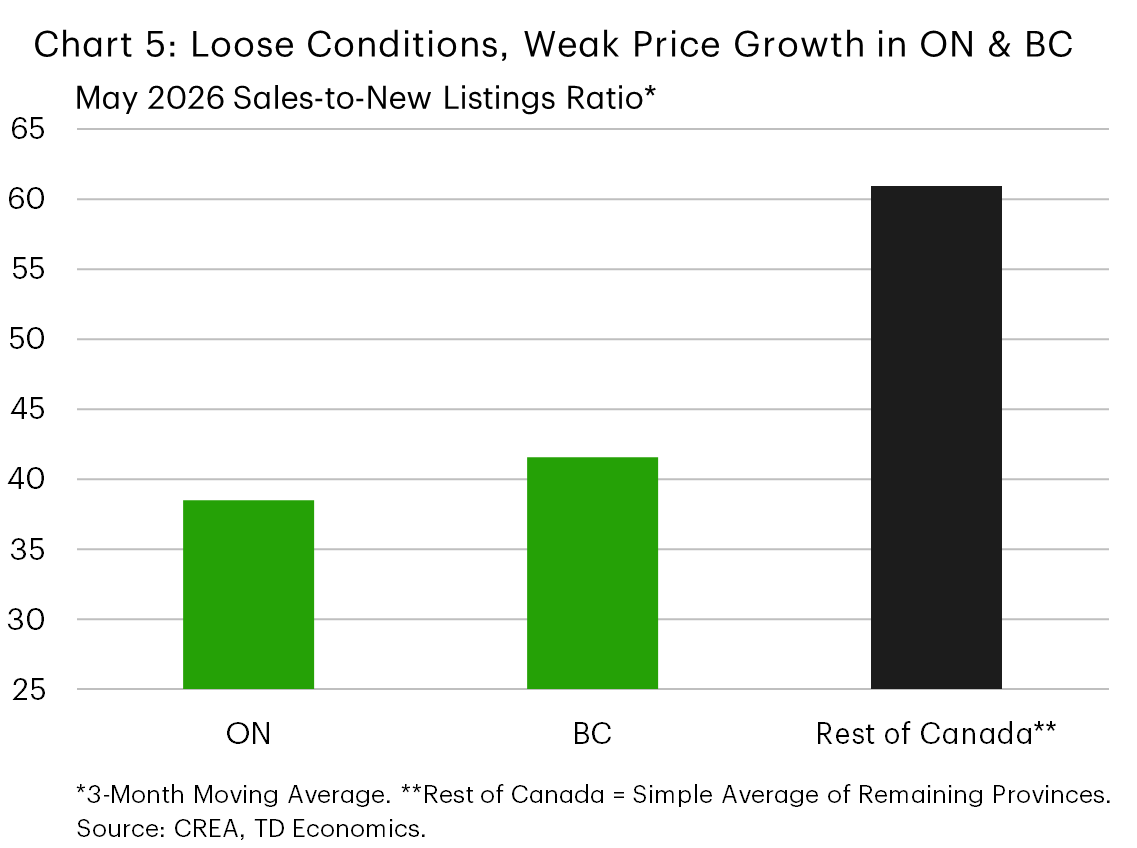
Average prices in B.C. are likely to move sideways and Ontario’s should fall further over the near term, before prices in both markets turn positive in 2027. Buyer-friendly supply/demand balances should continue to weigh on valuations (Chart 5). That said, we have upgraded our 2026H2 price growth forecast for B.C., reflecting our view that higher-priced properties will continue to outperform. This dynamic was already incorporated into our March forecast for Ontario, which we have left unchanged as incoming data has roughly tracked our expectations. Notably, condo prices in key B.C. and Ontario markets are likely to remain under downward pressure for some time (see our recent condo-focused reports here and here).
In Quebec, price growth remains firm but continues to decelerate. This partly reflects a pickup in supply, as new listings have trended higher in response to past price gains. A weaker economic backdrop is also weighing on demand, with a labour market that’s among the weakest of all provinces and a contracting population. These factors should cap the pace of sales and price growth. Indeed, our downgraded forecasts see home sales averaging no growth over 2026 and 2027 and price growth easing to below 3% by next year.
Alberta Cooling, Saskatchewan Still Heated
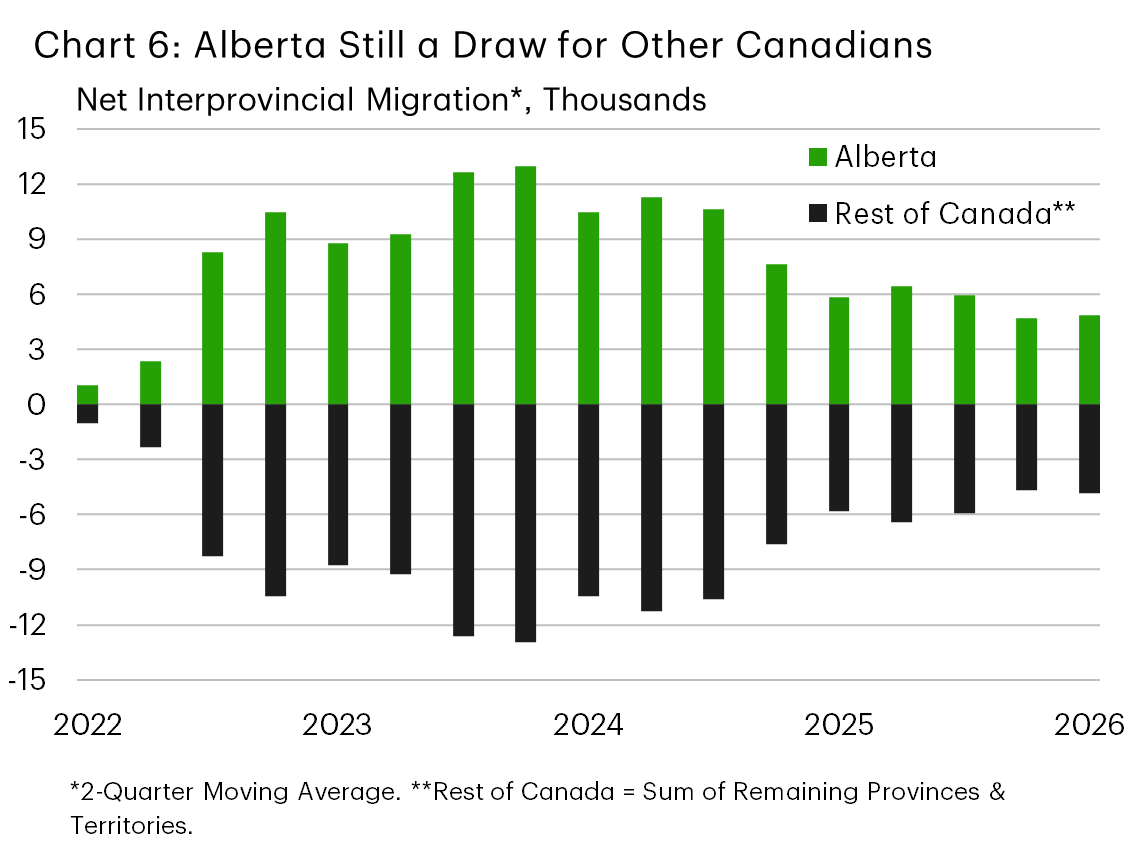
In Alberta, sales have backed off their heated 2023-2025 levels. However, this likely represents a normalization rather than something more severe, with levels more in line with long-run averages. Resale supply is also elevated - supported by high prices and huge homebuilding activity in recent years - pushing supply/demand balances towards the looser end of long-run norms. With prices up only 2.5% year-to-date, year-on-year, we’ve downgraded our forecast to a modest gain for 2026 overall. We see improved sales and price growth next year, however, as population growth, including interprovincial migration, continues to be strong (Chart 6), while hiring is solid and wage growth is robust.
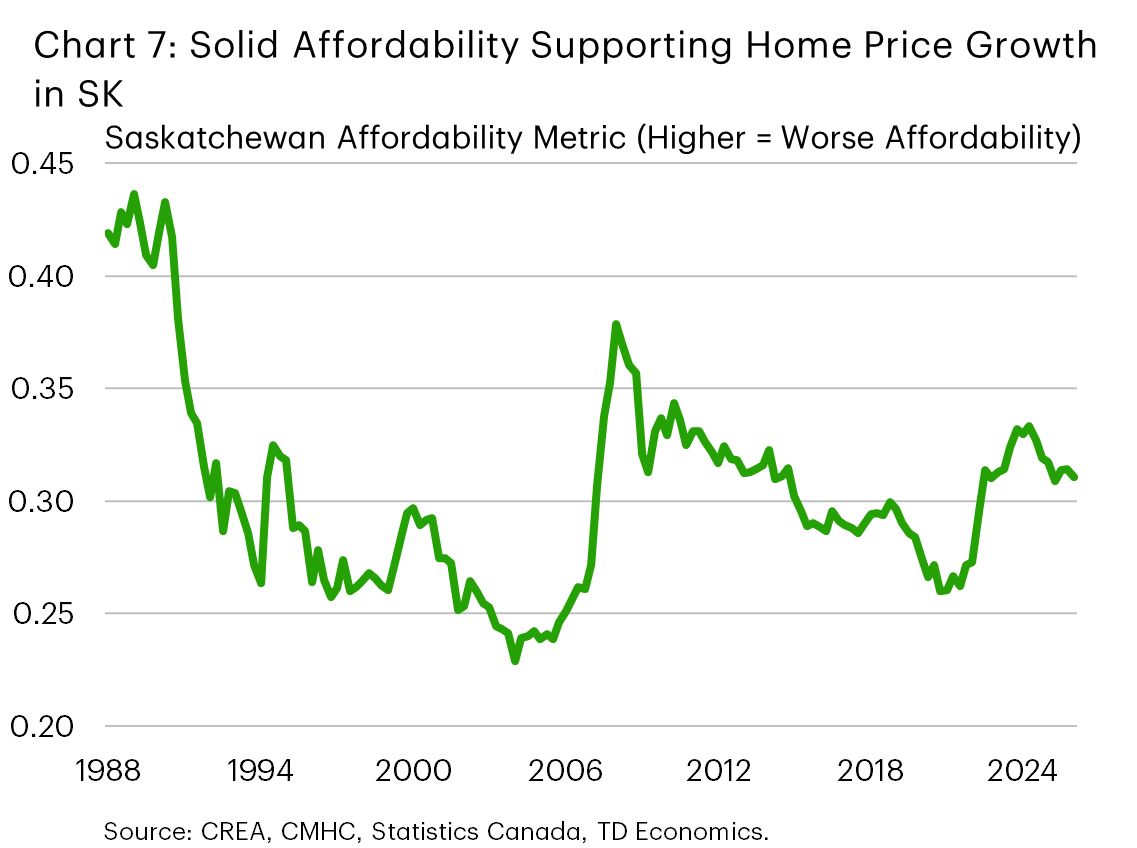
In contrast, Saskatchewan’s market continues to run hot, with sales levels elevated and year-on-year price growth nearly reaching double digits in May (+9%). By one measure, job growth is leading the pack in Saskatchewan, lifted by non-residential construction spending and the public sector. Equally important, affordability is within long-term norms in Saskatchewan (Chart 7) – a far cry from most other provinces. As such, we expect sales to remain high compared to historical norms moving forward, while Saskatchewan leads provincial price growth in 2026 and 2027 (on average).
Manitoba sits in between these markets, with prices likely to post a 3% gain this year. Meanwhile, sales are on track to drop in 2026 as the economy deals with U.S.-Canada trade tensions. Sales could bounce back in 2027 alongside some improvement in economic activity. However, deteriorated affordability will likely cap price growth.
Newfoundland and Labrador a Perch Above in the Atlantic
In Newfoundland and Labrador, sales are trending lower but remain highly elevated, lifted by commodity-supported income gains and solid affordability. This is helping keep supply/demand balances tight and underpinning solid price growth. Indeed, prices are up nearly 6% year-to-date. However, that marks an easing from heated gains in 2024 and 2025. And, with interprovincial migration slowing and job growth likely to be restrained, we see price growth moderating to a trend-like pace through next year.
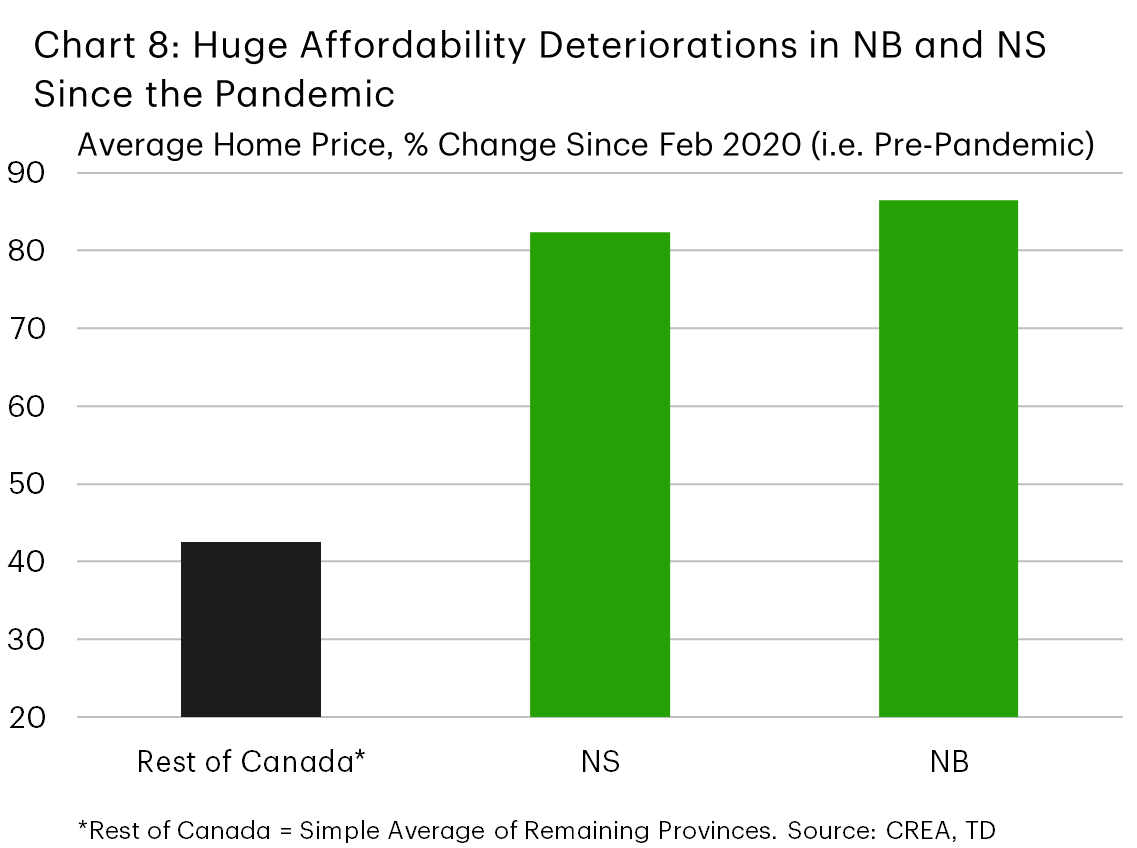
Elsewhere, price growth is slowing rapidly in Nova Scotia (+2% year-to-date, year-on-year) and New Brunswick (+0.2%) amid a cooling in sales activity. Accordingly, we’ve downgraded our price growth expectations for these two regions and now foresee them growing at a meagre 1% average pace in 2026 and 2027. Factors at play include easing economic growth in Nova Scotia and a dwindling inflow of migrants from other provinces in New Brunswick. We also can’t overlook the massive affordability deterioration in both regions. Indeed, average prices were 80-90% above their pre-pandemic levels in May (Chart 8). Price growth is likely to be a bit firmer in PEI than these regions moving forward, as affordability hasn’t worsened to quite the same degree.
Forecast Table |
|---|
| Home Sales and Price Outlook |
Disclaimer
This report is provided by TD Economics. It is for informational and educational purposes only as of the date of writing, and may not be appropriate for other purposes. The views and opinions expressed may change at any time based on market or other conditions and may not come to pass. This material is not intended to be relied upon as investment advice or recommendations, does not constitute a solicitation to buy or sell securities and should not be considered specific legal, investment or tax advice. The report does not provide material information about the business and affairs of TD Bank Group and the members of TD Economics are not spokespersons for TD Bank Group with respect to its business and affairs. The information contained in this report has been drawn from sources believed to be reliable, but is not guaranteed to be accurate or complete. This report contains economic analysis and views, including about future economic and financial markets performance. These are based on certain assumptions and other factors, and are subject to inherent risks and uncertainties. The actual outcome may be materially different. The Toronto-Dominion Bank and its affiliates and related entities that comprise the TD Bank Group are not liable for any errors or omissions in the information, analysis or views contained in this report, or for any loss or damage suffered.
Download
Share: