Ontario’s Economy:
Green Shoots Beneath the Gloom
Rishi Sondhi, Economist | 416-983-8806
Date Published: August 11, 2026
- Category:
- Canada Provincial & Local Analysis
Highlights
- Ontario’s economy is facing some of the stiffest headwinds in the country, including weak labour markets, tariff exposure, soft homebuilding and elevated household debt pressures.
- Still, several offsets are preventing a significant worsening in the economy, including improving housing affordability, Canada’s lowest provincial inflation rate and rising real wages.
- Activity outside of heavily trade-exposed sectors has held up reasonably well, while some indicators suggest the worst of the tariff shock may be behind Ontario’s manufacturing sector.
- Ontario also enters this challenging period on a reasonably firm fiscal footing and having made notable progress in reducing regulatory interprovincial trade and labour mobility barriers.
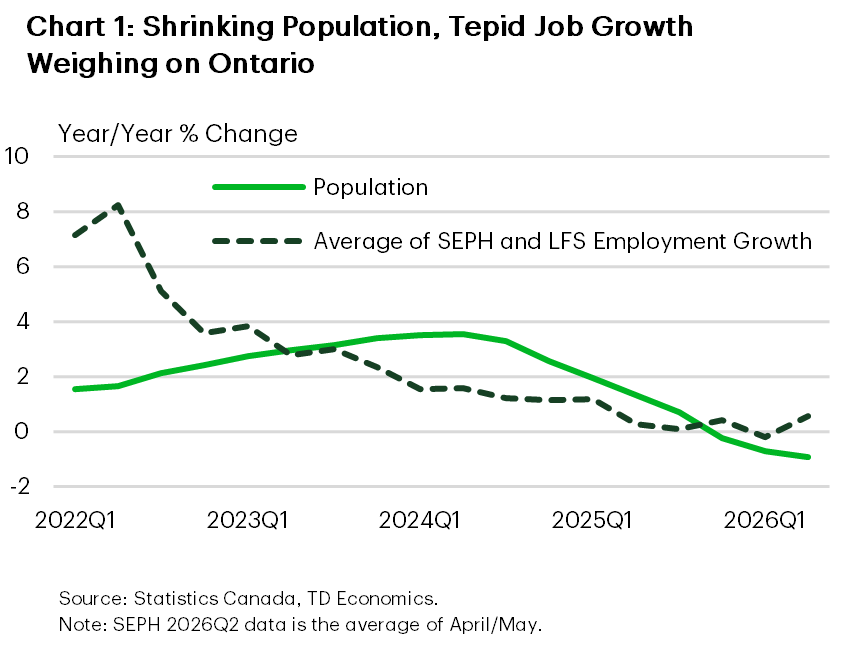
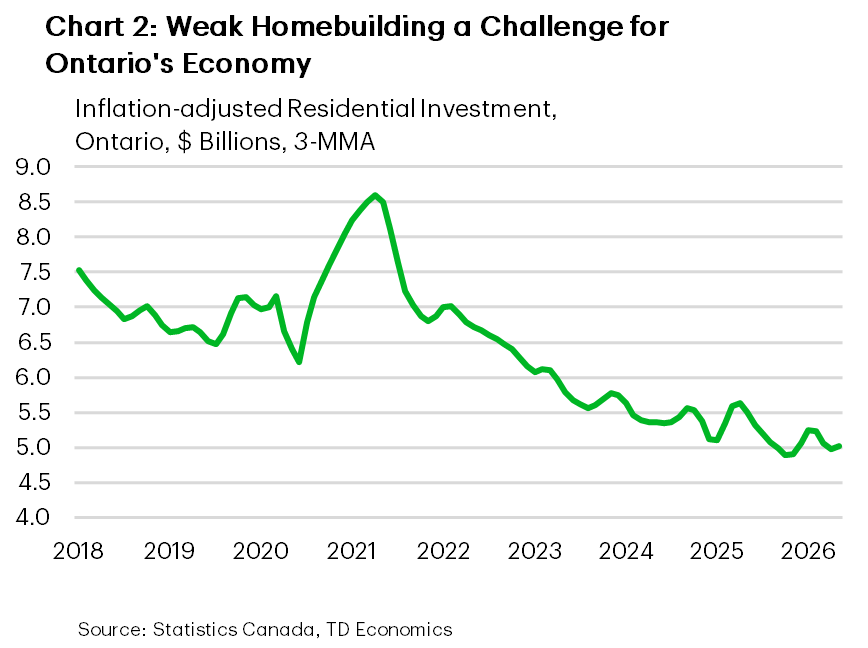
Ontario’s economy is facing stern headwinds. Its unemployment remains well above the nation overall, and would be even higher without a shrinking population that’s downwardly pressuring the labour force (Chart 1). The province is in the crosshairs of tariffs, thanks to a heavy reliance on the U.S. market and Ontario’s large steel and automotive industries. Meanwhile, homebuilding is weak (Chart 2) and heavily indebted consumers are working through another wave of mortgage renewals at higher interest rates. It’s little wonder then that many forecasters – including ourselves – expect Ontario’s economy to record one of the weakest rates of economic growth of any province this year (see forecast).
Despite this turbulence, Ontario’s economy has a number of forces working in its favour, many of which are helping to keep the economy’s head narrowly above water this year and could set up for a better performance next year. At the top of this list of so-called “green shoots” is an improving housing affordability picture.
Housing affordability is improving
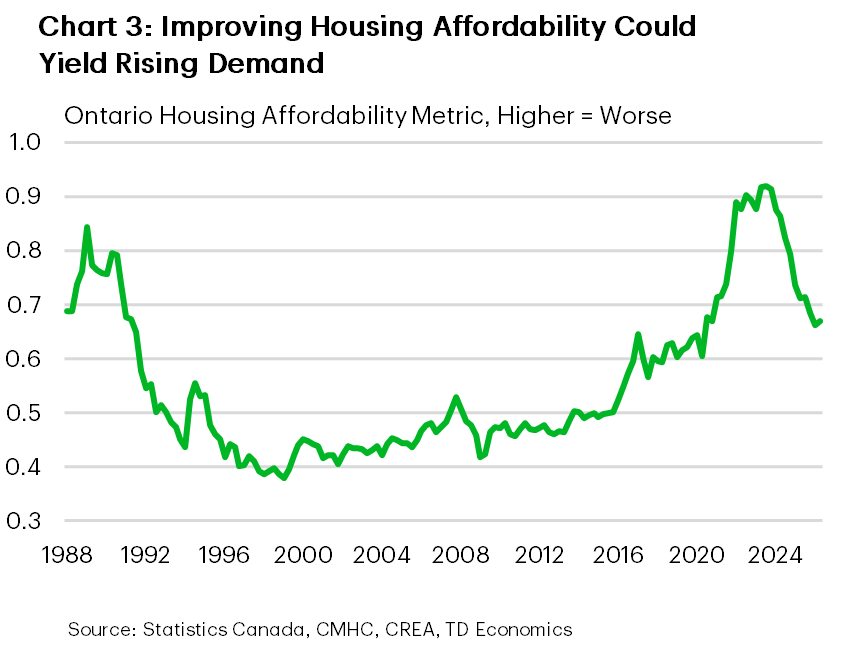
While no means pristine, Ontario’s housing affordability has improved since 2023Q3 (Chart 3). This has come courtesy of falling prices, declining interest rates and rising household incomes. With supply/demand balances still heavily in favour of buyers, our forecast anticipates further home price declines in the back half of the year. This means that we may be primed for further incremental improvements in the near-term. Better affordability could be behind the (modest) recent momentum we’ve seen in Ontario’s resale housing markets. It also supports our view that further gains in home sales will unfold moving forward, contributing positively to residential investment and GDP growth.
Ontario’s relatively favourable inflation backdrop
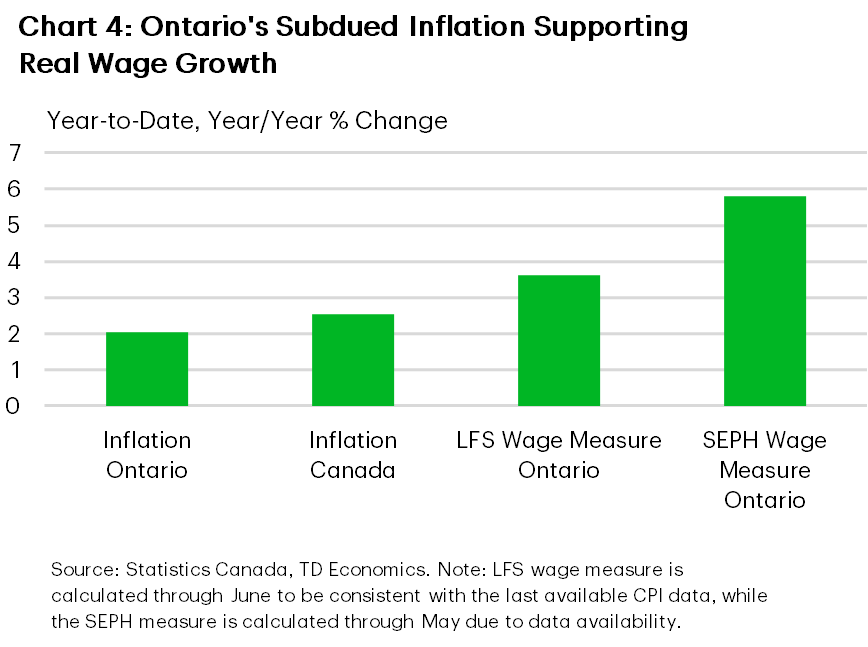
Related to the point on housing affordability, Ontario has the lowest provincial inflation rate in the country. Indeed, on a year-to-date, year-on-year basis, Ontario’s inflation rate is 2.0%, versus 2.6% nationwide. It’s also well below other large provinces like Quebec (3.1%) and Alberta (2.7%). Ontario’s declining population has weighed on rents, while inflation tied to home prices is relatively soft. Beyond these more obvious reasons, Ontario has also seen softer inflation in household operations/furnishings, clothing/footwear and recreation/education/reading while also benefitting from discounting in internet services.
Ontario’s more subdued inflation rate has translated into rising inflation-adjusted wages (Chart 4). This should offer some near-term support for household spending, joining the tailwind from the rollout of government support measures.
Resilience in sectors not heavily exposed to trade
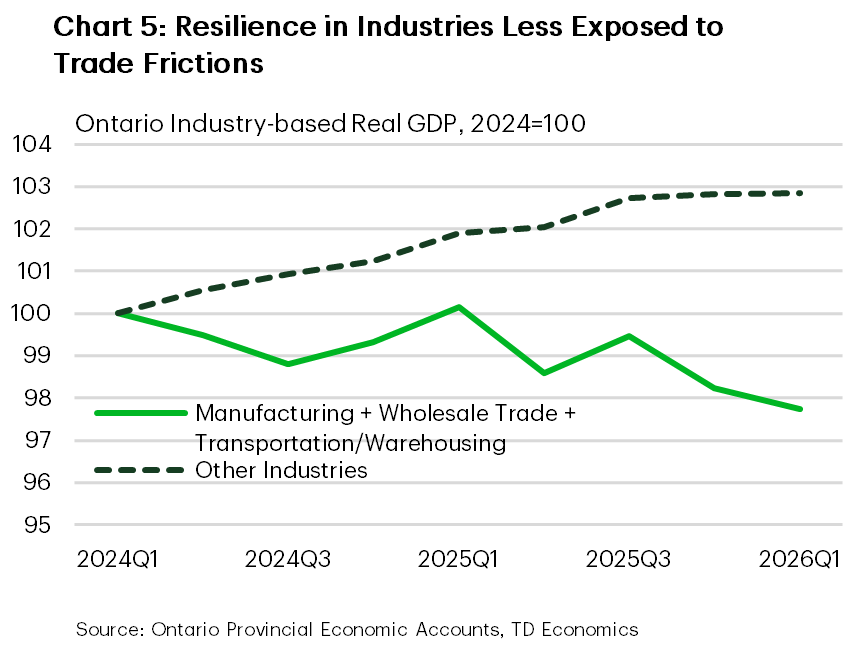
Industries outside of those heavily exposed to U.S. trade have held up decently. Measuring from 2024Q3 (before tariffs started impacting the economic data) and 2026Q1 (last period of available data), GDP excluding manufacturing, wholesale trade and transportation/warehousing was up an annualized 1.3% (while being down about 1% for these trade-exposed sectors). In the context of a decline in Ontario’s population over that period, this isn’t a bad outturn (Chart 5).
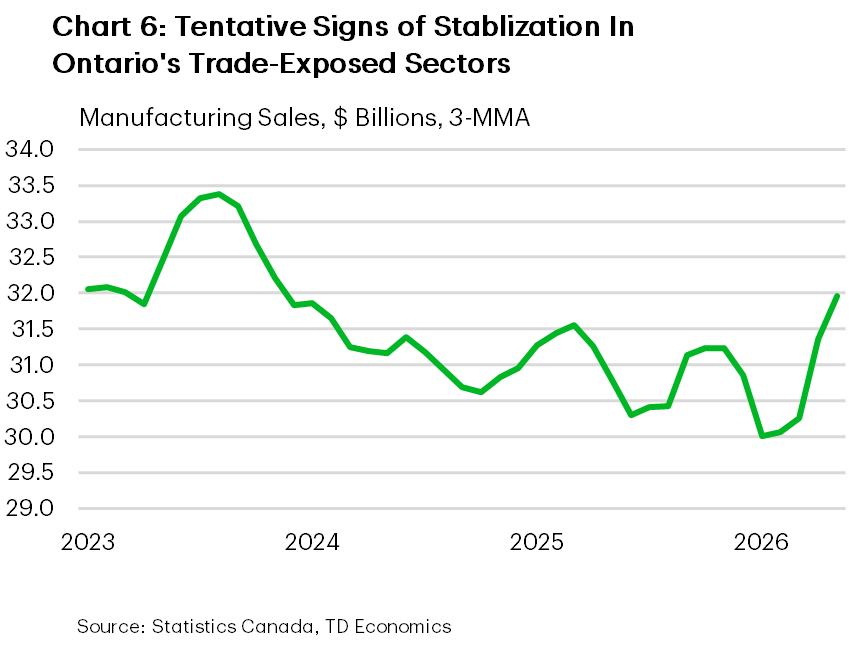
Even in heavily exposed sectors, there are some green shoots. For instance, in May, nominal manufacturing sales rose to $33 billion – the highest level since 2023 – lifted by the beleaguered transportation sector (Chart 6). Meanwhile, employment levels in the sector have bounced off their lows. The share of nominal shipments to markets outside of the U.S. has also climbed to about 35% so far in 2026 from roughly 20% in 2024 – supporting a diversification narrative. However, much of this stems from gold exports, which have benefited from a sharp rise in prices.
Of course, no one would mistake Ontario’s manufacturing sector for being on a strong footing. And the external backdrop remains rife with downside risks, including the likelihood that the newly threatened 50% tariffs on about 5% of national, U.S.-bound exports would disproportionately hit Ontario if implemented. Still, with the economy a year-and-a-half removed from the initial sting of the trade war, it could be the case that the worst impacts are in the rearview. This is supported by recent Bank of Canada surveys1, which suggest that businesses in these industries have been adjusting to the new, more difficult backdrop.
Per capita GDP is on the upswing
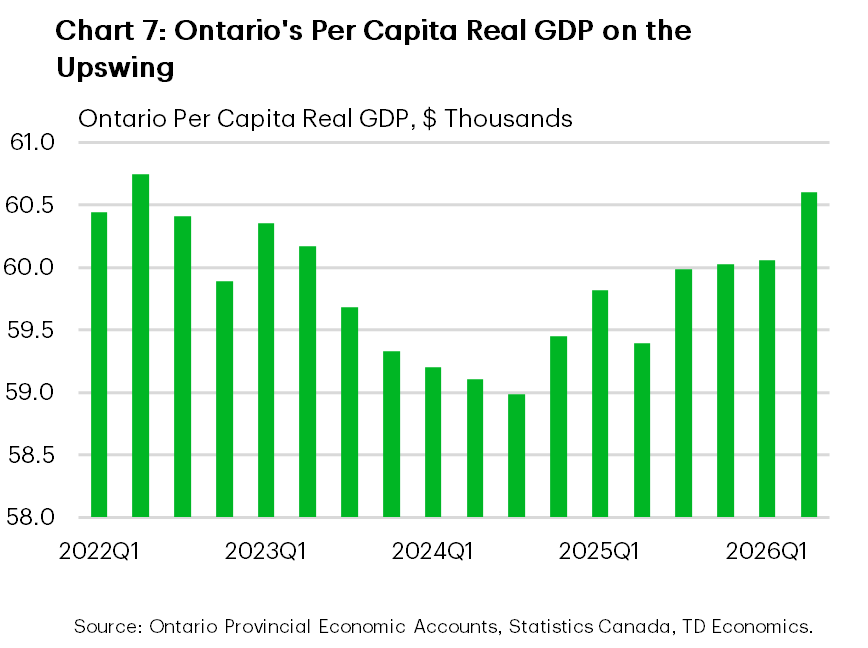
As a measure of performance, per capita real GDP had some detractors during Ontario’s 2023-2024 population boom. Over this period, real GDP per person fell about 1%. However, some analysts suggested that it was unrealistic to presume that the flood of migrants in Ontario would contribute to real GDP in the same proportion as the existing population, given that it takes time to find work, gain skills and boost productivity2.
On the other hand, research has found that higher levels of GDP per person are found in countries with advanced infrastructure, better healthcare and education systems, and higher access to technologies and innovations3. We’ll simply note that, with Ontario’s economy likely to have advanced solidly in the second quarter despite a (probably) shrinking population, per capita real GDP likely rebounded to its highest level since 2022 (Chart 7).
Provincial fiscal situation holding up
Ontario’s fiscal position also looks relatively steady. During this year’s budget season, it was one of only four provinces projecting balance over the planning horizon, though that outcome depends on sustaining very modest program spending growth despite ongoing demographic and capacity pressures.
Ontario was also one of just three provinces to lower its net debt-to-GDP ratio in FY 2024/25 (the last period of data across all provinces), with the ratio falling to 35.7% - its lowest level since FY 2010/11 (chart 8). The province expects the ratio to rise over the medium term, but the projected 2.5 percentage-point increase is far more contained than the double-digit gains anticipated in much of Atlantic Canada and B.C. Notably, Alberta’s outlook will likely also shift following the recent move higher in oil prices, with its next fiscal update likely due in late August.
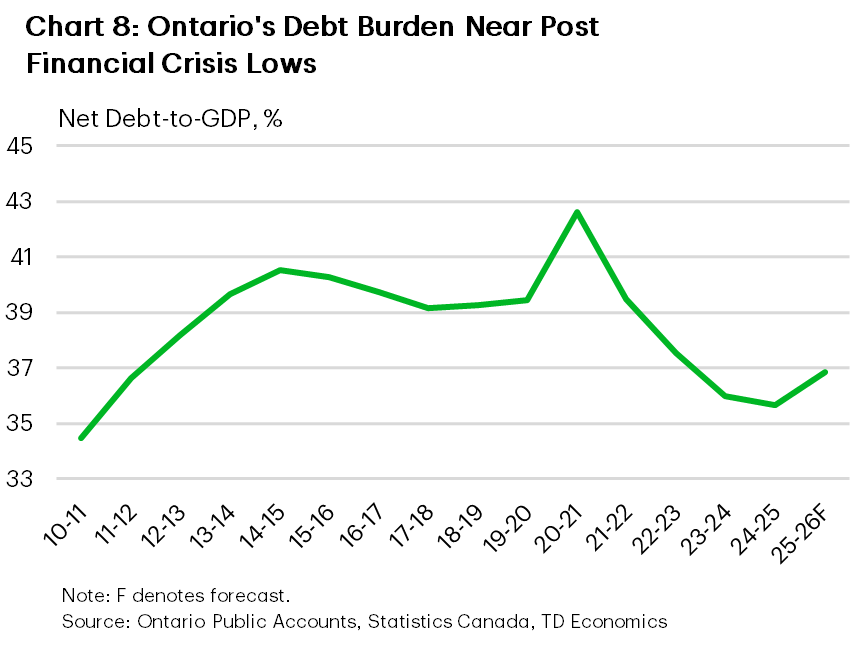
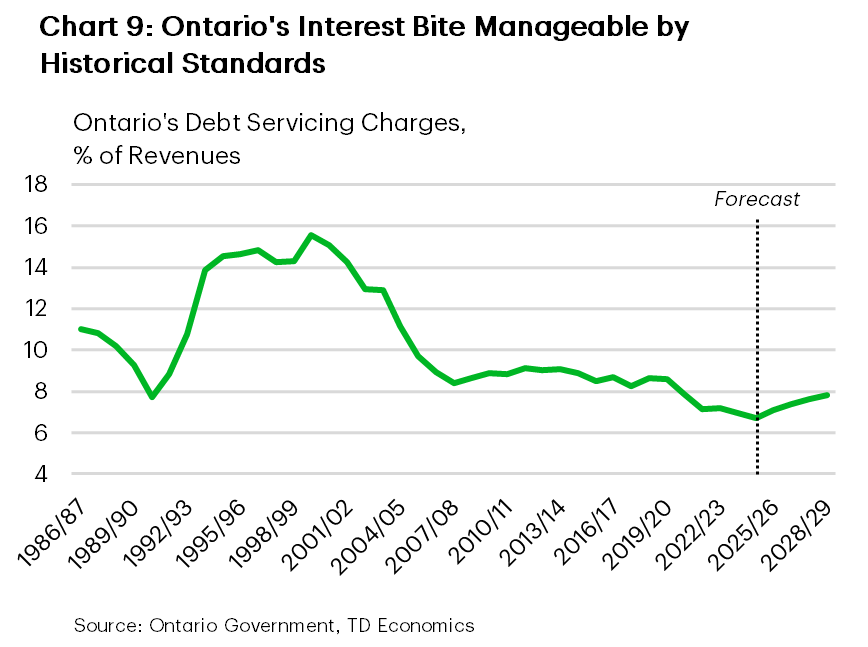
Keeping debt growth contained matters. A restrained net debt-to-GDP ratio can limit debt-service costs, preserve flexibility to respond to downturns and reduce exposure to interest rate shocks. Ontario’s debt-service costs absorbed 6.7% of revenues in FY 2024/25 and are forecast to rise to 7.8% by FY 2028/29 — still well below the threatening double-digit levels seen from the early 1990s through the early 2000s (Chart 9).
Progress on interprovincial trade barriers
Research we did last year pegged Ontario as being among the provinces to have gone the furthest in removing interprovincial trade barriers at the time (see report). With all provinces and territories having recently signed on to the Canadian Mutual Recognition Agreement, the playing field is likely more level now, especially in the trade of goods. Many provinces have also taken important steps to reduce interprovincial labour mobility barriers. However, Ontario stands out in offering “as-of-right” certification for workers in regulated occupations coming from other provinces. This allows workers licensed elsewhere in Canada to be temporarily certified for 6 months, allowing them to begin working immediately in many regulated professions while provincial registration is finalized. This policy targets an obstacle that employers looking to hire out-of-province commonly cite: the time it takes for workers to become licensed or certified4.
Bottom Line
Ontario’s economy is unlikely to lead the provincial growth tables this year, but the picture is not uniformly weak. Improving affordability, a favourable inflation backdrop, firmer real incomes, progress in reducing interprovincial trade barriers, resilience in less trade-exposed sectors and a still-manageable fiscal position provide important cushions against a difficult external environment. These supports should help keep growth positive through 2026 and leave the province better positioned for a rebound next year, provided tariff risks do not intensify further.
End Notes
- Bank of Canada. (2026, July 6). Business Outlook Survey: Second quarter of 2026. https://www.bankofcanada.ca/2026/07/business-outlook-survey-second-quarter-of-2026/
- Stanford, J. (2025, May 6). Per capita GDP is a deeply flawed measure of economic performance and living standards. Centre for Future Work. https://centreforfuturework.ca/2025/05/06/per-capita-gdp-is-a-deeply-flawed-measure-of-economic-performance-and-living-standards/
- Statistics Canada. (2024). Is Canada in a productivity crisis? Economic and Social Reports, 4(4). Government of Canada. https://www150.statcan.gc.ca/n1/pub/36-28-0001/2024004/article/00001-eng.htm
- Statistics Canada. (2023). Obstacles experienced during the hiring or consideration process of individuals with a professional certification or industry licence from outside of the province or territory where the business is located over the last 12 months, fourth quarter of 2023 (Table 33-10-0733-01). Government of Canada. https://doi.org/10.25318/3310073301-eng
Disclaimer
This report is provided by TD Economics. It is for informational and educational purposes only as of the date of writing, and may not be appropriate for other purposes. The views and opinions expressed may change at any time based on market or other conditions and may not come to pass. This material is not intended to be relied upon as investment advice or recommendations, does not constitute a solicitation to buy or sell securities and should not be considered specific legal, investment or tax advice. The report does not provide material information about the business and affairs of TD Bank Group and the members of TD Economics are not spokespersons for TD Bank Group with respect to its business and affairs. The information contained in this report has been drawn from sources believed to be reliable, but is not guaranteed to be accurate or complete. This report contains economic analysis and views, including about future economic and financial markets performance. These are based on certain assumptions and other factors, and are subject to inherent risks and uncertainties. The actual outcome may be materially different. The Toronto-Dominion Bank and its affiliates and related entities that comprise the TD Bank Group are not liable for any errors or omissions in the information, analysis or views contained in this report, or for any loss or damage suffered.
Download
Share: