Canadian Long-Run Financial Market Returns: Leveling Up
James Orlando, CFA, Senior Economist | 416-413-3180
Brett Saldarelli, Economist | 416-542-0072
Maria Solovieva, CFA, Economist | 416-380-1195
Date Published: November 2, 2023
- Category:
- Canada
- Financial Markets
Highlights
- Aggressive interest rate hikes by global central banks have increased returns on cash, ended the 40-year bull run in fixed income and stunted equities, which are still bracing for a potential economic slowdown.
- Although near-term risks are ever-present, our forecast over the coming decade embeds a leveling up in potential returns for both fixed income and equities.
- Falling policy rates in the coming years will support higher bond returns, while the ability for publicly traded firms to lead the development of new products and continue to expand their net globally will allow for improved equity market returns.
Canadian investors have been on a wild ride over the last few years (Table 1). Following the rapid economic recovery from the pandemic, surging inflation forced central banks to raise interest rates at the quickest pace since the 1970s. This swift adjustment has stunted equity markets, which now sit more than 10% below their 2022 highs. While weak equity markets are normally offset by the diversification benefits of bonds, this doesn’t hold when higher policy rates are the trigger. Fixed income markets have consequently experienced their worst sell-off in a generation. On the other hand, investors have been able to park their money in short-term assets, taking advantage of money market returns they haven’t seen in years. Over the last three years, an investor with a portfolio focused on income generation (Table 2) has received an annual return of -0.2% on average, while an investor in a growth-oriented portfolio has received a return of 4.7%. Portfolio returns over the current cycle have fallen well short of the average returns of the 2010-19 period.
Over the next decade, we forecast that investors can look forward to improved portfolio returns. Central bank policy rates appear close to their peak and should come back down to ‘neutral levels’ over the coming years. This will be an impetus for lower government bond yields and higher fixed income gains. Although U.S. and Canadian equity markets will experience bouts of volatility in the future, we project long-term returns in the 5% to 8% range. All told, we have boosted our forecast for portfolio returns by 1% to 2% annually.
Table 1: Long-Term Financial Asset Returns (C$)
| 1990-1999 | 2000-2009 | 2010-2019 | 2020-2023 | 2024-2033 | ||
| Midpoint | Range | |||||
| Cash 90-Day T-Bill | 6.4% | 3.1% | 0.9% | 1.8% | 2.5% | 2.0%-3.0% |
| Canada 10-Year Government Bond Index | 10.1% | 6.7% | 3.7% | -3.5% | 4.0% | 3.5%-4.5% |
| ICE BofAML Canada Corporate Index* | 10.6% | 6.9% | 4.8% | -0.8% | 5.0% | 4.0%-6.0% |
| S&P/TSX Composite Index | 10.6% | 5.6% | 6.9% | 6.9% | 6.5% | 5.0%-8.0% |
| S&P 500 (US$) | 18.2% | -0.9% | 13.6% | 8.8% | 6.5% | 5.0%-8.0% |
| S&P 500 (C$) | 20.8% | -4.1% | 16.0% | 10.9% | 6.5% | 5.0%-8.0% |
| MSCI EAFE (US$) | 7.0% | 1.2% | 5.5% | 2.5% | 6.5% | 5.0%-8.0% |
| MSCI EAFE (C$) | 9.4% | -2.0% | 7.7% | 3.8% | 6.5% | 5.0%-8.0% |
| Income | 10.7% | 4.9% | 5.3% | -0.1% | 4.7% | 3.9%-5.5% |
| Balanced | 11.3% | 3.8% | 6.4% | 2.1% | 5.2% | 4.2%-6.2% |
| Growth | 12.1% | 2.2% | 8.1% | 5.3% | 5.9% | 4.6%-7.2% |
Table 2: Portfolio Weights
| Cash | Fixed Income | Equities | |||
| 90-Day T-Bill | Canada Universe Bond Index | S&P TSX | S&P 500 | MSCI EAFE | |
| Income | 5.0% | 65.0% | 15.0% | 7.5% | 7.5% |
| Balanced | 5.0% | 45.0% | 25.0% | 12.5% | 12.5% |
| Growth | 5.0% | 15.0% | 40.0% | 20.0% | 20.0% |
Cash Returns: Enjoy it While it Lasts
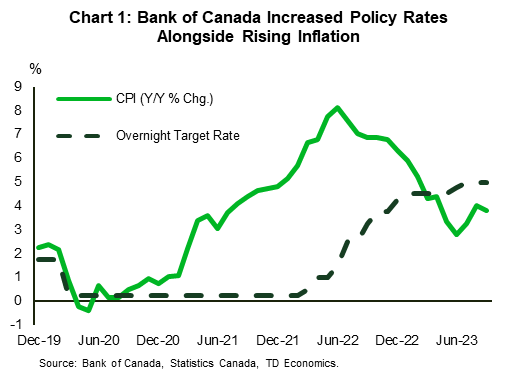
Investors in short-term cash securities have received an average return of 1.8% per year from 2020 to 2022, with the 2023 return tracking 4.75%. This return compares favourably to the post-Global Financial Crisis (GFC) average of 0.8%. The recent improvement in cash returns has been due to the aggressive response of the Bank of Canada in its effort to bring inflation back down to target. Even though the current inflation fight isn’t over, with the current policy rate at 5%, we think the BoC has zeroed in on the peak level of rates for this cycle (Chart 1).
Over the coming years, we expect that inflation will be brought under control, allowing the BoC to lower its policy rate back towards its neutral level. Admittedly, there has been significant debate about the true level of the neutral rate in Canada. Some of the factors affecting this endpoint include Canada’s pace of population growth, investment in the climate transition/re-routing supply chains, and global savings. Many of these factors point to a higher neutral rate, the highly levered Canadian household presents a significant counterweight on any potential increases.
Interest rate cuts are expected to push cash yields from 5% currently, to 4% in 2024 and 3% in 2025. After that, we believe the BoC policy rate will average between the 2% to 3% range thereafter. While this will eclipse the post-GFC average, the current attractive rates on money market funds and other short-term assets are unlikely to last.
Fixed Income: After Some Pain, Finally Some Yield
Bond investors over the last few years have experienced some of the worst portfolio returns in generations. Just compare the negative 3.4% annual average return for a holder of a Government of Canada 10-year bond over 2020-2023 to the positive 3.7% annual average return post-GFC, positive 6.7% return of the 2000s, and positive 10.1% return of the 1990s.
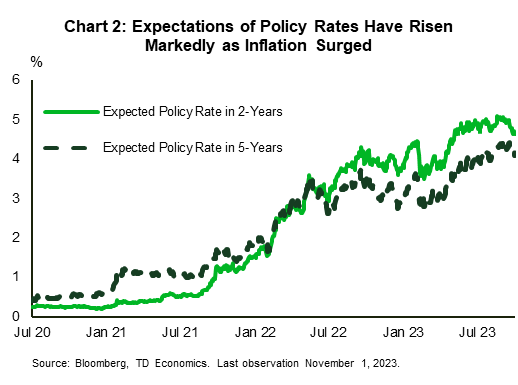
Bond yields are affected by two factors: the expected path of the Bank of Canada policy rate and a term premium for locking into that rate for a given amount of time. Both higher policy rate expectations and an increase in the term premium have caused yields to rise and the value of bonds to decline swiftly (Chart 2).
But good news is coming. The BoC is likely at or near the peak policy rate, and is expected to cut rates back towards the neutral range in the coming years. At the same time, we are maintaining higher term premiums in the range of 0.5% and 0.75%. For investors that choose to lock in at current yields, we are expecting annual average returns in the range of 3.5% to 4.5%. That is right around the pre-pandemic average and will go a long way to offset some of the losses experienced over the last two years.
Equity Returns: Waiting for the Boom
From the uncertainty of the pandemic, to inflation, commodity price spikes, and war, there have been many ups and downs in recent years for equity markets. But when you average out the returns since 2020, Canadian equities (TSX) have held up quite well - having returned 5.9% annually, not far off the returns from the prior decade. Given the TSX’s exposure to commodities, it has outperformed the international MSCI EAFE benchmark (developed economies excluding Canada and the U.S.), which returned 3.1%. Canadian investors are also likely continued to diversify into the U.S. equity market, which has been a good trade with the technology heavy S&P 500 Index having provided a return of 10.8% annually from 2020 to 2023. About 2% of annual S&P 500 and MSCI EAFE performance was due to a depreciating Canadian dollar.
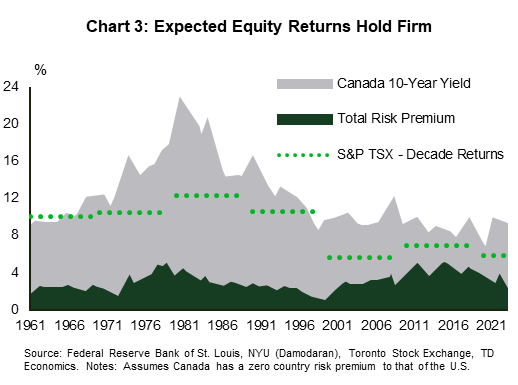
To assess what equities will do next, we look at typical models that separate expected equity returns over the long-term into two components: the return on safe assets and the extra return for taking on equity risk (also known as the equity risk premium (ERP)). The expected return on safe assets, or cash, was covered above, but where the equity risk premium is headed requires closer attention.
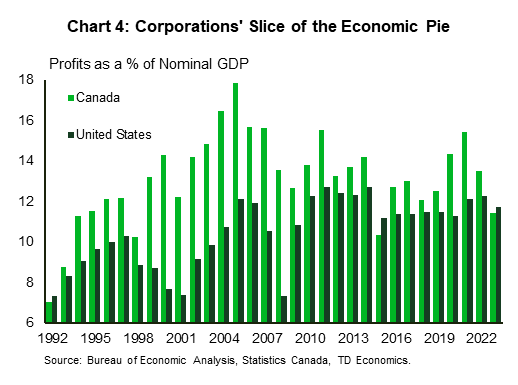
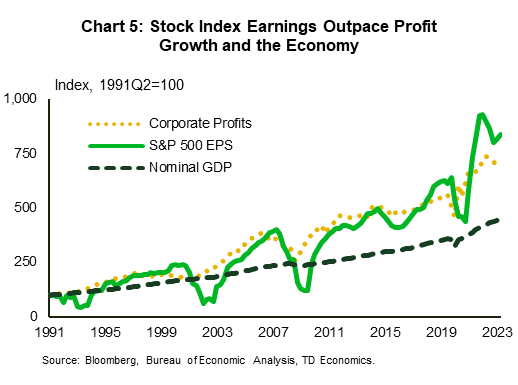
The equity risk premium is largely driven by the profit potential of firms and currently sits around 4.5% (Chart 3). If profitability is higher, investors will favour equities relative to bonds, supporting a positive equity risk premium. And over the past few years, a substantial share of the global income pie has gone to corporations (Chart 4). But for equities, we’d note that the earnings of publicly traded companies have done even better, outpacing overall domestic corporations by a wide margin. Indeed, the annual growth rate of earnings per share of S&P 500 companies has been 15.0% since 2010, approximately three times U.S. domestic corporate profit growth of 5.2% (Chart 5). For the TSX Composite, the growth of earnings per share was 9.3%, versus Canadian corporate profit growth of 3.4%. This level of profit growth over and above that of safe assets goes directly into investors assumptions of the ERP.
There will be three major factors that will dictate whether publicly traded firms can continue to carve out excess profits: global factors, cost pressures, and valuations.
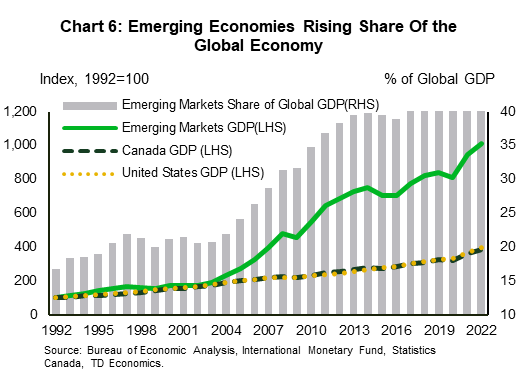
Publicly traded firms have been able to capture profits by leading the innovation of new products. Just look at America’s large technology and manufacturing firms. They have been spearheading the research and development of new products that have taken over our lives. From smart phones to smart homes, as well as electric cars and solar powered agricultural production. These new products have been adopted at home and abroad. By expanding their nets globally, firms have been able to take advantage of rapid growth in Emerging Markets (Chart 6, Box 1). While global risks will remain present – China’s real estate sector, demographic issues, conflict in the Middle East – over the next decade, publicly traded firms should continue to invent/develop new products and benefit from having a global market for goods and services.
Although firms are expected to be successful in growing their top line, rising costs will challenge their ability to maintain their bottom line. The post-pandemic economic recovery has tightened labour markets, and lead to sizeable wage gains in Canada and the U.S. Furthermore, rising interest rates has caused firms to dedicate more spending towards servicing debts. Thus far, firms have been able to pass these higher costs on to consumers, enabling profit margins to remain buoyant. It is uncertain how long this will last. Slowing economic growth may make consumers more price conscious, limiting firms’ ability to pass on costs. On the other hand, many firms have started to increase investment in automation, which would support profit margins and could result in firms taking an even larger share of the GDP pie in the future.
Lastly, we must consider equity valuations. While we have considered the future path of profitability above, what investors are willing to pay for that profit potential matters. We’d note that price to earnings ratios (P/E, present and forward-looking) have declined from their post-pandemic peaks but are hovering close to their historical averages in the U.S. On the other hand, cyclically adjusted price to earnings ratios remain above their long-run averages. Depending on how valuations adjust over time, we must widen the range for equity returns. If valuations remain around current levels, an 8% average annual equity return would be reasonable (a 5% ERP). But if valuations start to fall in line with the cyclically adjusted P/E ratios, a 5% average is more probable (2% ERP). This story is different for the TSX, with earnings ratios below historical averages. Although we may expect an improvement in valuation ratios over time, this may be offset by the relatively lower profit potential of firms. But if TSX valuations can rebound closer to their U.S. equivalents, this could provide greater upside for Canadian equity returns.
Assumptions on exchange rates must also be factored into our return estimates. The Canadian dollar currently sits around 72 U.S. cents and is expected to return to an estimated equilibrium level of 78-80 U.S. cents by the end of 2025.
Bottom Line
Financial assets have provided investors with a mixed bag as the BoC raised its policy rate to a twenty-two-year high. The rising rate environment has been a headwind for fixed income and equity returns, while boosting returns for short-term assets. We expect that the BoC will be able to shift to rate cuts in the middle of 2024, which should dampen short-term cash returns, but see fixed income returns improve to their pre-pandemic era averages. Equity markets too should improve over the coming years. While the risk of an economic recession still looms, and global risks remain ever-present, the ability for publicly traded firms to develop new products and enter new markets increases their capacity to gain excess profits. Given this backdrop, we expect long-term investors are poised to see increased portfolio returns over the next decade.
Box 1: Emerging Market: Navigating Uncertainty
Investors’ expectations for Emerging Markets (EM) have historically been boosted by the belief that growing global demand and expanding trade would allow their economies to catch-up to their developed market peers in terms of income per capita. This raised hopes that EM economies would consistently outgrow the developed world until they closed their national income gap. Today, there are several reasons for EM economies to anticipate strong growth tailwinds. For example, some EM economies have made substantial progress in securing a competitive position in the global technology revolution and the transition to clean energy. Additionally, as populations have become wealthier in recent years, consumers are likely to increasingly shift their focus towards services, which should, in turn, support more stable GDP and income growth.
However, these prospects are not without risks. Thus far, income convergence has been bolstered by increasing globalization, boosting capital flows, trade opportunities, and the transfer of technology and knowledge, all of which support innovation. The recent trend towards deglobalization and reshoring does not necessarily halt this progress, but it underscores the need for market participants and firms to be more discerning in their investment choices. For instance, the reorganization of strategic supply chains could present new opportunities for EM nations outside of China, including Mexico, Vietnam, Taiwan, and India. On the other hand, China has established a competitive edge in various industries, like electric vehicles (EV), where it now maintains a dominant position in the global market for virtually every aspect of the EV supply chain (see report).
Most recently, Russia’s invasion of Ukraine and the war in the Middle East have once again underlined the significant consequences of geopolitical risks. In addition to economic fallout through disruptions to supply chains and commodity markets, escalating tensions could trigger cross-border capital outflows and increased uncertainty that would threaten macro-financial stability. According to the IMF, the financial and real-economy channels are likely to feed off one another, disproportionately affecting emerging markets and developing economies. This points to the long held view of EMs, that they provide huge investment opportunities, but they are not without their risks.
Disclaimer
This report is provided by TD Economics. It is for informational and educational purposes only as of the date of writing, and may not be appropriate for other purposes. The views and opinions expressed may change at any time based on market or other conditions and may not come to pass. This material is not intended to be relied upon as investment advice or recommendations, does not constitute a solicitation to buy or sell securities and should not be considered specific legal, investment or tax advice. The report does not provide material information about the business and affairs of TD Bank Group and the members of TD Economics are not spokespersons for TD Bank Group with respect to its business and affairs. The information contained in this report has been drawn from sources believed to be reliable, but is not guaranteed to be accurate or complete. This report contains economic analysis and views, including about future economic and financial markets performance. These are based on certain assumptions and other factors, and are subject to inherent risks and uncertainties. The actual outcome may be materially different. The Toronto-Dominion Bank and its affiliates and related entities that comprise the TD Bank Group are not liable for any errors or omissions in the information, analysis or views contained in this report, or for any loss or damage suffered.
Download
Share: