Vancouver’s Housing Foundation
is Firmer than Toronto’s
Rishi Sondhi, Economist | 416-983-8806
Date Published: March 6, 2025
- Category:
- Canada
- Real Estate
Highlights
- Much ink has been spilled about the weak state of the GTA’s housing market, particularly its condo sector. Indeed, GTA condo prices are falling, while price trends remain soft for other structure types.
- In contrast, the GVA market has held up much better in the face of the Bank of Canada’s 2022/23 interest rate hiking campaign. Affordability conditions didn’t deteriorate by as much during the pandemic in Vancouver and its condo market doesn’t face the same supply challenges.
- Both the GTA and GVA housing markets have registered tepid performances to begin 2025, weighed down by economic uncertainty. While both markets could continue struggling, the GVA is on a firmer footing than the GTA heading into this bout of tariff-related turbulence. This suggests that the GVA’s housing market could again enjoy a leg up on the GTA this year.
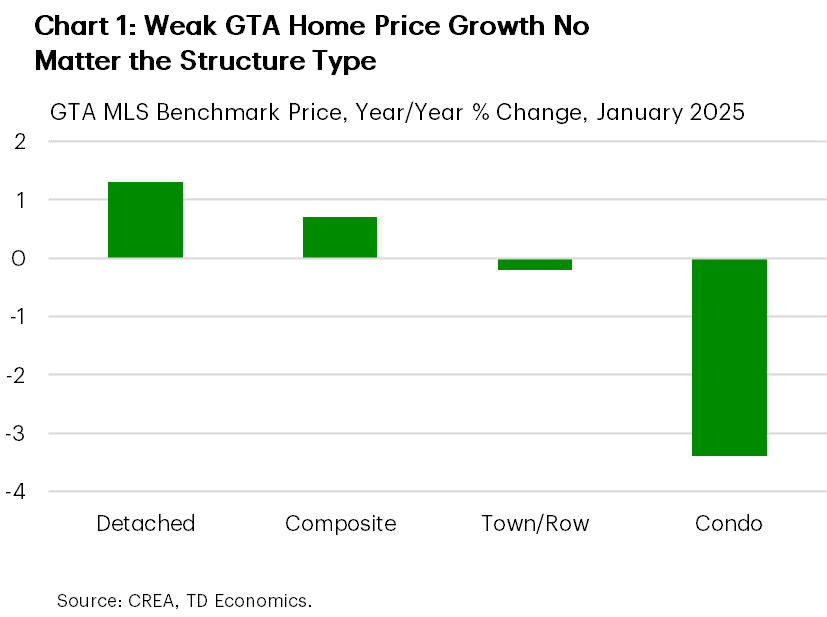
It’s a well-worn story at this point that the GTA housing market is soft. Its condo market seems to be the poster child for this weakness with it being characterized by a supply glut, weak levels of demand and conditions that favour buyers. Against this backdrop, it’s no surprise that GTA condo prices are falling, as they have done for over one year. Last September we released a forecast calling for GTA condo prices to continue dropping into the early part of 2025, with soft rent growth weighing on investor demand. Since then, the outlook for condos in the region has soured further, given our downgraded population forecast and, of course, the downside pressures from tariffs. Sales levels for other structure types in the GTA have seen slightly stronger growth over the past two years, but price trends remain similarly tepid for these units (Chart 1). For instance, detached prices dropped 0.5% year-on-year in the fourth quarter of 2024.
While much ink has been spilled on the state of the GTA market, the GVA has seemingly flown a bit under the radar. The GVA market isn’t strong in relation to most other urban markets in the country, which is no surprise given a poor affordability backdrop that has historically made it more sensitive to interest rate tightening cycles than any part of Canada. However, it has held up much better than the GTA.
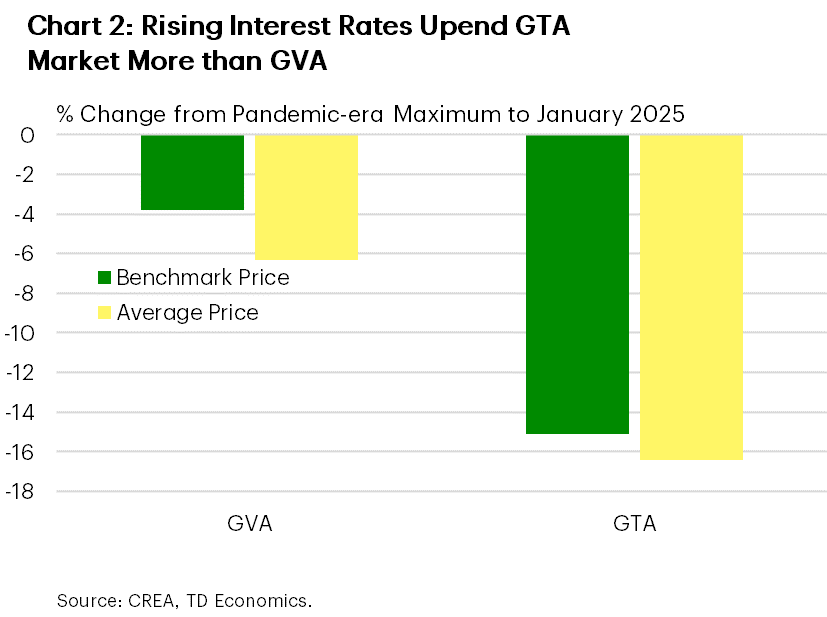
Canadian housing market activity began 2025 on the back foot and the GVA was no different, with listings surging, and sales and prices dropping. However, home sales were still up 21% year-on-year over the past 3 months on average, miles better than in the GTA where they were up only 8%. Vancouver’s home price resilience has been particularly notable, with average and benchmark prices down 6%, and 4%, respectively, from their pandemic peaks as of January, with modest declines for both apartments and other types of housing. This compares to the outsized decline of about 15% in average and benchmark prices in the GTA (Chart 2).
Zooming further out, sales and home price growth outperformed in the GVA (on average) over 2023 and 2024. This relative outperformance could be a function of several factors:
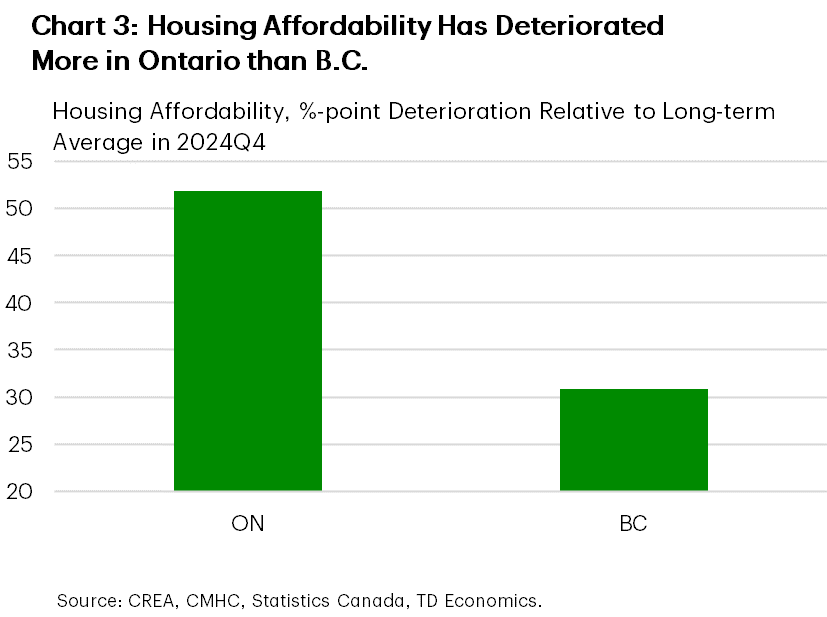
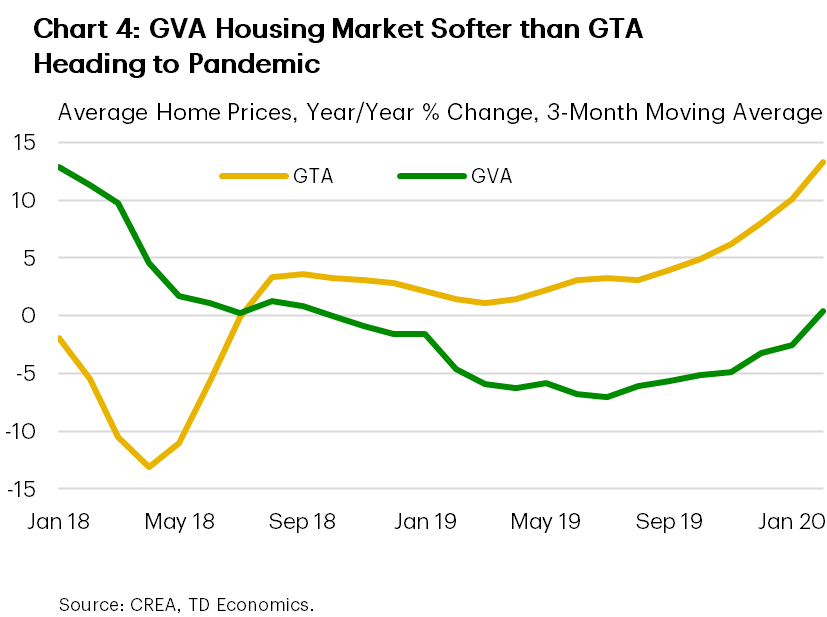
- Affordability didn’t deteriorate as much in the GVA as it did in the GTA during the pandemic (Chart 3), so there was less vulnerability in demand when interest rates started rising. This is because prices didn’t appreciate by as much in Vancouver, partly due to its market being much softer heading into the pandemic (Chart 4). Recall that B.C.’s provincial government hit the province with a bevy of measures in 2018 and 2019 meant to cool housing (including lifting the foreign buying tax rate, expanding its regional reach, and increasing land transfer and property taxes). As a result, prices were declining into the final quarter of 2019. In contrast, the GTA’s market was characterized by conditions that favoured sellers, yielding an 8% year-on-year increase average home prices in the final quarter of 2019. These tighter conditions naturally formed a firmer starting point for pandemic-era price growth in Toronto.
- Although data gaps prevent a definitive statement here, we can posit that investor activity has been weaker in the GTA than GVA over the past few years.
- Statistics Canada data tells us that around 60% of investment properties built in Ontario and B.C. from 2016-2022 were condos. Condo sales have held up relatively well in the GVA, being up 14% year-on-year in January, while dropping 12% in the GTA by that same metric.
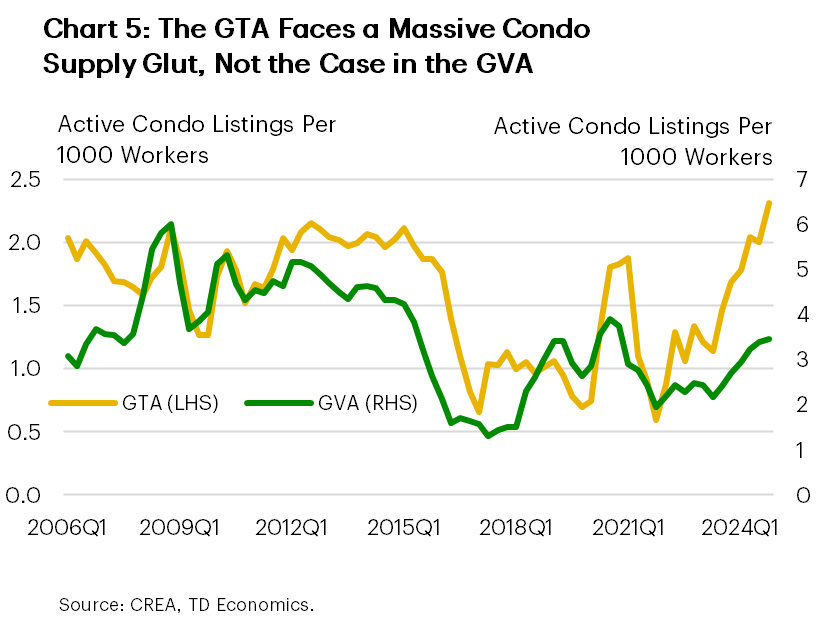
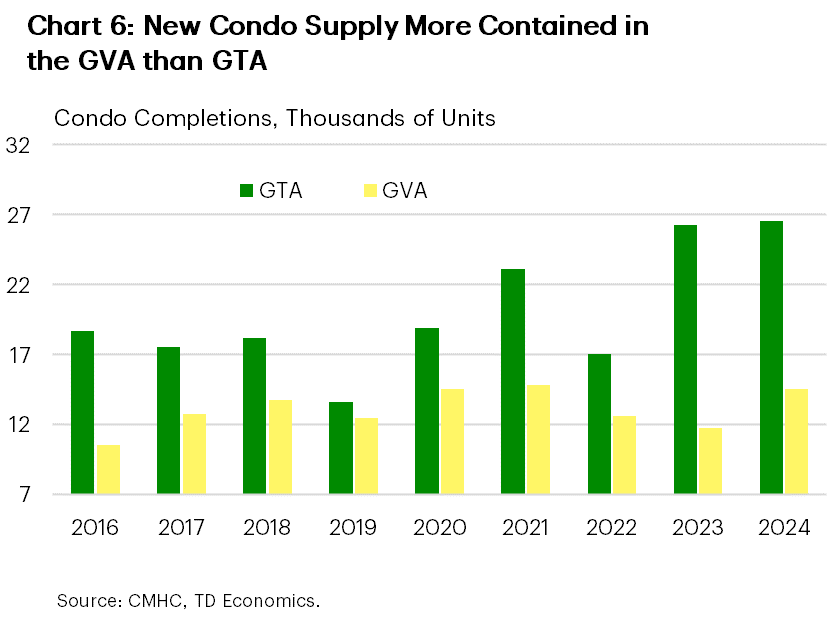
- The ratio of condo home sales to active listings is some 60% below it’s long-term average in the GTA, whereas its about half that in the GVA. This indicates much larger degree of oversupply in the GTA’s condo market (Chart 5). One likely reason that the GVA condo market isn’t facing as severe a supply/demand mismatch is that condo presales were likely softer in the GVA over 2018/19 (due to measures taken by the provincial government to cool housing and, potentially, relative interest rate sensitivity during a 2017/18 BoC hiking campaign). With these pre-sold units now turning into completions, the GVA is not seeing the same type of upward supply pressure as what’s taking place in the GTA (Chart 6).
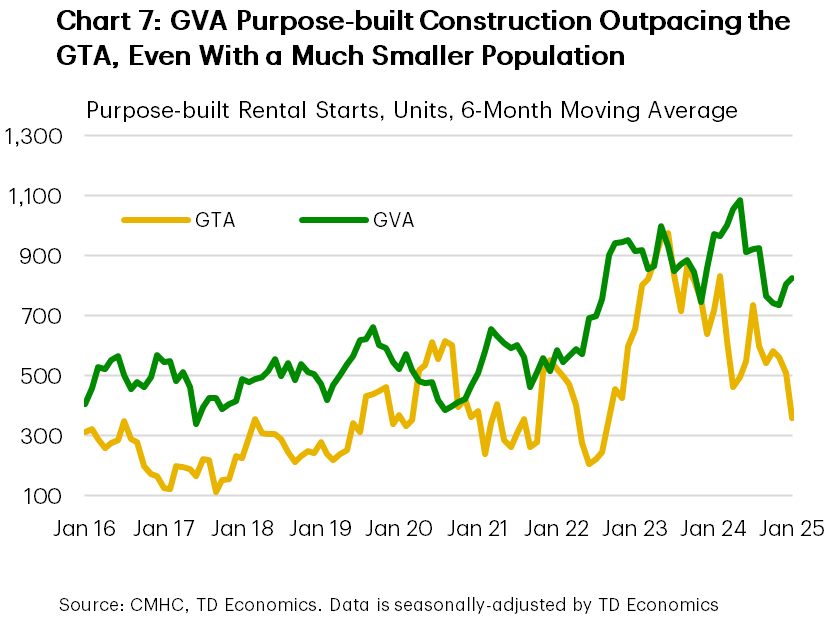
While we’ve captured trends in the resale market, markets for newly built housing in the GTA and the GVA tell the same story. Condo construction is holding up better in the GVA, likely supported by ownership housing demand that’s been more resilient in recent years. However, purpose-built rental construction is the real story here, with the GVA building a larger absolute number of units despite having a population that’s about 40% the size of the GTA (Chart 7). Here, we’ll note that rent growth is holding up better in the GVA than in the GTA, development charges on rental units are lower in Vancouver and government programs/policies are offering support. For instance, Housing Vancouver’s 2018-2027 strategy imbedded a goal to reach 20k new purpose-built rental units by 2027 through the provision of various incentives. The provincial B.C. Builds program is aimed at speeding up the delivery of rental construction to 12-18 months rather than 3-5 years, as historically been the case. A key component of the initiative is to utilize underused public lands for rental projects, along with grant money to keep rents affordable. The program also brings together landowners and developers to expedite the construction of new units.
Bottom Line
Both the GTA and GVA housing markets have registered tepid performances to begin the year, although part of this weakness can be chalked up to severe weather conditions. The soft starting point will make it tough for both markets to register positive sales and price growth performances for 2025 overall. Economic uncertainty is likely sidelining buyers while simulatenously pushing sellers to list their properties, thus weighing on prices. This is offsetting the support coming from lower interest rates, pent-up housing demand in both markets, a rising share of Canadians in their prime homebuying years and looser mortgage rules.
Although both markets could struggle this year, starting points matter in housing, and the GVA is on a firmer footing than the GTA heading into this bout of tariff-related turbulence. This suggests that the GVA is likely to again enjoy a leg up on the GTA in terms of sales levels and price trends. The GVA’s advantage is punctuated by its affordability backdrop, which has not deteriorated by as much as the in GTA relative to historical norms. This is even with prices having dropped by much more in Toronto in recent years.
Looking longer-term, the fact that housing construction has been able to hold up much better in the GVA gives the region a leg up in the effort to address its housing shortage.
Exhibits
Disclaimer
This report is provided by TD Economics. It is for informational and educational purposes only as of the date of writing, and may not be appropriate for other purposes. The views and opinions expressed may change at any time based on market or other conditions and may not come to pass. This material is not intended to be relied upon as investment advice or recommendations, does not constitute a solicitation to buy or sell securities and should not be considered specific legal, investment or tax advice. The report does not provide material information about the business and affairs of TD Bank Group and the members of TD Economics are not spokespersons for TD Bank Group with respect to its business and affairs. The information contained in this report has been drawn from sources believed to be reliable, but is not guaranteed to be accurate or complete. This report contains economic analysis and views, including about future economic and financial markets performance. These are based on certain assumptions and other factors, and are subject to inherent risks and uncertainties. The actual outcome may be materially different. The Toronto-Dominion Bank and its affiliates and related entities that comprise the TD Bank Group are not liable for any errors or omissions in the information, analysis or views contained in this report, or for any loss or damage suffered.
Download
Share this: