Is the Dial-Back of Immigration Having the Intended Impact in Canada?
Date Published: October 28, 2025
- Category:
- Canada
- Government Finance & Policy
Highlights
- Canada’s rapidly decelerating population growth is showing evidence of easing pressure on the social and economic infrastructure.
- Reduced immigration has moderated demand for purpose-built rentals and, consequently, rent growth. We estimate rent growth will likely average 2 percentage points (ppts) lower than the counterfactual scenario of maintaining higher population growth. Condo asking rents are also falling fastest in jurisdictions most exposed to immigration changes.
- Canada’s current unemployment rate would likely be at least 1 ppt higher if immigration growth had continued unabated.
- However, one area of surprise has been the absence of a parallel slowdown in household spending.
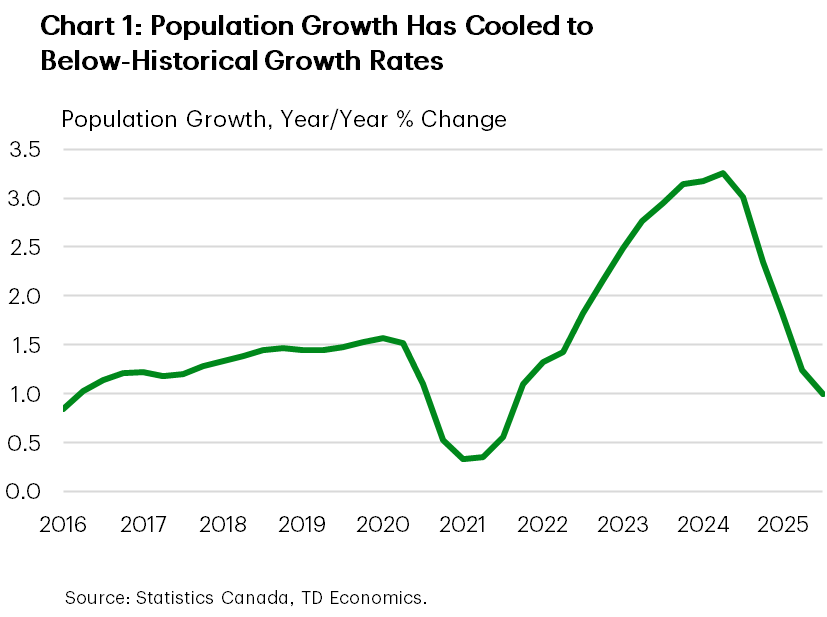
Last year, policymakers acknowledged that immigration rates were too high relative to the readiness of Canada’s social and economic infrastructure. The unemployment rate had risen over a full percentage point between 2022-2024, as businesses struggled to keep up with the rapidly expanding supply of workers. And housing affordability was being pushed to its limits. In response, the government introduced an immigration plan to right-size non-permanent residents (NPRs) and permanent resident (PR) targets to allow for some “catch up” in the needed infrastructure. That policy shift is evident by a massive tapering in Canada’s population growth from a multi-decade high of 3.2% in Q2-2024 to just 0.9% (Chart 1).
Now the question is whether the policy shift is working to get the intended outcomes on housing and the labour markets? The short answer is yes. However, the true surprise has been in the resilience of household expenditures. Despite the collapse in population growth, there has not been a parallel downshift in consumer demand for goods and services.
Pockets of the Housing Market See Relief, Impacts Capped by Structural Forces
Let’s start with a deep dive into housing impacts. Reducing the volume of immigrants can relieve housing market pressures through a few channels. A particularly significant impact has occurred in the purpose-built rental market, where drastically slower immigration inflows underpin our softer rent growth forecast of 3-3.5% in 2026 (roughly half of 2024’s growth rate).
However, it isn’t the only demand-side influence impacting our forecast. The rental market is simultaneously absorbing lower interest rates that drive a shift towards homeownership demand. And there are supply-side influences, such as government policies that have been effective in boosting construction of purpose-built rentals.
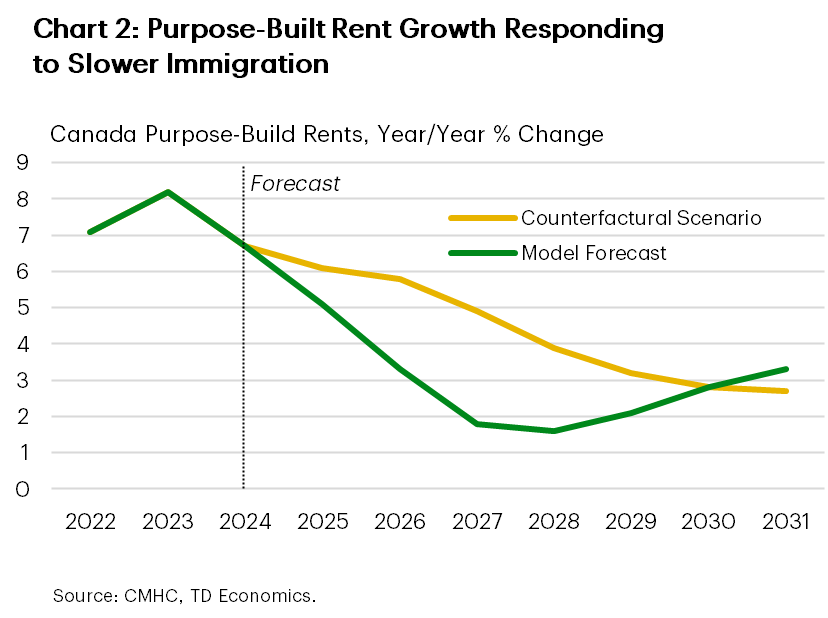
Therefore, we need to isolate the impact of population growth on rents. To do so, we keep our interest rate and rental supply assumptions unchanged and impose the counterfactual higher population growth profile absent the downshift in immigration. That hypothetical growth path is assumed to mean-revert over the longer-run. Under this scenario, the average growth of purpose-built rental prices is 5.5% from 2025-2027, which is two percentage points higher than our current forecast (Chart 2). This pace would also run nearly twice as high as the historical average, further crippling rental affordability. We estimate that the average Canadian would have been paying an additional $1,100 per year to rent a one-bedroom apartment by 2027.
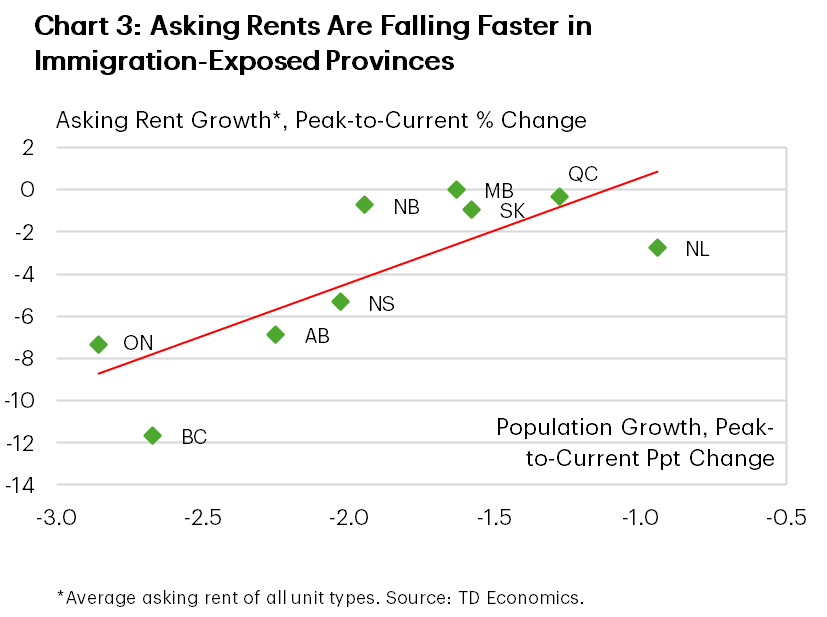
Beyond the purpose-built rental space, lowering the cap on newcomers has also lowered condo demand for both homeownership and the secondary rental market. The collision of influences has caused downward pressure in asking rents across major cities. Chart 3 demonstrates the relationship between slower population growth and rents. The largest shifts are in B.C. and Ontario due to having a higher proportion of temporary foreign workers (TFWs) and students. These markets also have the highest supply of condo units where the secondary market was previously attractive to investors for its income-generation potential.
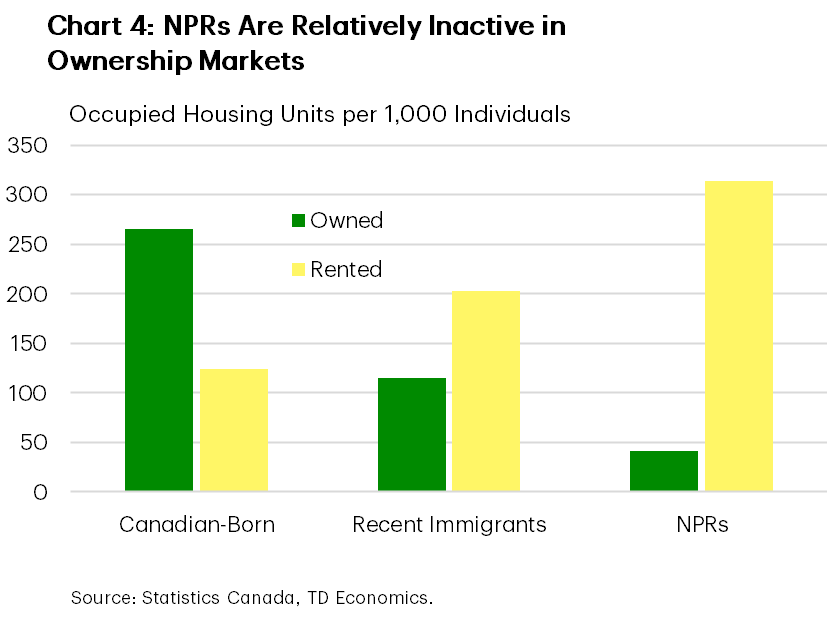
Calculating the impact of immigration flows on home prices is a more nuanced exercise. For one, NPRs have limited participation in the ownership market (Chart 4). And when they do, NPRs usually opt for condominium units.1 So a reduction in NPR inflows carries the greatest weight on this segment of the market.
Outside of NPRs, the data show that recent immigrants are slightly more active in homeownership during their early years in Canada, with a preference for detached homes. By years five to six, immigrant ownership rates tend to converge toward 50/50 relative to rental. In theory, this time lag gives developers an opportunity to adjust supply within the detached market, particularly given it’s a more predictable and stable segment of population flows. But the data show there is natural inertia on building detached homes, as developable land in Canada’s urban centers remains scarce and markets push toward housing densification.
The Unemployment Rate Would Have Risen More Absent Tighter Immigration
Turning to labour market impacts, an increase in immigration during the pandemic recovery helped address labour shortages in key sectors of the economy. Early on, Canada demonstrated a capacity to integrate these new workers. However, this capacity was exhausted as labour force growth approached nearly four times its pre-pandemic growth rate. By mid-last year, there was ample evidence that labour markets were cooling, as job vacancy rates normalized, employment growth moderated, and the unemployment rate pushed higher.
Re-adjusting immigration targets came at an opportune time. Employer demand for new workers has recently made a U-turn, with net job losses amounting to 40k positions between July and September 2025. We believe another 40k is still at risk this year. Even so, the unemployment rate is expected to rise only slightly from current levels before gradually decreasing next year because slower labour force growth mitigates a larger jump.
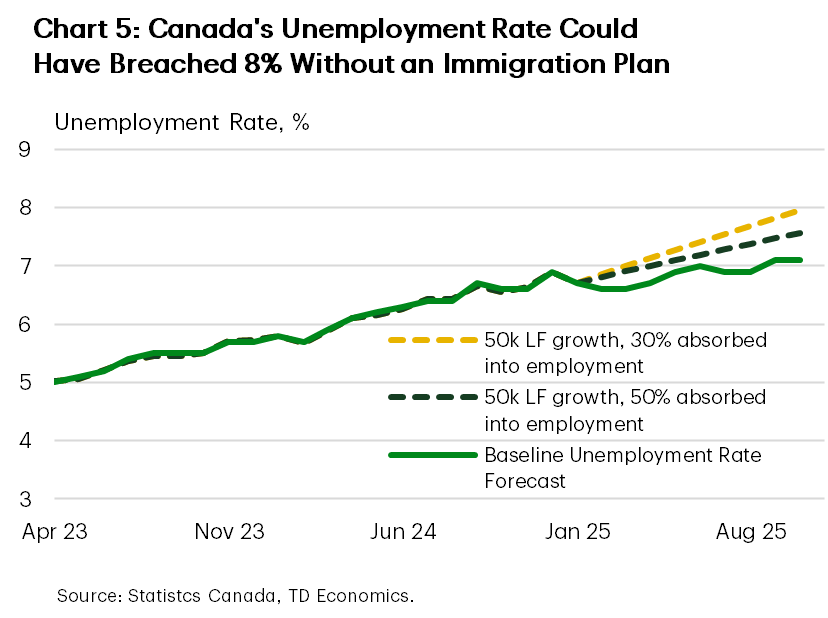
Once again, we can demonstrate this by applying counterfactual scenarios that project varying unemployment rates based on different assumptions for labour force growth. Our baseline forecast reflects an average monthly labour force increase of 10k in 2025 – which marks the 30k average monthly pace in the first half of the year followed by an expected outright contraction in the second half. However, if the labour growth rates of the prior two years were maintained through 2025, we estimate today’s unemployment rate could have breached 8% (Chart 5). This is with an assumption that employers absorb 30% of the new labour supply, reflecting the recent trend of weakening demand. Even under a more generous assumption that employers absorb 50% of the new labour supply, the national unemployment rate would still have risen to over 7.5%.
This is a reminder that immigration policy shouldn’t be static. Adjustments should reflect changing market conditions and skills demands. In addition, policymakers must be mindful of “too much of a good thing.” Significant immigration inflows within an industry can dis-incent investment by companies in favour of having access to lower cost labour. Finding a reasonable balance requires regular reviews and flexibility to support longer-term economic growth.
Spending Outcomes Faring Better Than Expected Amid Population Pullback
Although the effects of shifting immigration flows led to intended effects on housing and the labour market, the effect on consumer spending proved a surprise. During the first half of this year, aggregate household spending surpassed most forecasts by not skipping a beat from the strength exhibited in the previous half-year. For more details, see our latest research examining this consumer resilience. Key contributing factors include lower interest rates, a drawdown in household savings from elevated levels, a revival of housing demand, and an increase in domestic tourism. But there was more going on than meets the eye. Intuitively, the rapid collapse in population growth should have still pushed against these influences to dent spending momentum.
Assessing this overall impact is more challenging because official data does not separate spending of new immigrants from the rest of the population, and any available data lacks timeliness. However, triangulating the available data still offers insight. Research and survey data indicate that immigrants typically spend more when they first settle in the country and often rely on their savings. After this initial period, spending tends to decrease due to remittance payments to family in their home country, increased saving habits, and lower average wages and disposable income compared to workers born in Canada. With this spending pattern, the largest negative impacts to spending should have been observed relatively immediately as population growth throttled down in the first half of the year.
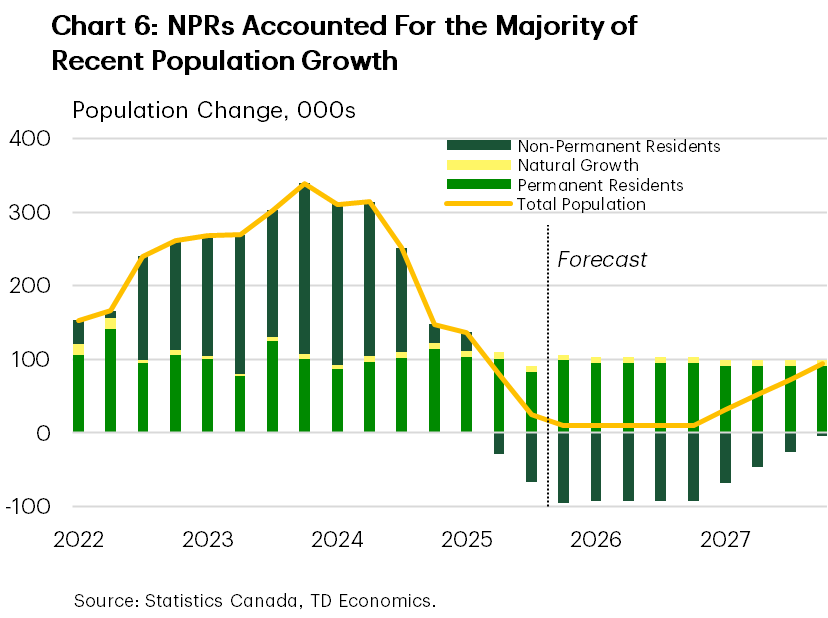
However, the characteristics of new immigrants in recent years had deviated substantially relative to past patterns. First, the increase was due to NPRs, who accounted for 70% of population growth between 2022 and 2024 (Chart 6). Historically, NPRs comprised 2–3% of the population, compared to a peak of 7.6% in Q4-2024. Of the 1.4 million new NPRs during this period, around 400,000 entered as students, and another 300,000 to 400,000 found employment in lower-wage sectors such as food and accommodation, retail services, and administrative roles. Additionally, Canada’s youth—which includes many newcomers on study permits— were already experiencing a faster rise in unemployment over the past two years compared to the core-aged working population.
Taken together, this accounts for nearly a quarter of a million newcomers who naturally possessed less discretionary spending power than the general population. Furthermore, most initial expenditures upon arrival are concentrated on securing housing, where the erosion in affordability would have further eaten into discretionary spending capabilities. All these influences imply that the contribution to consumer spending from newcomers during the population surge was muted relative to past periods. As a result, the other factors in the economy that have boosted domestic spending growth were able to outrun the drag that would normally emanate from slowing immigration flows.
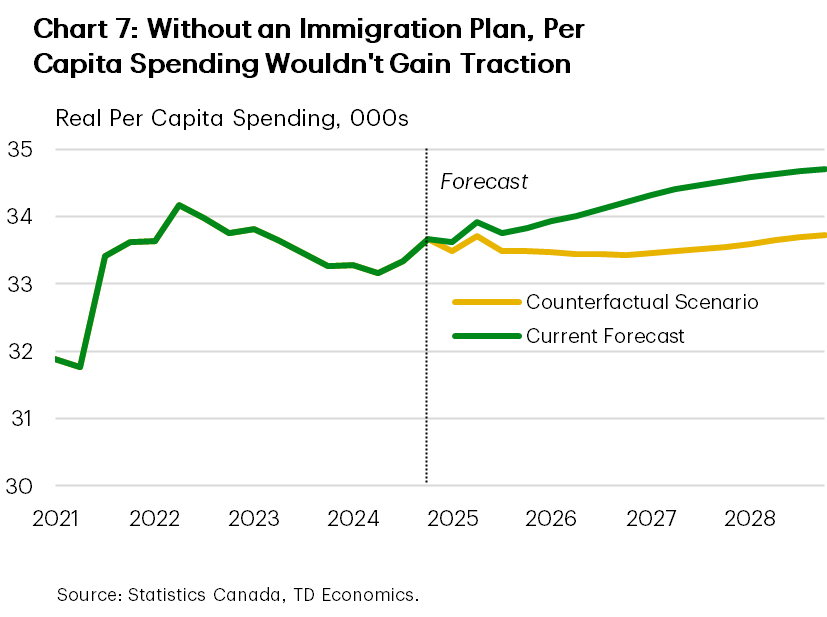
The net result is a rise in real per capita spending after almost two years of decline, putting it on pace to surpass its mid-2022 peak by next year. In contrast, had population flows been maintained in its elevated state, we estimate that real per capita spending would have only started turning higher in mid-2027 (Chart 7).
Bottom Line
The federal government’s revised immigration policy is beginning to pay dividends in returning balance to a stretched social infrastructure. Although the policy alone does not resolve all of Canada’s structural issues, it was an important reform at the right time in the economy. It has contributed to easing pressure in the national housing market—particularly in rentals — and has stemmed a harsher run-up in unemployment during a challenging economic period. And, in a twist, the real economy has not absorbed a significant negative hit to consumer spending, although it remains early days on this analysis. All told, these developments are proving timely as the country simultaneously navigates a policy shock from the United States. That shock also serves as a reminder that immigration will need to maintain a crucial role in supporting Canada’s economic resilience. Policymakers need to continuously develop solutions and programs that assist with the necessary economic transition that’s unfolding, to enhance strength and productivity in the labour market.
Disclaimer
This report is provided by TD Economics. It is for informational and educational purposes only as of the date of writing, and may not be appropriate for other purposes. The views and opinions expressed may change at any time based on market or other conditions and may not come to pass. This material is not intended to be relied upon as investment advice or recommendations, does not constitute a solicitation to buy or sell securities and should not be considered specific legal, investment or tax advice. The report does not provide material information about the business and affairs of TD Bank Group and the members of TD Economics are not spokespersons for TD Bank Group with respect to its business and affairs. The information contained in this report has been drawn from sources believed to be reliable, but is not guaranteed to be accurate or complete. This report contains economic analysis and views, including about future economic and financial markets performance. These are based on certain assumptions and other factors, and are subject to inherent risks and uncertainties. The actual outcome may be materially different. The Toronto-Dominion Bank and its affiliates and related entities that comprise the TD Bank Group are not liable for any errors or omissions in the information, analysis or views contained in this report, or for any loss or damage suffered.
Download
Share: