Highlights
- Canada’s business dynamism is struggling to get back on its feet post-pandemic. Business dynamism was already on a downward trajectory before COVID-19, and now a slow rate of business entries and a rise in bankruptcies has revealed dynamism remains weak.
- Companies, employing more than 20 and fewer than 500 employees are at the forefront of this downturn. Growth in the number of active firms within these cohorts declined during the pandemic and remained tepid since 2021.
- At the industry level, several sectors are growing at a much slower pace than before the pandemic. While several sectors have emerged stronger. Knowledge-based sectors are expanding, however, growth in housing-related sectors has not resulted in increased competition or productivity.
- Easier financing conditions and a more balanced labour market should support a rebound in business creations. Additional policy measures aimed at reducing regulatory barriers, fostering entrepreneurship, and encouraging innovation may be necessary to help businesses shake-off the lingering effects of the pandemic.
Business dynamism is a critical part of a vibrant economy as it ties closely to competitiveness, innovation, and productivity growth. Business dynamism is measured by the rates at which firms enter the market, grow, and leave the market. While the global trend of declining entry rates has been widely noted even before the pandemic, the pace of deterioration, its underlying factors and recent trends are not uniform across countries. In Canada, entry rates have been on a downward trajectory since early 2006. According to recent research by the Bank of Canada, business entry rates experienced a significant decline between 2006 and 2021, leading to reduced competitive pressures1.
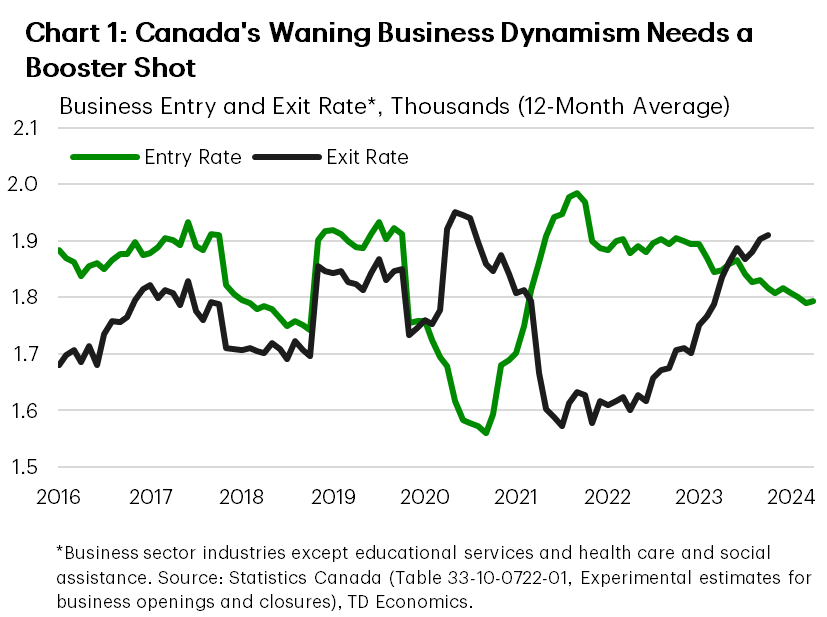
Statistics Canada’s monthly estimates show that the entry rate remains flat while exit rate has accelerated recently, underscoring the lingering economic impacts of COVID-19.
Such dynamics can lead to slower growth, stagnation or even decline in the number of companies in the economy. The implications vary depending on the types of businesses that remain. Fewer but more productive companies could benefit the economy by driving growth with greater efficiency, but could reduce competitive pressures. However, fewer inefficient companies would be bad news for productivity. Even more concerning is the potential lack of opportunities for new companies to enter and grow. Unfortunately, aggregate figures rarely provide clear answers to these issues, so we take a step-by-step approach, analyzing trends by firm size and industry level.
Also, dynamism trends are shifting across firms of different sizes and across industries. Mid-sized firms (employing 20-499 employees) appear to be seeing the greatest losses in active businesses, while there are divergent trends across industries. Some sectors experienced unsustainable growth before the pandemic and are now adjusting, while others may have been disproportionately impacted by labor shortages or are struggling due to reduced demand. In contrast, some sectors have done well post-pandemic, with business creation accelerating.
Increased Business Exits Weigh on Canada’s Business Dynamism
Higher exit rates have been driving a slowdown in net business creations since 2023. (Chart 1). Business exits are not yet estimated for early 2024, but we can back out a conclusion given that there’s been a nearly 70% increase in bankruptcies over the first half of 2024 relative to the same period in 2023. Based on historic relationships between bankruptcies and exits, the exit rate is likely to continue to rise.
Compared to net business entries in the United States, the difference is striking2. While both countries saw an above-average boost to net entries in the early reopening phase, the recovery was more robust and lasted longer south of the border. By the end of 2022, Canada’s net entry rate had fallen below the pre-pandemic average, while the U.S.’s had surpassed it. Due to U.S. data limitations, we can’t compare exits in 2023, but entries and new business applications remain above average, while Canada’s are stagnant. Canada’s increase in firm exits could be partially a catch up from the unusually low pandemic levels. It could also indicate a delayed process of less productive firms closing. Still, it’s too early to see evidence that it has led to broad productivity gains. Alternatively, high exit rates could indicate declining investment opportunities or an unfavorable business environment. In any case, a sluggish rate of entries combined with an acceleration in exit rates could result in the persistently low or declining net entry rate, leading to fewer active businesses. Deteriorating growth in new businesses points to a widening gap in business vibrancy between Canada and the U.S.
Rising Bankruptcies – a Symptom of Long COVID
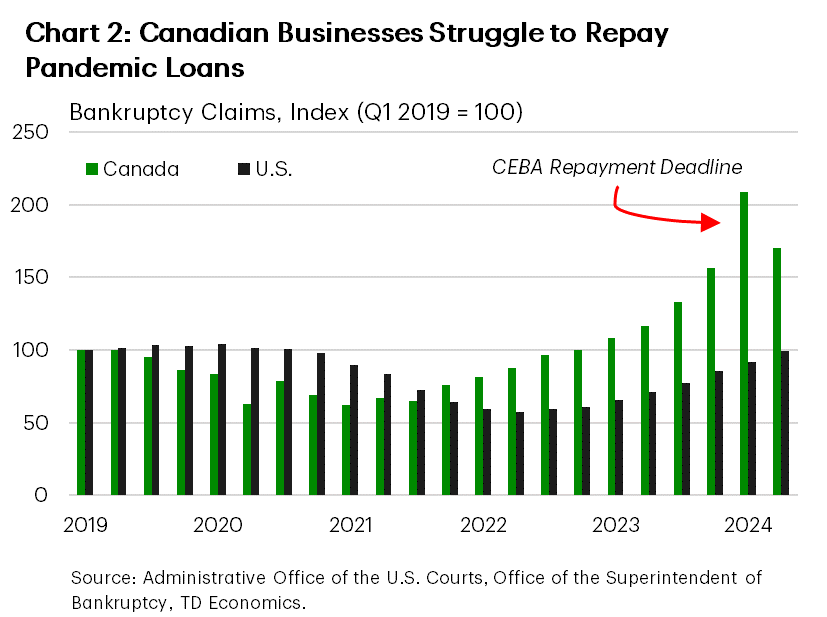
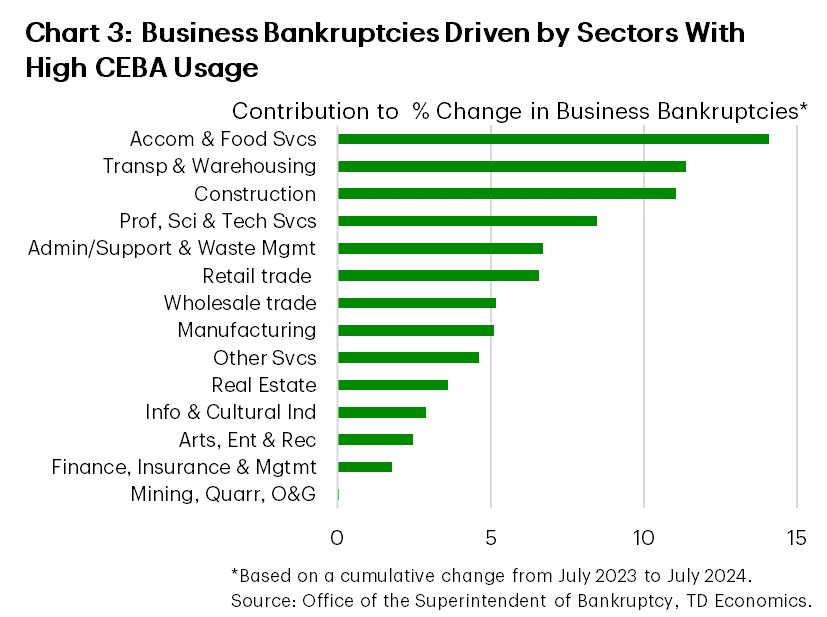
The spike in Canada’s business bankruptcies is another compelling symptom of the pandemic’s enduring impact. The rise in bankruptcies is closely linked to the January 2024 repayment deadline for Canada Emergency Business Account (CEBA) loans and the start of collection of CEBA loans in default (Chart 2). Notably, this surge is driven by industries with the largest share of firms requesting CEBA loans during the pandemic—accommodation & food services, transportation & warehousing, and construction (Chart 3). This suggests that government support measures, or at least the CEBA program, delayed but did not eliminate the financial woes triggered by COVID-related lockdowns. CEBA suppressed the typical number of business bankruptcies during the pandemic period, and these closures appear to now be coming in a wave.
In contrast, U.S. bankruptcies, while also rising, appear to be normalizing from artificially low pandemic levels. By Q2 2024, U.S. bankruptcies remained below pre-pandemic levels, whereas in Canada, they were 70% higher. The more generous forgiveness terms of the U.S. Paycheck Protection Program (PPP) may have provided more enduring relief, helping businesses weather the storm more effectively than CEBA.
Mid-sized Companies on Sick Leave
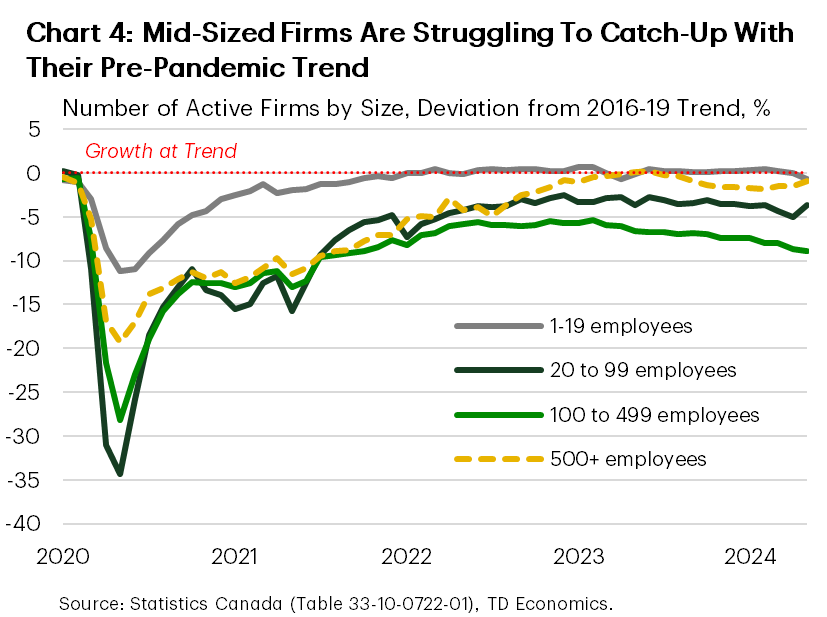
In terms of learning other characteristics of what kind of firms have seen the most closures, we don’t have direct data on the size of companies filing for bankruptcy. However, we do know that the slowdown in the growth of active businesses has been more pronounced among medium-sized firms employing 100-499 employees, which are down by 9% relative to trend, and small firms employing 20-99 employees, which declined by 4.4% by the same measure (Chart 4). Notably, this deviation has persisted since 2021, while gaps for micro (with 1-19 employees) and large companies (with 500+ employees) have narrowed. Despite their potentially lower productivity compared to large firms, the softer growth in business creation among these cohorts could be concerning for the Canadian economy, as it may signal fewer opportunities for scaling up. A deeper look at the industrial level reveals more about this trend.
The slowdown in the growth of firms employing 20-99 employees is spread across multiple industries (as discussed in the following sections). In contrast, for medium-sized firms the impact is most prominent in the manufacturing sector. Between 2019 and early 2024, the number of medium-sized manufacturing firms fell by over 3%, a sharp contrast to the 14% growth predicted by pre-pandemic trends. This decline accelerated notably in the third quarter of 2022, coinciding with rising interest rates, inflation, growing concerns about a potential recession, and the U.S. passing measures with strong incentives for domestic manufacturing (see our report on Inflation Reduction Act and the Chips and Science Act). These challenges may have led many manufacturers to shut down operations. As a result, the total number of mid-sized manufacturing businesses is 10% lower than it would have been if it had continued growing at the pre-pandemic rate.
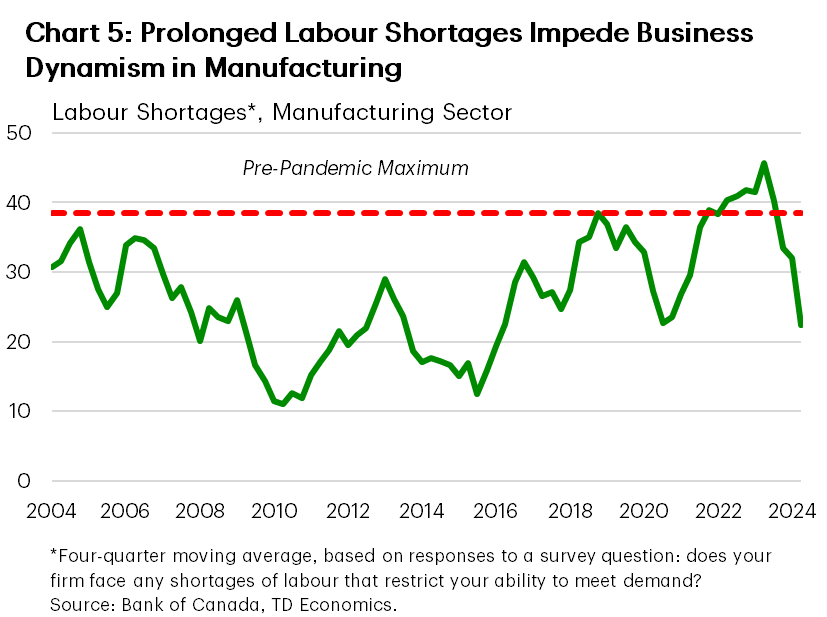
Similarly, there remains a 9% gap between the pre-pandemic trend and the current level of manufacturing output. One potential factor that disproportionately impacted the sector’s performance is labour shortages. Typically, manufacturing benefits from labour specialization and mechanization, but the pandemic-induced deficit of skilled workers has eroded these advantages. Manufacturing has had the highest vacancy rate among goods-producing sectors and had suffered the most prolonged shortage of skilled labour. According to the Bank of Canada’s Business Outlook Survey, labour shortages that hindered the sector’s ability to meet demand have remained at historic highs for over two years (Chart 5). This is despite the sector receiving the most support from the Canada Emergency Wage Subsidy, which was intended to help firms retain their workforce3.
Pre-existing Conditions in the Transportation Sector
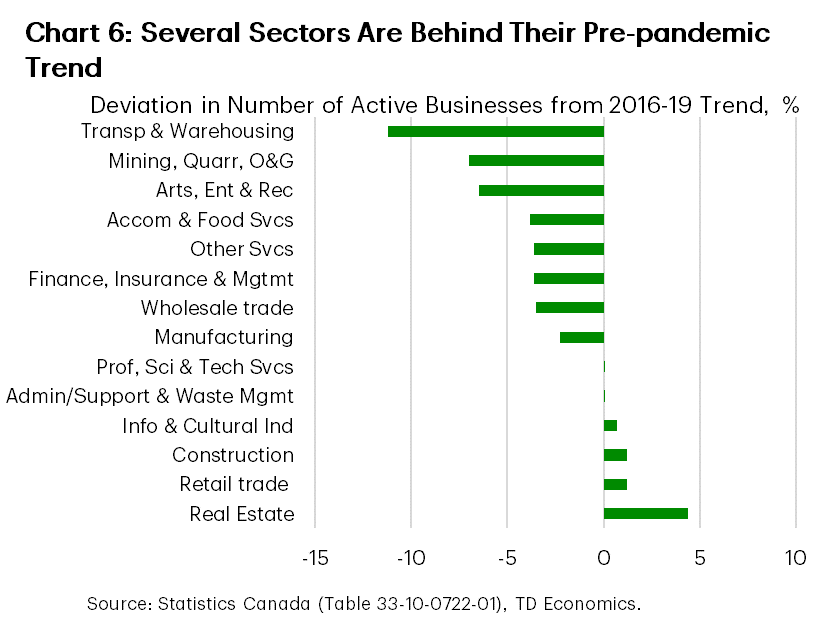
Several other sectors have also experienced a much slower pace of business creation compared to pre-pandemic levels (Chart 6). For instance, the number of active businesses in the transportation and warehousing sector is now 11% below its pre-pandemic trend, compared to just a 0.5% gap for the business sector as a whole. Moreover, despite a sizeable recovery from its trough, there are still 1% fewer active firms than in 2019, while business sector firms have grown by 2.4%.
This is in line with the sector’s output, which also shows the largest deviation from trend, with a 17% gap and a 4% decline from 2019 levels. These figures suggest that the sector hasn’t fully recovered from the pandemic. The slowdown can be partly attributed to the sector’s rapid expansion before the pandemic, which outpaced Canada’s overall business sector by four times and U.S. transportation and warehousing by nearly three times. This growth was fueled by an influx of micro-sized firms employing 1-4 employees, particularly in the truck transportation segment, which accounts for a quarter of the sector’s GDP. During this period many truck drivers registered as corporations and worked as independent contractors for carriers, boosting the number of micro-firms. We anticipate that the sector will need to undergo a period of consolidation, particularly in sub-sectors like trucking. In addition, recent labour disputes suggest that the sector’s troubles may not be over, and more may need to be done to resuscitate the transportation sector.
Some Services Sectors Have Long Covid
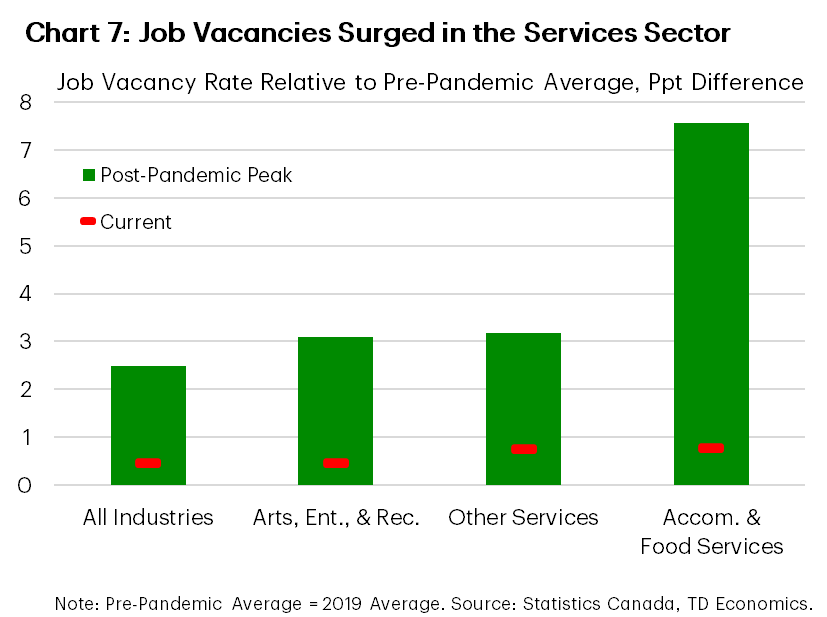
Other sectors where growth in the number of businesses dropped below their pre-pandemic trends are arts, entertaining & recreation, accommodation & food services as well as other services (which include repair and maintenance, personal care services like haircuts and manicures, dry cleaning etc.). These sectors’ pre-pandemic momentum is relatively comparable to that of the business sector or their counterparts in the U.S. However, despite a surge in consumer demand following the end of lockdowns, these industries were hindered by a sizeable increase in job vacancies, restricting firms’ ability to originate and grow due to a lack of available workers (Chart 7).
Inflationary pressures and high borrowing costs are also impacting business dynamism in these sectors by prompting consumers to cut back on discretionary spending. Even with further easing from the Bank of Canada, high household debt levels and mortgage renewals will continue to strain budgets for many households. Combined with elevated job vacancies, a slowdown in discretionary spending will likely keep business formation in these industries subdued over the near-term.
As a result, these sectors may face a slow recovery and go through a period of consolidation. The accommodation and food services industry is already experiencing declines in active businesses, particularly among small companies. While these sectors have experienced slight productivity gains in recent years, the arts, entertainment, and recreation sectors have not been as fortunate. In these industries, the gap in active businesses relative to pre-pandemic trends is driven primarily by large employers still adjusting to the post-pandemic environment.
The Tale of Two Immunities
On the other hand, some sectors have emerged from the pandemic stronger, creating firms at a faster pace than before. Information and cultural industries, construction, retail trade, and real estate have all exceeded their pre-pandemic growth trends. Above-trend growth in information & cultural industries is great news for the economy as several of its sub-sectors, known as knowledge-based industries (i.e. as software publishing, telecommunications services and data processing) is driven by large-sized firms, fed by migration from middle-sized firms. A similar dynamic is seen in the professional, scientific and technical services sector – another knowledge-based group growing at its pre-pandemic trend. Since these sectors are also leading in labour productivity, this trend suggests that some level of creative destruction is at play, with the exit of less productive firms leading to gains in overall productivity.
However, the booming real estate and construction sectors raise concerns about the sustainability of this growth. In the case of construction, the acceleration was driven by mid-sized companies and firms with 5-19 employees, while real estate relied on micro firms with 1-4 employees. These sectors have been driven primarily by demand for housing, which has remained relatively resilient despite economic headwinds and high interest rates.
The recent growth in the number of firms in construction highlights the fragmented nature of the sector, where many firms operate in niche markets. The industry is generally divided into non-residential and residential sectors, with larger firms typically focusing on non-residential projects, while small and medium enterprises dominate the residential sector. The latter has thrived over the past four years, fueled by strong immigration following the pandemic-induced rush for space.
The real estate sector has also benefited from resilient housing demand. While this growth has supported employment and economic activity, it may come at the cost of long-term productivity due to the pre-dominance of micro firms, which collectively account for 79% of the whole sector (vs. 63% for the business sector). Additionally, public policy discussions in Canada increasingly focus on the need for more affordable housing. Government measures aimed at rebalancing the demand-supply dynamics and curbing future price increases could slow housing market activity, potentially acting as a drag on both new business formation and employment.
Bottom Line
Canada’s business dynamism is showing signs of a slump. Mid-sized companies, especially in manufacturing, are struggling to regain their pre-pandemic momentum, likely due to shifting employment preferences and economic uncertainties. Several service sectors have not fully recovered even with significant reliance on pandemic support programs, while others grow in ways that may harm long-term productivity.
Despite this challenging situation, there are key opportunities to help boost the trajectory of business dynamism in Canada. In the short term, easing financial conditions, through further interest rate reductions, should improve access to capital and encourage investment. The labour market, bolstered by immigration, should also help industries that have struggled with post-pandemic worker shortages, though some sectors may need to invest in targeted training programs. Additionally, policy initiatives, aimed at reducing regulatory barriers, fostering entrepreneurship, and encouraging innovation would create a more favourable environment for business dynamism. These measures could revive business formation and support long-term economic growth in Canada.
End Notes
- Gu, W (2024) “Investment Slowdown in Canada After the Mid-2000s: The Role of Competition and Intangibles”. Available at: https://www150.statcan.gc.ca/n1/pub/11f0019m/11f0019m2024001-eng.htm (Accessed August 2024).
- For Canada, we used Statistics Canada’s monthly table 33-10-0270-01 “Experimental estimates for business openings and closures”. For the U.S., we used the BLS’s “Business Employment Dynamics” table 7. While the methodologies of these data sources are not comparable, they both estimate openings and closures at the location level.
- Lin, X., Hoffarth, M (2023) “An analysis of Canadian business support programs in response to the global COVID-19 pandemic”. Available at https://www150.statcan.gc.ca/n1/pub/13-605-x/2023001/article/00001-eng.htm (Accessed August 2024)
Disclaimer
This report is provided by TD Economics. It is for informational and educational purposes only as of the date of writing, and may not be appropriate for other purposes. The views and opinions expressed may change at any time based on market or other conditions and may not come to pass. This material is not intended to be relied upon as investment advice or recommendations, does not constitute a solicitation to buy or sell securities and should not be considered specific legal, investment or tax advice. The report does not provide material information about the business and affairs of TD Bank Group and the members of TD Economics are not spokespersons for TD Bank Group with respect to its business and affairs. The information contained in this report has been drawn from sources believed to be reliable, but is not guaranteed to be accurate or complete. This report contains economic analysis and views, including about future economic and financial markets performance. These are based on certain assumptions and other factors, and are subject to inherent risks and uncertainties. The actual outcome may be materially different. The Toronto-Dominion Bank and its affiliates and related entities that comprise the TD Bank Group are not liable for any errors or omissions in the information, analysis or views contained in this report, or for any loss or damage suffered.
Download
Share: