Bond Yields:
Higher for Longer — and for Fundamental Reasons
Vikram Rai, Senior Economist | 416-923-1692
Date Published: September 10, 2026
- Category:
- Canada Financial Markets
Highlights
- U.S. Treasury yields have risen across the curve in 2026, with the 10-year yield climbing roughly 80 basis points from its late-February low through the first week of September.
- Most of the increase reflects expectations that the Federal Reserve will keep rates higher than previously anticipated and a larger premium for holding long-dated debt, while long-run short-rate expectations have changed little.
- Shorter-term cyclical pressures should ease as inflation and growth cool, but heavy government and corporate borrowing and weaker demand from traditional bond buyers are more structural. Yields are therefore likely to remain elevated, with the curve relatively flat by historical standards.
In our latest client Q&A update in early August, we examined the forces driving the sharp rise in U.S. and global bond yields. We highlighted two in particular: growing expectations of Fed and other central-bank rate hikes, and the additional compensation investors were demanding to hold long-dated debt amid geopolitical uncertainty and surging government and corporate issuance.
Since then, these pressures have only piled up. As the ceasefire in the Middle East dissolved, oil prices jumped back above US$90 per barrel—the highest level since early June—stoking inflation concerns. U.S. economic data have been strong for the most part, with payroll gains rebounding sharply in August. Fed Chair Warsh’s Jackson Hole speech was decidedly hawkish, dismissing the past few months of softer core inflation as unconvincing evidence that inflation has finally turned a corner. Meanwhile, markets are bracing for a frenzy of new Treasury and corporate supply as the calendar turns to autumn.
Accordingly, after briefly pausing earlier in August, the sell-off in U.S. Treasuries has reasserted itself over the past few weeks. The 10-year Treasury yield has risen from 4.65%–4.70% earlier in August to around 4.80%—its highest level since 2023—while the 30-year yield has remained near a two-decade high of roughly 5.25%. The biggest move across the Treasury curve since mid-August has been at the 2-year tenor, which has risen another 20 basis points to above 4.35%.
The renewed rise in long-term yields prompted a response from Treasury Secretary Scott Bessent in late August. He announced an increase in purchases intended to support trading in longer-dated bonds while leaving the Treasury’s regular borrowing plans unchanged. The purchases would be funded through greater issuance of short-term debt, although he also raised the prospect of using the Treasury’s general account to buy longer-term debt. Any relief appears to have been modest and short-lived, however, as 30-year yields continued to rise in late August and September. This was the second time that month that the U.S. Treasury appeared to take an activist stance to limit upward pressure on yields. Earlier, it had intervened in the yen market through euro sales—a move that may have been intended to reduce Japan’s need to sell U.S. Treasuries.
Decomposing the Rise in the 10-Year Yield
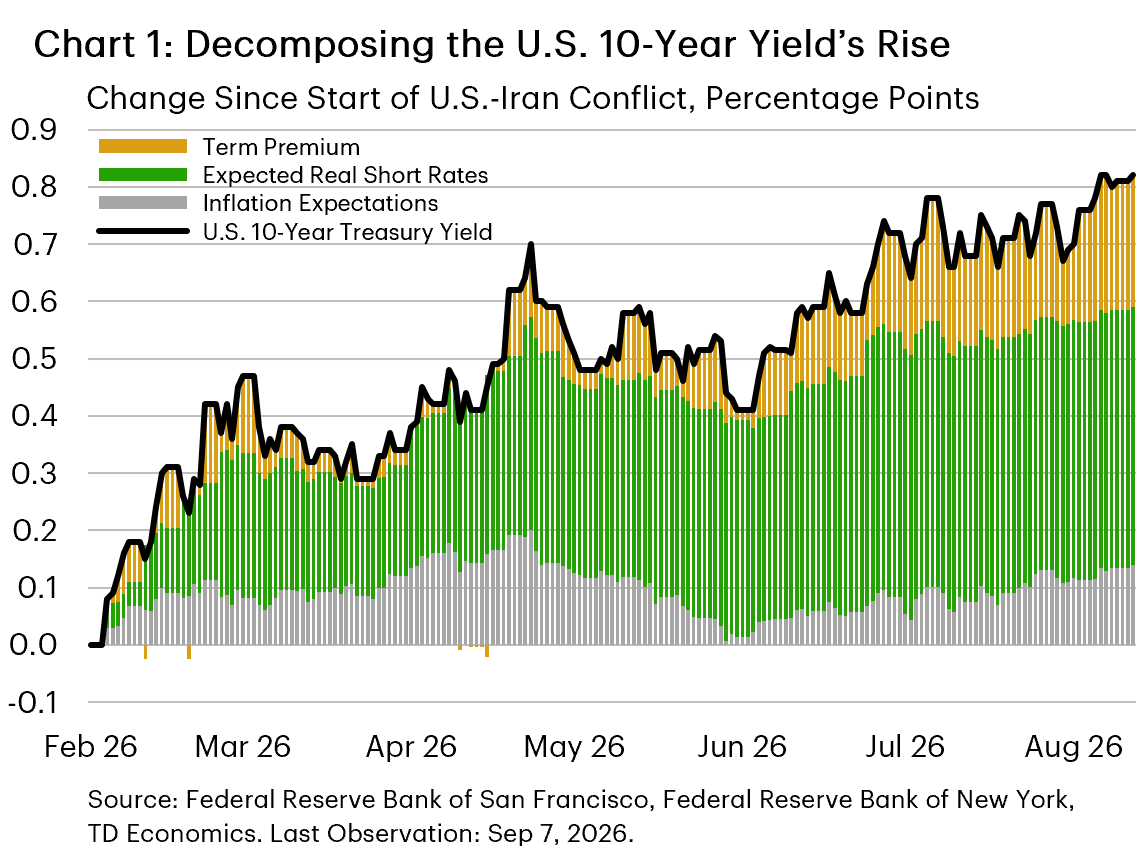
Despite those efforts, yields remain roughly 80 basis points higher across the curve than at their late-February lows. To understand why the increase has persisted, it helps to separate the cyclical and structural forces behind the move.
Chart 1 decomposes the increase in the 10-year yield into three main drivers: expected short-term interest rates, expected inflation and the term premium—that is, the additional return investors demand for holding longer-dated debt. We focus on the 10-year yield because it is a key risk-free benchmark for intermediate- to long-term borrowing and investing. It also strongly influences U.S. mortgage rates and a disproportionate share of long-term borrowing costs, while benefiting from deep liquidity and trading volume.
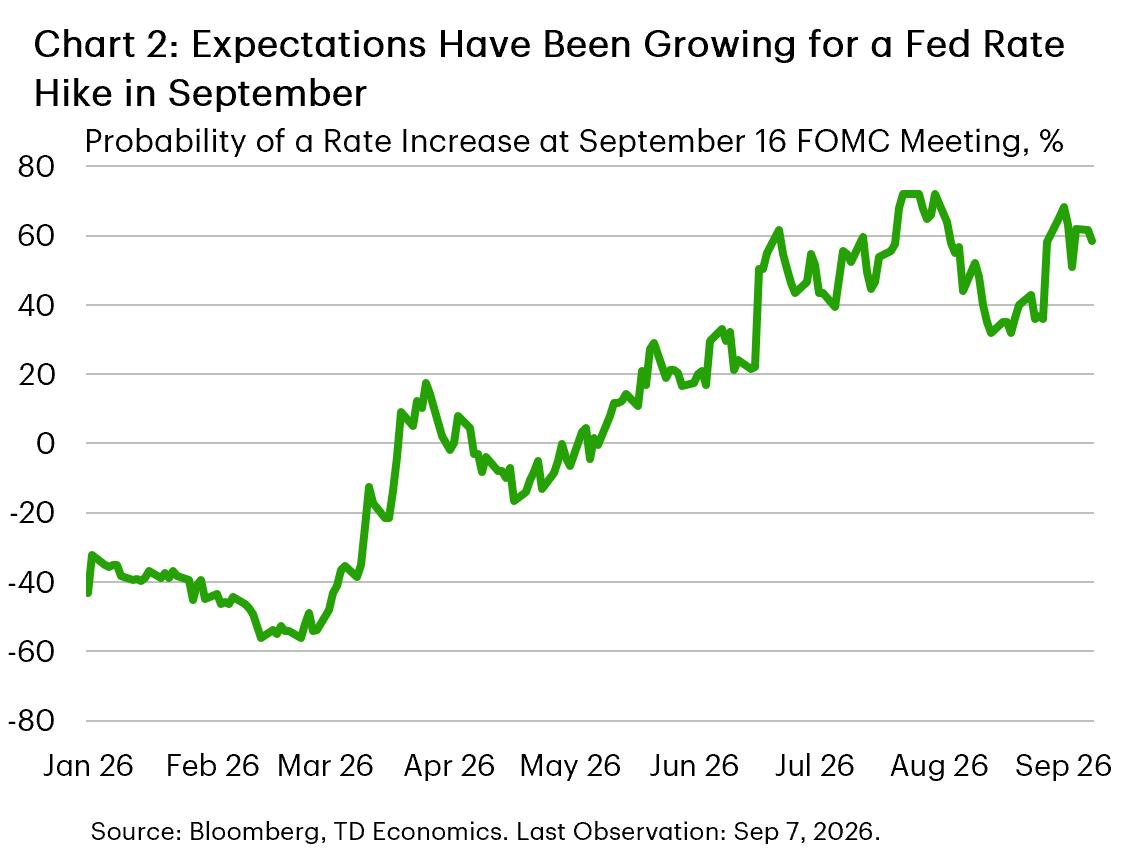
Since late February, changes in expected short-term interest rates have been the primary driver of the rise in 10-year yields, contributing 50 basis points of the overall 80-basis-point increase. Early this year, markets had been betting on Fed rate cuts over the next year, but expectations have since swung toward growing odds of rate hikes (Chart 2). Fed funds futures are currently pricing in roughly 60% odds of an increase by the FOMC next week, with 50 basis points of tightening embedded over the next 18 months. But long-run rate expectations have not shifted as much, and Fed funds futures already imply some reversal at the end of next year. Even if these rate hikes come to pass, all indications are that they would be a temporary response to cyclically high inflation.
The second most important factor driving up yields since the winter has been a higher term premium (+20 basis points). That said, its contribution has remained fairly stable since mid-July. Most estimates put the term premium on the U.S. 10-year Treasury yield in the range of 80–100 basis points today. This is higher than was typical over the past 15 years, but would have been a somewhat low reading before the 2008 financial crisis (Chart 3).
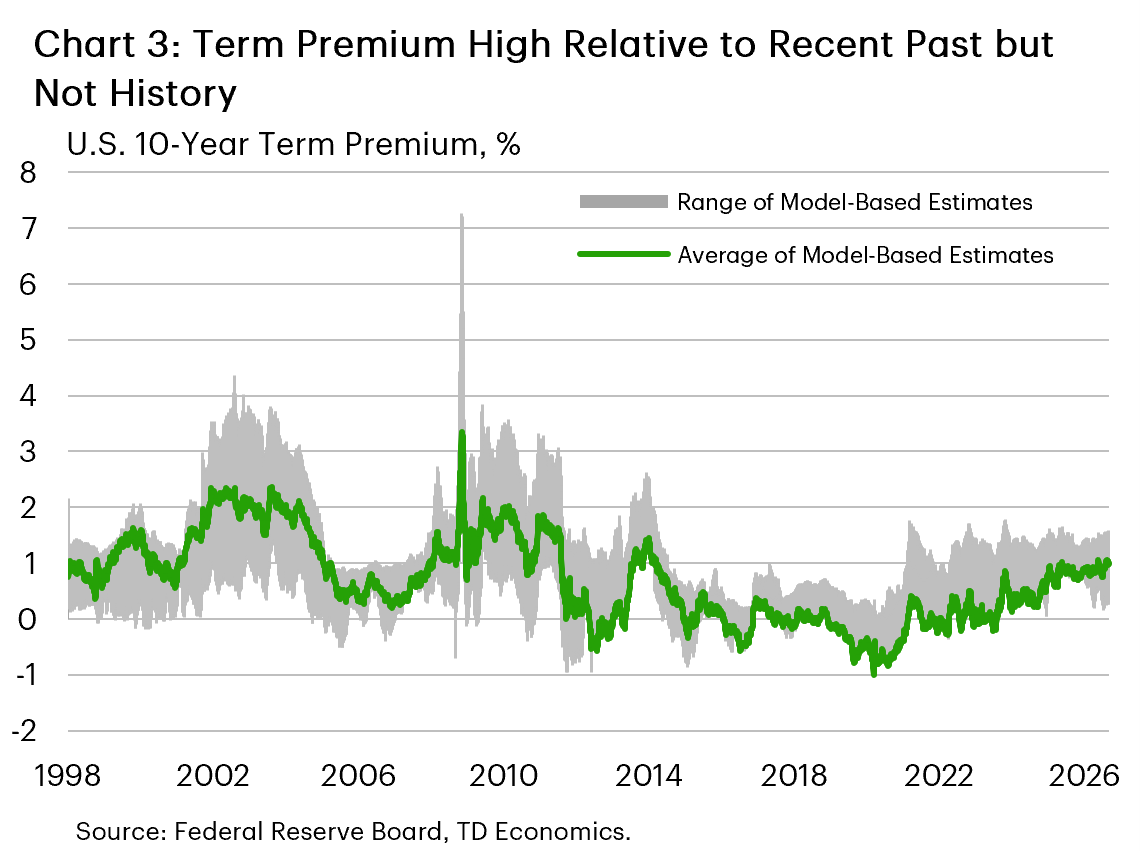
The term premium therefore provides the clearest bridge from cyclical repricing to the more persistent forces affecting yields. Unlike short-rate expectations, it is shaped largely by structural conditions—most notably the growing imbalance between bond supply and demand.
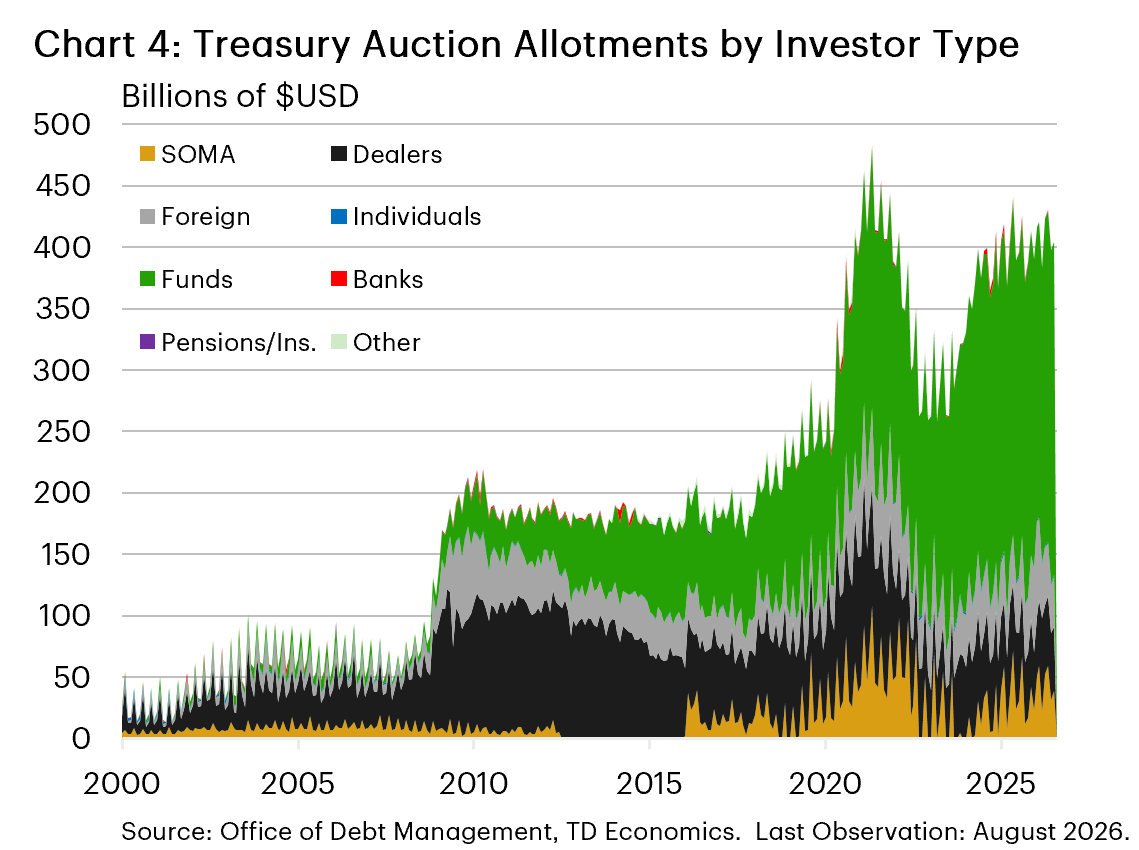
The U.S. government is borrowing more as some traditional buyers step back. Central bank holdings peaked during the pandemic; foreign governments and central banks now hold 13% of publicly traded Treasuries, down from 15% three years ago. Meanwhile, investment funds’ share of Treasury purchases has risen from 57% to 67% in 2026, compared with less than 10% in the early 2000s (Chart 4). Private investors must therefore absorb a growing share of government debt and are demanding higher yields to do so.
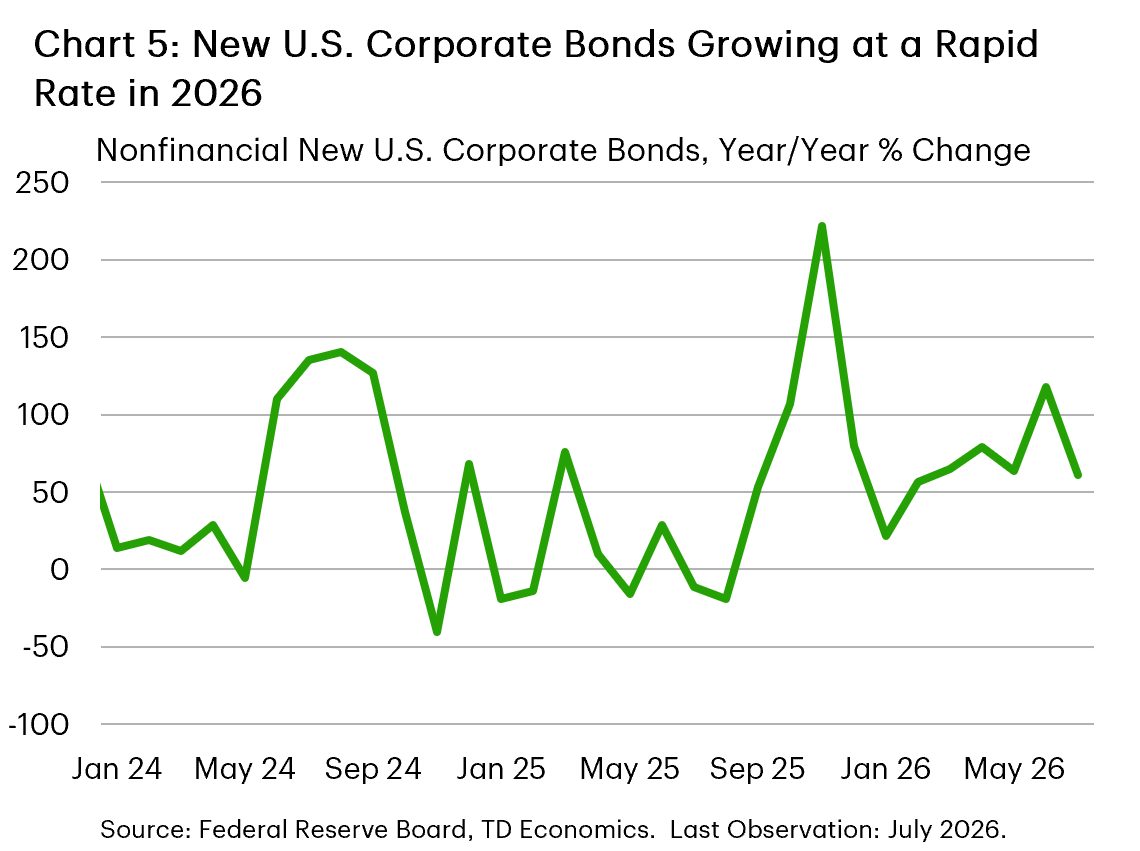
Corporate borrowing is also adding to the competition for capital, meaning that both supply and demand conditions in the bond market tilt towards higher yields. After subdued growth in 2025, new corporate bond issuance has accelerated sharply, running 50% to 100% above the same period last year (Chart 5). With more government and corporate debt coming to market, investors have greater scope to demand higher returns, even if this debt is still largely considered safe to hold.
Alongside these two larger drivers, inflation expectations account for only about 10 basis points of the recent increase. That does not mean higher oil prices and inflation volatility have been unimportant: they have also influenced yields indirectly by lifting expected short-term rates and widening the term premium. Taken together, the decomposition points to a mix of cyclical and structural pressures—a distinction that also helps explain the current shape of the curve.
How Does the Slope of the Treasury Curve Compare with History?
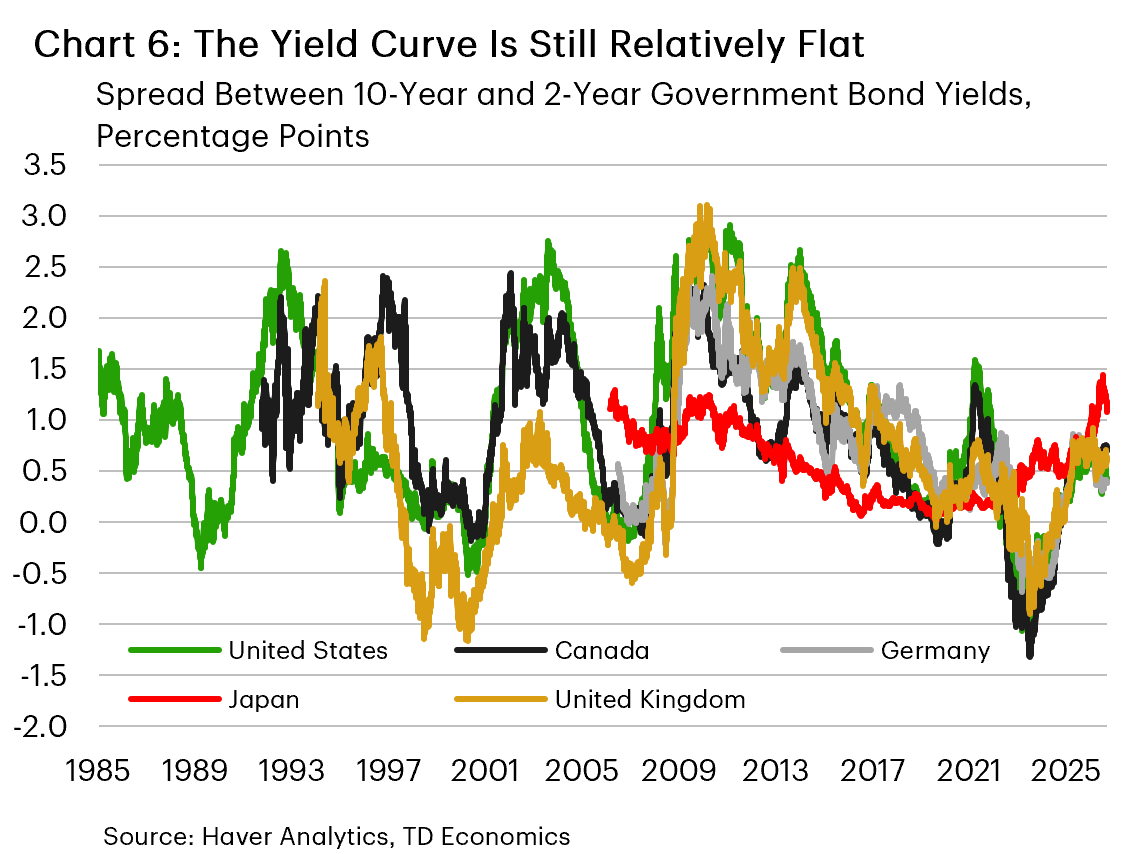
While the focus earlier this summer was on the sharp steepening of the U.S. Treasury curve, that narrative has shifted in recent weeks as increases in 2-year yields have outstripped those at the 10- and 30-year tenors. The 10-year–2-year spread has consequently narrowed to around 40 basis points, compared with roughly 70 basis points at the start of the year and about 100 basis points on average historically (Chart 6). This relatively flat curve is consistent with the mix of forces described above: cyclical inflation and policy-rate pressures are lifting shorter maturities, while structural supply-demand imbalances are keeping longer-term yields elevated. Even if cyclical pressures ease, a persistently higher term premium should limit the decline in long yields, leaving the curve at a higher overall level but flatter than historical norms.
A Global Bond Selloff, Led by the U.S.
These pressures are not confined to the U.S. The broad rise in G-7 yields partly mirrors the Treasury selloff, although domestic conditions have shaped the size of each move (Charts 7 and 8). Since the relative low in yields before the conflict with Iran, 10-year yields have risen by about 80 basis points in the U.S. and 60 basis points in Canada. Canada’s smaller deficits have limited the increase, while firmer domestic data and more hawkish Bank of Canada messaging have recently kept the Canada–U.S. spread from widening further.
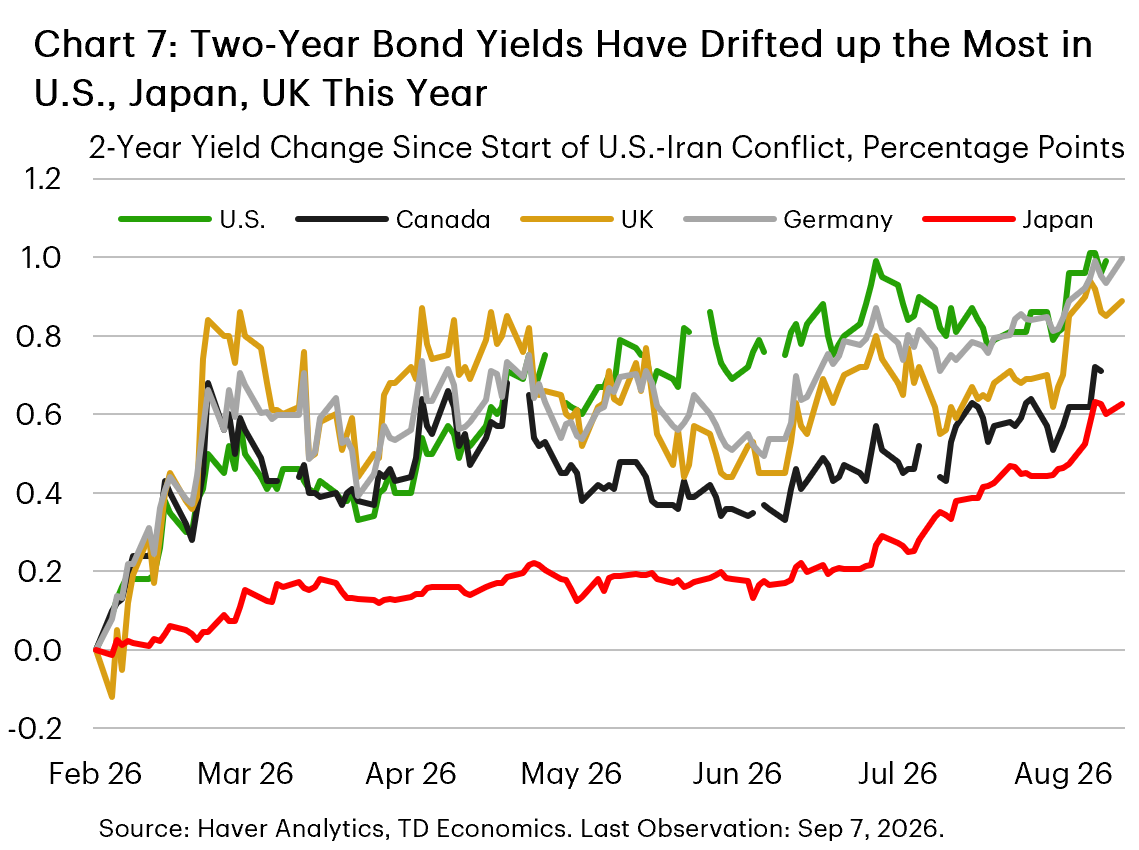
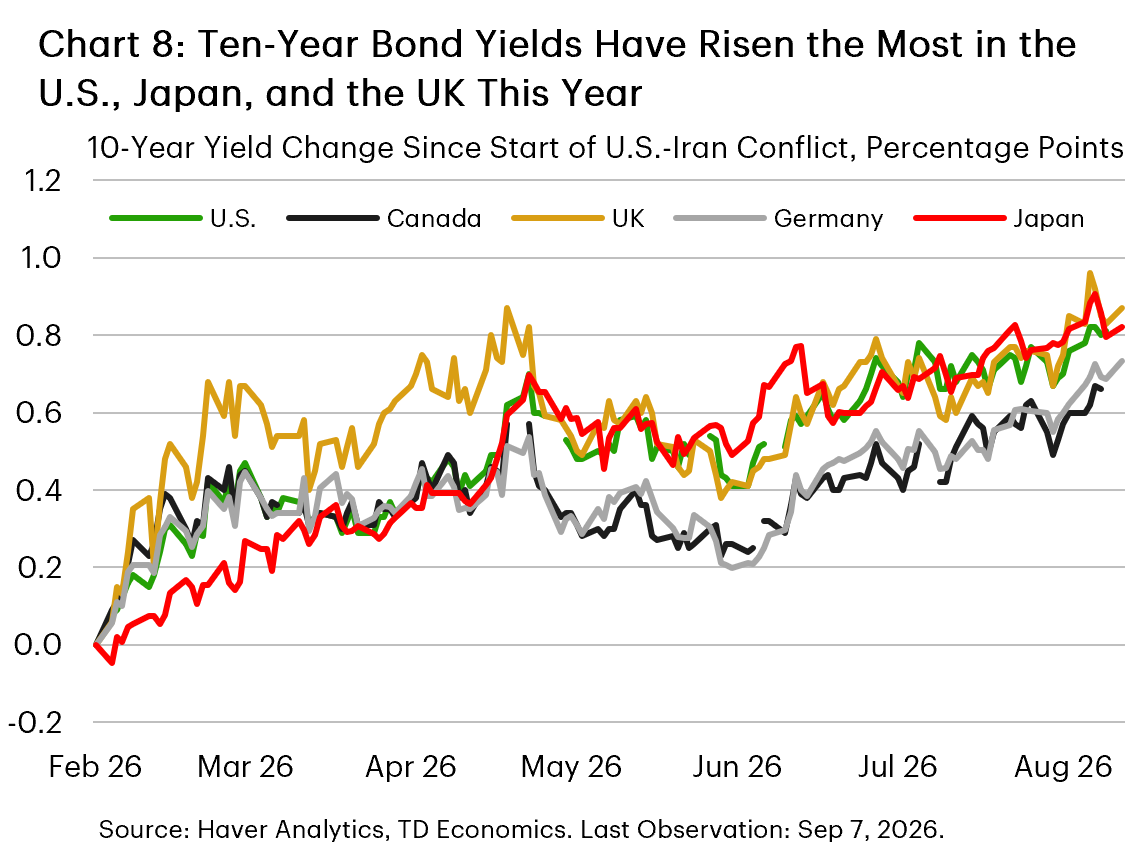
Japan has faced the most persistent pressure since the start of the year, as monetary normalization, reduced central-bank bond buying, inflation and concern over the debt-service burden have repriced the entire curve. The UK move is also unusually large—roughly 50 basis points at the 10-year since July—reflecting both the global selloff and limited fiscal headroom, which makes higher debt-interest costs more likely to force tax increases or spending restraint.
Germany’s roughly 46-basis-point increase is less a debt-sustainability story than a supply shock. Borrowing is accelerating sharply from a low base to fund defence and infrastructure, requiring investors to absorb a much larger flow of Bund issuance.
Across these markets, the common thread is heavy government borrowing at a time when inflation remains above target and central banks are no longer major buyers of sovereign debt. The differences lie in the source and severity of the pressure: Canada’s smaller deficits have provided some insulation, Japan and the UK face the greatest fiscal strain, and Germany is confronting a sharp increase in issuance from a comparatively low base.
Bottom Line - Yields to Stay Higher for Longer
The analysis therefore points to a mix of shorter-term cyclical and longer-term structural forces behind the rise in U.S. and global yields. Predicting the top of the cycle is a mug’s game, but several factors should restrain a further increase through year-end, including our expectation that U.S. core inflation and oil prices gradually moderate. The structural pressures, however, show little sign of fading—particularly heavy government and corporate issuance, reduced demand from traditional bond buyers and a higher term premium. As cyclical pressures subside, these forces should keep yields elevated; with short-term rate expectations also likely to decline only gradually, the curve should remain relatively flat by historical standards. The scope for a significant and broad-based bond rally by year-end therefore appears limited.
Disclaimer
This report is provided by TD Economics. It is for informational and educational purposes only as of the date of writing, and may not be appropriate for other purposes. The views and opinions expressed may change at any time based on market or other conditions and may not come to pass. This material is not intended to be relied upon as investment advice or recommendations, does not constitute a solicitation to buy or sell securities and should not be considered specific legal, investment or tax advice. The report does not provide material information about the business and affairs of TD Bank Group and the members of TD Economics are not spokespersons for TD Bank Group with respect to its business and affairs. The information contained in this report has been drawn from sources believed to be reliable, but is not guaranteed to be accurate or complete. This report contains economic analysis and views, including about future economic and financial markets performance. These are based on certain assumptions and other factors, and are subject to inherent risks and uncertainties. The actual outcome may be materially different. The Toronto-Dominion Bank and its affiliates and related entities that comprise the TD Bank Group are not liable for any errors or omissions in the information, analysis or views contained in this report, or for any loss or damage suffered.
Download
Share: