Biden’s Build Back Better Plans Could Boost Growth Over Medium-Term
Leslie Preston, Director & Senior Economist | 416-983-7053
Date Published: June 2, 2021
- Category:
- U.S.
- Government Finance and Policy
Highlights
- President Biden has laid out the next phase of his economic policy agenda in the American Jobs and Families Plans (AJP & AFP). These plans could boost growth over the medium term and enhance the economy’s longer-run growth potential.
- That is because the fiscal multipliers for the proposed spending measures, particularly infrastructure, are larger than the expected drag from tax increases on corporations and high-income taxpayers.
- In addition, spending on infrastructure and childcare measures could also help lift the longer-term potential of the economy through productivity growth and increased labor supply.
- A narrow majority in the Senate means that the proposals are unlikely to pass as is. Negotiations with moderate Democrats could mean the ultimate package is more modest. Since much of the spending is temporary, while the tax hikes are permanent, deficits are smaller on net by the end of the ten-year budget window. This means the plans could seemingly pass via budget reconciliation.
- However, given the uncertainty with what the package will ultimately look like, we have not yet included the plans in our baseline forecast.
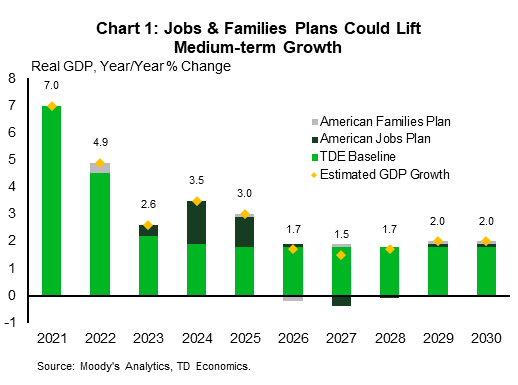
President Biden has laid out the next phase of his economic policy agenda in the American Jobs and Families Plans (AJP & AFP). These plans are aimed at boosting growth over the medium term and at enhancing the economy’s long-run growth potential (Chart 1). This contrasts with the American Rescue Plan (ARP), where the goal was to stimulate the economy in the short-term and assist individuals and businesses who have suffered due to the pandemic.

The plans hew closely to Biden’s campaign platform, with over four trillion in spending touching on almost every aspect of America’s economic and social fabric. The list is long, but the broad categories include an expanded definition of infrastructure (with an environmental bent), research and development, wider access to quality affordable elder care, universal pre-K, two years of free community college, funding for post-secondary, increased supports for child care and extending the more generous tax credits in the ARP. These “investments” are paid for with tax increases on corporations and higher income individuals. Some overarching themes running through many of the initiatives are “Made in America”, creating “good middle-class jobs” and investments “built by union workers”, in addition to many investments that will help combat climate change, all consistent with Biden’s campaign messaging. As outlined in President Biden’s recent budget document, the plans would be a big part of lifting the deficit-to-GDP ratios 1.1 percentage points at their peak in 2024-2026 (Chart 2). Although that would not include any offsetting increase in growth that would come in a dynamic scoring of the budget.
It’s already being telegraphed within the media and ongoing negotiations that the plans are unlikely to pass “as is”. However, we suspect a large share of key elements will be incorporated in the months ahead through some combination of bi-partisan agreement and the budget reconciliation process. Because the magnitude, timing and scope remain undefined, it’s too early to embed a strong view on economic outcomes in our forecast. But, past research on fiscal multipliers suggests that since the multipliers on spending, particularly infrastructure, exceed those from the tax measures, the plan can reasonably be expected to raise growth over the medium term. Perhaps more importantly, there are elements of the plans that could help improve productivity and labor supply, which would help raise the economy’s long-run pace of growth.
Table 1: American Jobs Plan Spending ($ billions, 2022-2031)
| Transportation Infrastructure | 596 |
| Electric vehicles: consumer rebates, grants and making the federal fleet EV. Incentives to build new charging stations. | 157 |
| Modernize bridges, highways, roads, and main streets in critical need of repair | 131 |
| Modernize public transit, invest in rail, ports, waterways and airports | 192 |
| Redress historic infrastructure inequities | 66 |
| Manufacturing, R&D & Job Training | 566 |
| Invest in manufacturing: strengthening supply chains & clean energy manufacturing | 299 |
| Provide funding on research and development for small businesses and innovation hubs, including climate change, the NSI, HBCUs and other MSIs | 180 |
| Work force development and training | 87 |
| Expand Home Care Services & Support for Care Workers | 400 |
| Housing, Schools, Child Care Facilities, Hospitals & Federal Buildings | 326 |
| Investments in Broadband, Electrical Grid, and Clean Drinking Water | 309 |
| Increase funding for high-speed broadband, reduce the cost of broadband internet service, and promote transparency and competition | 100 |
| Revitalize electrical grid & investments in power infrastructure | 98 |
| Replace lead pipes and upgrade drinking water system | 111 |
| Clean Energy Tax Credits* | 307 |
| Total ($ trillions) | 2.5 |
How could the plans boost growth?
The plans have many detailed elements that are outlined in Tables 1 and 2. Various aspects of the plan have differing impacts and timing. Starting with the AJP, of the total $2.5 trillion in spending about $1.2 trillion would be considered traditional infrastructure spending Table 1. These would include spending on construction of transportation, utilities and buildings. As shown in Table 3, infrastructure spending typically has some of the highest multipliers on economic growth among the various types of government measures because it influences the economy in two ways:
- It provides a relatively bigger temporary lift during the construction phase of projects.
- The enhanced infrastructure supports longer-term productivity.
However, infrastructure projects take time to plan and ramp up, so it is highly uncertain when the impacts of this spending would show up. Some other items in the AJP are not infrastructure, but would be expected to also increase productivity, such as investments in research and development (R&D) and workforce training, which could impact growth in the long run through enhanced innovation and productivity.
Table 2: American Families Plan Spending ($ billions, 2022-2031)
| Education | 445 | |
| Universal preschool grants to States | 165 | |
| Free tuition 2-Yr Community Colleges | 109 | |
| 20% expansion to Pell grants | 84 | |
| Various supports for Post-secondary (focus on HBCUs/TCUs/MSIs | 80 | |
| Train, equip and "diversify" Teachers | 8 | |
| Direct Support to Children/Families | 498 | |
| Child Care Related: | 225 | |
| Childcare cost supports - tied to income and capped at 7% of 1.5x state median income | ||
| Invest in "High quality care" | ||
| $15/hr minimum wage for child care workers | ||
| 12 weeks Paid family and medical leave at 2/3rds income to max of $4k/ month | 225 | |
| Expand & improve school meals & summer meal assistance | 48 | |
| UI - Automatic adjustments to length and benefit level on economic conditions | ||
| Extensions to Expanded Tax Credits | 799 | |
| Make permanent ARP's expanded tax credits: ACA premium, child tax credit through 2025 only (and permanently refundable), child and dependent care tax credit, and EITC | ||
| Total ($ trillions) | 1.7 | |
There is always a risk that some money spent on infrastructure would ultimately be wasteful, and potentially prone to political interference. However, there is broad agreement that the U.S. has underinvested in infrastructure for years. The American Society for Civil Engineers estimates there is a $5.6 trillion gap in infrastructure investment through 2039.1 Indeed, President Trump was also keen on spending on infrastructure. However, nothing was passed.
Estimates vary on the economic impact of the AJP, with different assumptions on timing and multipliers assumed. The lift to GDP growth ranges from 0.5 to 1.0 percentage points on annual growth on average over the first three years of impact, with some drag on growth as the spending increases are not repeated in the out years.
Shifting to the AFP, its focus is on human capital investments and enabling more human potential to be unlocked could improve productivity and the labor supply over the longer term. Spending on education should help increase educational attainment and skills, although these benefits will take much longer to show up in the data and in tangible economic outcomes and difficult to estimate. In the shorter-term, the extended tax credits from the ARP would support consumer spending in 2022 and contribute to the increase in growth in Moody’s estimates in that year despite the tax increases (Chart 1).
Table 3: CBO Estimates of Fiscal Multipliers
| CBO Estimate Papers | Multiplier |
| COVID Relief (2020) | |
| Relief for States | 0.88 |
| Enhanced Unemployment Insurance | 0.67 |
| Recovery Rebates for Individuals | 0.60 |
| PPP | 0.36 |
| ARRA (2015) | |
| Infrastructure Spending | 0.4-2.2 |
| Payments to State & Local Govt. | 0.4-1.8 |
| Individual Income Tax Cuts | 0.1-1.5 |
| Corporate Tax Cuts | 0-0.4 |
The measures supporting childcare in the AFP including universal pre-K and expanded child and dependent care tax credits, would help make childcare more affordable and lower the barriers to more women participating in the labor force. From 2000 to 2015, the labor force participation of core-aged women (25-54 years) was in steady decline despite an improving unemployment rate. The U.S. trend has also notably lagged its G7 peers. Although this participation rate made great improvements just prior to the pandemic, nearly returning to the 2000 peak pre-pandemic (see report), the pandemic has resulted in a notable setback. Lowering the barriers to mother’s participation in paid employment would help re-gain the lost progress and help the U.S. start to catch up with many of its advanced economy peers on this measure.

Take Canada, for example. It has exceeded the U.S. on women’s participation rates for the past 20 years, with many researchers pointing to Canada’s shift to more supportive parental leave policies as the cause (Chart 3). We estimate that if the U.S. had Canada’s maternal participation rate, that there would be 4.7 million more mothers in the labor force. Moody’s estimates the measures in the AFP could boost overall labor force participation by 0.3% percentage points by the end of the decade.
While the AFP could move the needle on mother’s engagement in the labor force, it is unlikely to close the gap with Canada and peer countries on its own. Maternity/parental leave in the U.S. would remain at only 12 weeks – where it has sat since 1993’s Family and Medical Leave Act, trailing its G7 peers by a wide margin. Improvement in the labor force participation rate would still improve the labor supply on the margin, and hence GDP. It would also improve the lifetime earnings path of mothers who are held back by extended periods out of the workforce. Overall, the AFP has a smaller impact on growth in the medium-term relative to the AJP and could have positive social impacts that are difficult to quantify, but the lift to labor force participation is a positive impact on potential growth over the longer-term.
The plans are lacking in year-by-year spending detail, so the estimates of growth impacts that exist vary, and are highly uncertain, but the peak impact on growth seems more likely to occur in 2023-24 (Chart 1). Thereafter, there would be some fiscal drag as the peak spending years of infrastructure spending wind down. Moody’s estimates the two plans in concert could boost potential growth by 0.1-0.15 percentage points over the next decade.
Wait… what about the tax hikes?
All else equal, tax increases do weigh on economic growth, but all is not equal in the scope of the plan. The tax hikes do weigh on the economic lift from spending in the early years of the plan, particularly the corporate tax hike. However, because they are financing policies that are forecast to raise economic growth to a greater extent, the plans are growth positive on net. Moody’s points out that this plan would mark the first major tax increase since 1993, but that it is not actually that large relative to other tax hikes in history.2
The corporate tax increase is the biggest single revenue raiser, and textbook economic tells you that it reduces investment (Table 4). And the increase in corporate taxes assumed to take effect in 2022 is part of the reason Moody’s estimated growth impact is relatively small in that year. The administration has also argued that investments in infrastructure will enable companies to be more productive. The argument that higher taxes will reduce private sector investment was also dented by the experience of the Tax Cuts and Jobs Act. It dramatically reduced the corporate tax rate, and there was no discernible acceleration in investment, although equity markets have done very well. Higher corporate taxes should hit earnings per share, but forward-looking equity markets continue to do well, perhaps revealing that the overall impact on corporations of these plans could be less than feared.
Table 4: Tax Increases in Biden's Build Back Better Plans ($ billions, 2022-2031)
| American Families Plan | Made in America Tax Plan | ||
| Improve tax compliance & administration | 718 | Raise corporate income tax rate from 21% to 28% | 858 |
| Tax capital gains & dividends as income for >$1m, close carried interest loophole & various other measures | 580 | Revise the Global Minimum Tax regime | 534 |
| Prevent corporate inversions | 390 | ||
| Raise top personal tax rate from 37% to 39.6% | 132 | 15% minimum tax on book earnings of large corps. | 148 |
| Make permanent excess business loss limitation of noncorporate taxpayers | 43 | Eliminate tax preferences for fossil fuels | 86 |
| Total ($ trillions) | 1.5 | Total ($ trillions) | 2.0 |
There is the concern about global competitiveness of U.S. companies with a higher statutory tax rate. Therefore, Secretary Yellen has championed a global minimum corporate tax to “stop the race to the bottom” where countries compete for investment by offering lower tax rates. See text box for more on the international tax measures.
On the personal side, the measures are concentrated on the highest income taxpayers. The White House points out that taxes will only be raised for individuals with incomes over $400k. From a growth perspective, the hit to consumption is relatively less than a broad tax hike, as the marginal propensity to spend at higher incomes is much lower. Combined with the credits for modest income Americans, the tax hikes would improve income inequality, which has been an increasing issue that research has shown crimps growth.3
Perhaps the most concerning “pay for” in the tax plans is the assumed $700 bn earmarked to come from increased tax enforcement. This would be enabled by an $80 billion increase in spending on the IRS. The CRFB has pointed out, this is an administration estimate and has not been independently scored by the CBO or JCT.4 Canada recently undertook a similar effort and found that for every additional dollar of funding to the revenue agency about $6.84 in revenue was raised. Work by the CBO suggested a lower multiple of around 2.5-3.5 The Biden Administration is assuming it will get $8.75, so the revenue estimate is perhaps a bit ambitious, but not implausible.
That also means that the plan may not fully be “paid for” in 15 years as the administration suggests. Because much of the infrastructure spending is one time and the tax increases are permanent, the higher tax revenues in the outer years pay for the higher deficits in the shorter term.
Textbox: International Tax Reform
The OECD and G20 have been working on an agreement on international tax issues for several years, and the Biden administration has an added incentive to push for a deal. Its proposed corporate tax increase would increase the incentive for U.S. first to shift profits to lower tax jurisdictions. In the initial “Made in America Tax Plan” the administration proposed a global minimum tax on profits from foreign subsidiaries of 21%. At the time, Treasury Secretary Yellen stated that the U.S. wants to work with G20 nations to end a “30-year race to the bottom on corporate tax rates”.
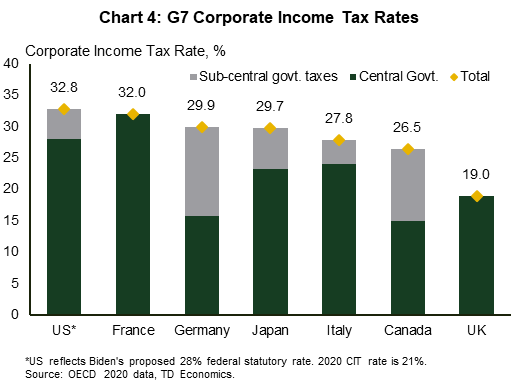
Negotiations have been taking place with a goal of reaching a political agreement at a July meeting of G20 Finance ministers. More recently, the U.S. administration has offered to accept a global minimum corporate tax of “at least” 15%, which has appeared to reach a greater consensus among G7 countries ahead of its upcoming meetings. While the G7 does not have a formal role in the process occurring at the G20, it is an influential group. In many ways, this is the low-hanging fruit, as most G7 countries are relatively higher tax jurisdictions (while the UK’s corporate tax rate is the lowest at 19%, when national and sub-national government rates are combined (Chart 4), it is set to rise to 25% over the next two years). But, if an agreement is reached, this will help make Biden’s corporate tax hike more palatable from an international competitiveness perspective.
Achieving agreement among the larger G20 group is likely to be more difficult given the inclusion of countries like Ireland and the Netherlands that are considered corporate tax havens. Still, an agreement from the G7 is likely to provide a good starting point for discussions.
A level playing field internationally is a laudable goal, but corporate taxes are far more complicated than the statutory rate. Many countries provide tax breaks for things like R&D or renewable energy, lowering companies’ effective tax rates. This is a good first step, but more cooperation is likely to be necessary to truly level the international playing field.
But will it Pass Congress?
With a narrow Democratic majority in the Senate, it is unlikely the full scope of the plans as outlined here, will be implemented. The administration is currently pursuing bipartisan talks on infrastructure, and those may yet yield a separate bipartisan infrastructure-only spending bill. However, Republican support for rolling back the tax cuts from their 2017 Tax Cuts and Jobs Act seems unlikely, and we expect the Democrats may ultimately need to use reconciliation to pass most elements of their plans, as they did with the ARP.
Even so, the administration will likely need to pare back some elements of the plan to retain support of moderate Democrats, particularly in the Senate. For example, the corporate tax rate may only be raised to 25%, rather than 28%, which would require mirrored reductions to the spending plans, since President Biden has made clear that he wants the spending measures to be paid for. It is also unclear whether these plans would be passed individually, or potentially bundled together and passed at the same time, particularly since the administration characterized the AFP as “paid for” with the measures included in the AJP, so the two plans may need to be combined to be passed using reconciliation.
The Bottom Line
The proposals making up the administration’s “Build Back Better” plan encompass a wide range of spending aimed at enhancing both physical and human capital. The headline dollar figures are large, but with investments spread over multiple years, the lift to growth in any individual year is more modest than the recent ARP. They are paid for by tax increases, which on the personal side are progressive – they transfer more income to modest income Americans through tax credits and raise taxes on the top 0.3% of taxpayers. A higher corporate income tax rate would typically restrain investment in most economic models, but in recent history the statutory rate has had less impact on real investment in the economy. Overall, the measures are likely to stimulate growth over the medium and the longer-term. Investments in infrastructure would be expected to improve productivity, while childcare supports could increase the labor supply.
End Notes
- https://www.crfb.org/blogs/bipartisan-budget-act-means-return-trillion-dollar-deficits
- Moody’s Analytics (May 2021). “The Macroeconomic Consequences of the American Families Plan and the Build Back Better Agenda”.
- https://www.oecd.org/newsroom/inequality-hurts-economic-growth.htm
- https://www.crfb.org/blogs/whats-president-bidens-american-families-plan
- https://www.cbo.gov/publication/56467#_idTextAnchor090
Disclaimer
This report is provided by TD Economics. It is for informational and educational purposes only as of the date of writing, and may not be appropriate for other purposes. The views and opinions expressed may change at any time based on market or other conditions and may not come to pass. This material is not intended to be relied upon as investment advice or recommendations, does not constitute a solicitation to buy or sell securities and should not be considered specific legal, investment or tax advice. The report does not provide material information about the business and affairs of TD Bank Group and the members of TD Economics are not spokespersons for TD Bank Group with respect to its business and affairs. The information contained in this report has been drawn from sources believed to be reliable, but is not guaranteed to be accurate or complete. This report contains economic analysis and views, including about future economic and financial markets performance. These are based on certain assumptions and other factors, and are subject to inherent risks and uncertainties. The actual outcome may be materially different. The Toronto-Dominion Bank and its affiliates and related entities that comprise the TD Bank Group are not liable for any errors or omissions in the information, analysis or views contained in this report, or for any loss or damage suffered.
Download
Share this: