Pandemic Stalls Women's Progress in
Entrepreneurship
Leslie Preston, Managing Director & Senior Economist | 416-983-7053
Nikolina Zivkovic, Research Analyst
Date Published: November 1, 2022
- Category:
- Canada
- Labour
- Commodities & Industry
Highlights
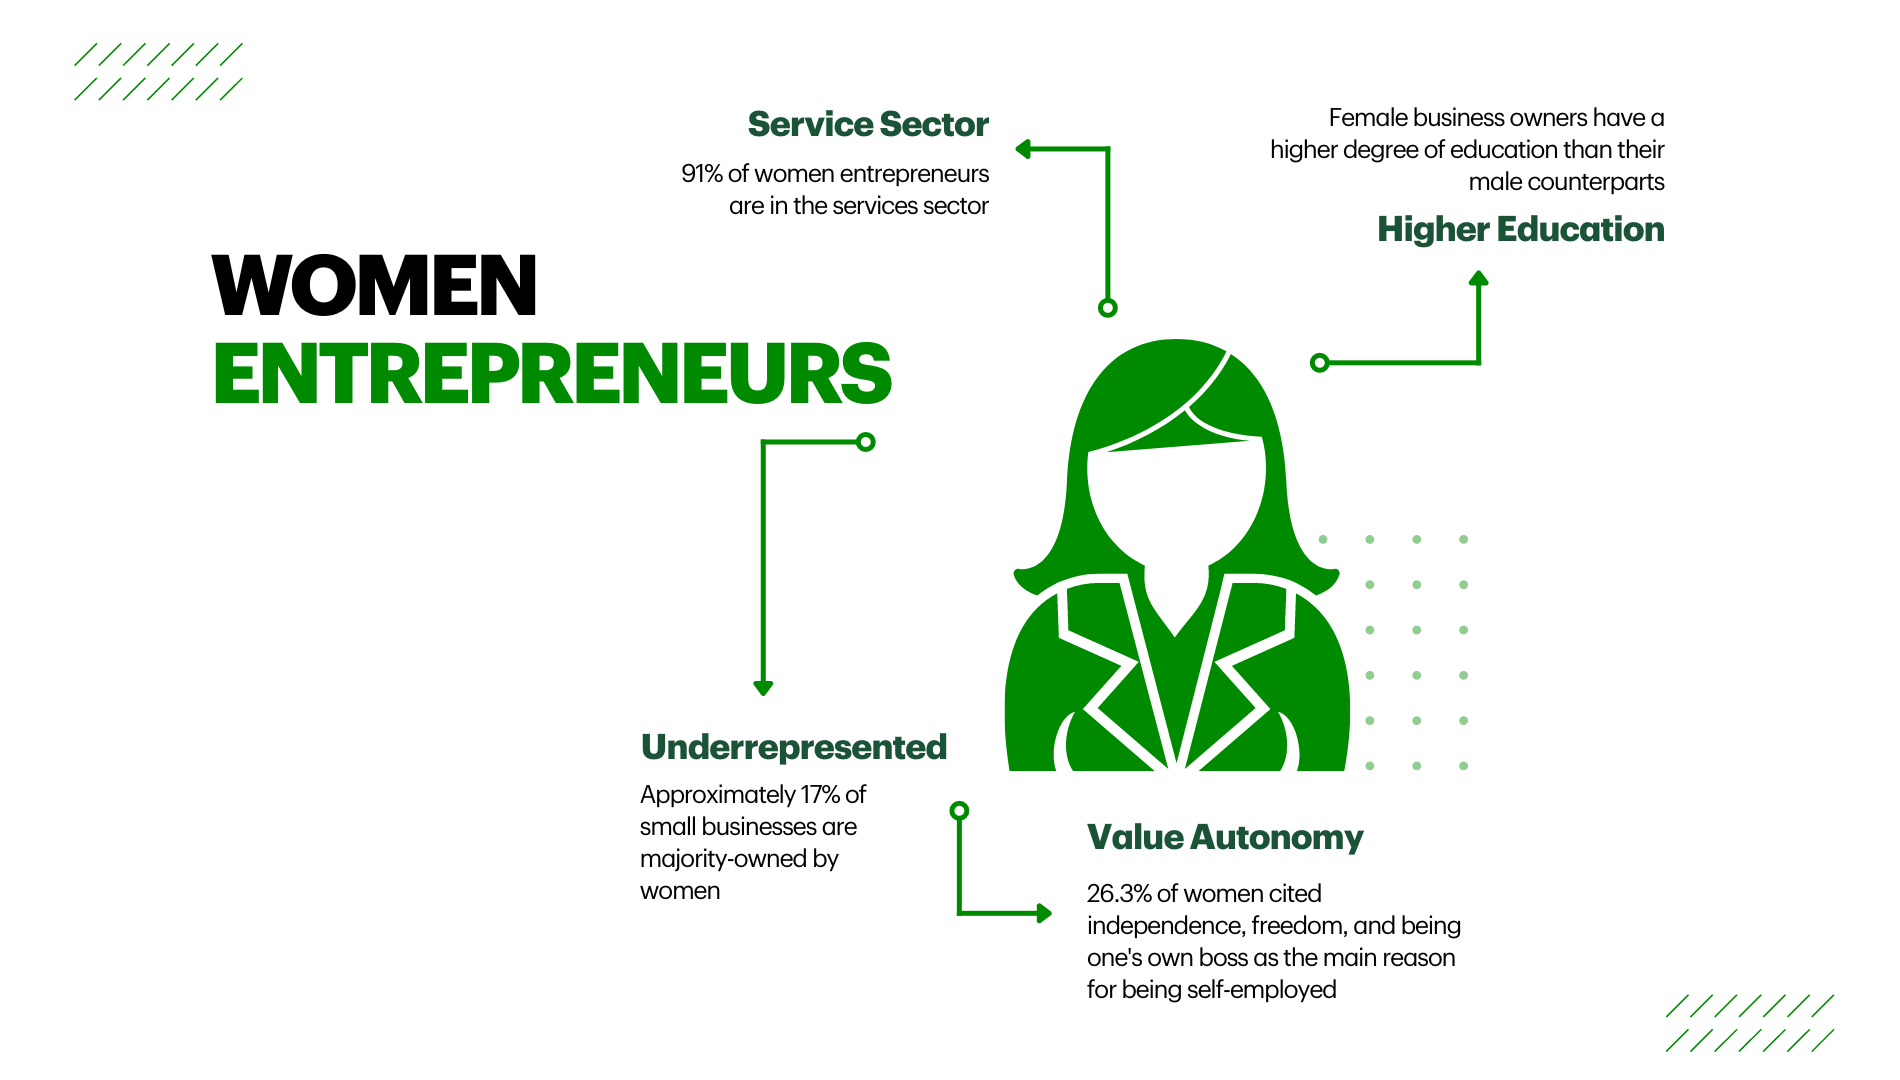
- Despite making up nearly half the workforce, women continue to be underrepresented in entrepreneurship. Both among those identifying as self employed, and as owners of small and medium sized enterprises.
- The broad characteristics of women-owned SMEs have changed little in recent years. However, the Covid-19 pandemic took a heavier toll on women entrepreneurs, stalling their progress.
- Various programs to give women entrepreneurs a leg up are helpful, but the lack of progress on the representation of women owned SMEs suggests more needs to be done to widen the pipeline of women who even consider entrepreneurship in the first place.
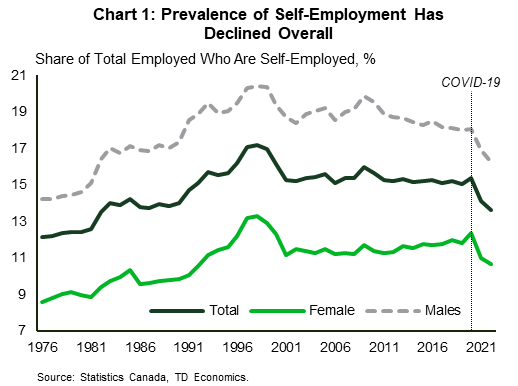
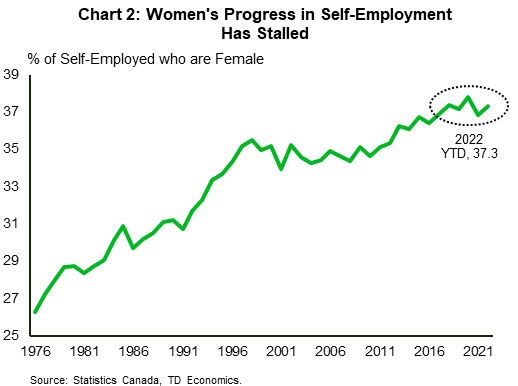
Despite making up nearly half of the workforce in Canada, women are underrepresented among small and medium sized business owners and the self-employed. Unfortunately, the situation worsened through the Covid-19 pandemic. Entrepreneurship overall has taken a hit through the pandemic, as measured by self-employment data from the Labour Force Survey (LFS) (Chart 1). But the impact on female self-employment has been larger. Women had been making steady gains prior to the pandemic, but progress has since stalled (Chart 2).
However, the characteristics of women who are either self-employed and or are a majority owner of a small or medium sized enterprise (SME), have not shifted much since TD Economics' last report in 2015. The differing motivations of male versus female entrepreneurs are also similar. And, the share of SMEs majority-owned by women has been stubbornly stagnant since 2007. Many programs and initiatives have been launched to give women entrepreneurs a leg up. However, the lack of progress on the representation of women among SME owners suggests there is more to be done to address the root causes that keep women from considering entrepreneurship in the first place.
Few Changes in the Makeup of Women-Owned SMEs
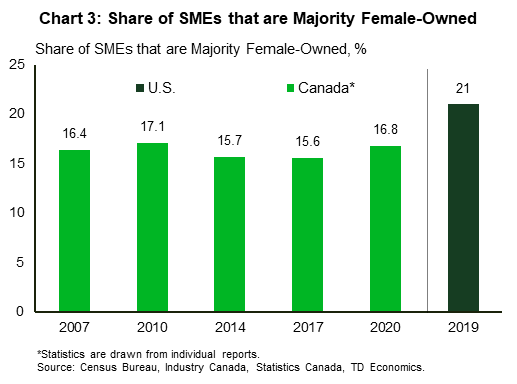
In addition to the Labour Force Survey (LFS), the Survey of Small and Medium Sized enterprises (SMEs) is another source of data on entrepreneurship in Canada. The survey is conducted every three years and includes operations with fewer than 500 staff, although more than half of these enterprises employ fewer than five people, and 98% are less than 100. The latest survey was conducted in the early months of the pandemic, so the trend may yet improve, but majority women-owned businesses continue to make up less than one fifth of establishments, and this share has been stagnant over the past several surveys, although there was an uptick between 2017 and 2020 (Chart 3). It also appears to be slightly lower in Canada than the U.S., although we can't say for sure why due to limitations on comparability of the data.
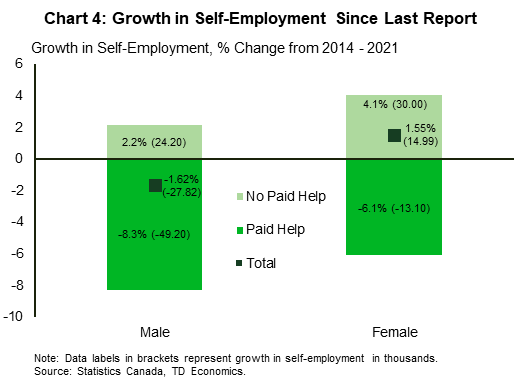
Relative to the self-employment data from the LFS, women-owned SMEs make up a smaller share of the sample. Self-employment contains a lot of diversity and is a broader definition. Many people who are self-employed are solo operations and may not be formally registered as a business or incorporated i.e. people such as freelancers. Since TDE's last report on women entrepreneurs, the growth in self employment has been primarily among people with no employees, and the growth has been faster for women (Chart 4).
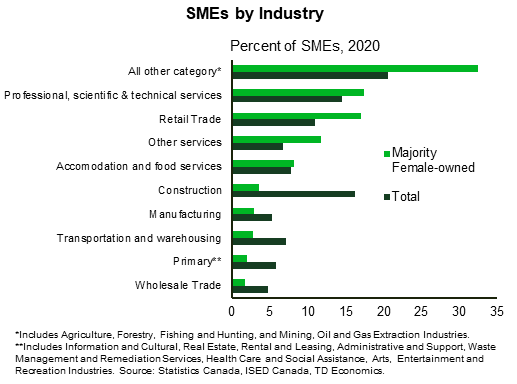
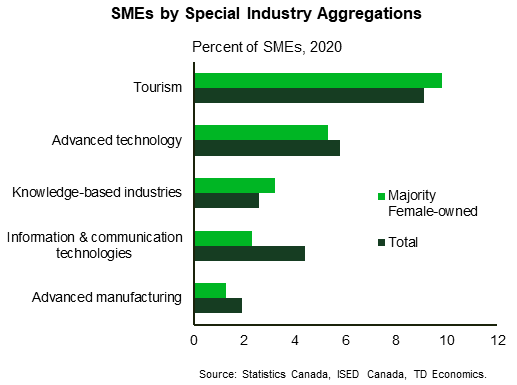
The general characteristics of women-owned SMEs have changed very little since our last report. Graphs summarizing the key characteristics can be found at the end of the report. They tend to be smaller and concentrated in the services sector. Interestingly, female owners have a higher degree of education than their male counterparts. This is likely related to the higher share of women-owned SMEs in the professional, scientific, and technical services industry. Interestingly, a higher share of women-owned businesses are knowledge based, but lag men in the more STEM-related fields of information, communication and technology, and advanced manufacturing and technology sectors. Women also have fewer years of experience than their male counterparts.
Women-owned SMEs also appear to be a bit more tech savvy. They are more likely than men to hold intellectual property (19.4% versus 14.7%), to have an online presence (68.7% versus 55.2%) and use an e-commerce platform or payment system (15% versus 9.3%). This may be due to a relatively younger age, educational background of women-owned businesses or the industry make up. In fact, a recent report on women's entrepreneurship cited that the number of women founded "unicorn" start-ups – fast-growing privately-owned start-ups with a valuation of more than $1 billion – have been making steady gains. 2021 saw a large gain to 39, from a previous high of 21 in 2019, but women are still far outnumbered by men, given there were 327 new start-ups that attained unicorn status in 20211 .
Mars vs. Venus Approach to Entrepreneurship Continues
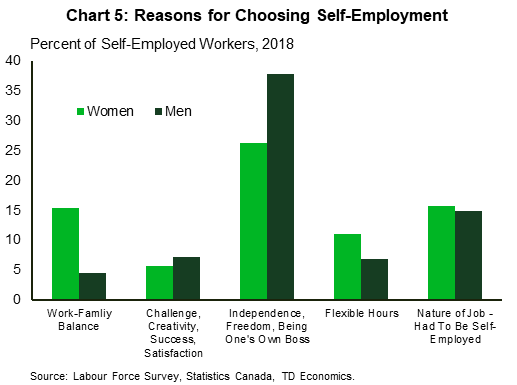
In our earlier reports on women entrepreneurs, TD Economics highlighted the different motivations of self-employed women versus men. According to updated data from the 2018 Labour Force Survey about one third (33.5%) of self-employed workers reported having this type of work arrangement for the independence and freedom it affords2 (Chart 5). The second most common reason was the nature of the job, that is, ‘had to be self-employed’ because of the type of employment, at 15%. Fewer than 1 in 10 people reported work-family balance as a reason for their choice of self-employment. While independence, freedom or being one's own boss were the top reason for both men and women in self-employment, differing motivations continue to be evident. Flexible hours and work-family balance were more than twice as likely to be cited by women than men. This likely reflects women's disproportionate role as caregivers, and that many entered self employment to find a better balance between personal and professional commitments.
The tendency to be in self-employment for flexibility or balancing family responsibilities also shows up in hours worked. Self-employed men are more likely to work more than 40 hours per week than self-employed women, and half as likely as self-employed women to work fewer than 30 hours per week. These differences in hours worked is less notable for men and women employees.
Pandemic Tougher on Women Entrepreneurs
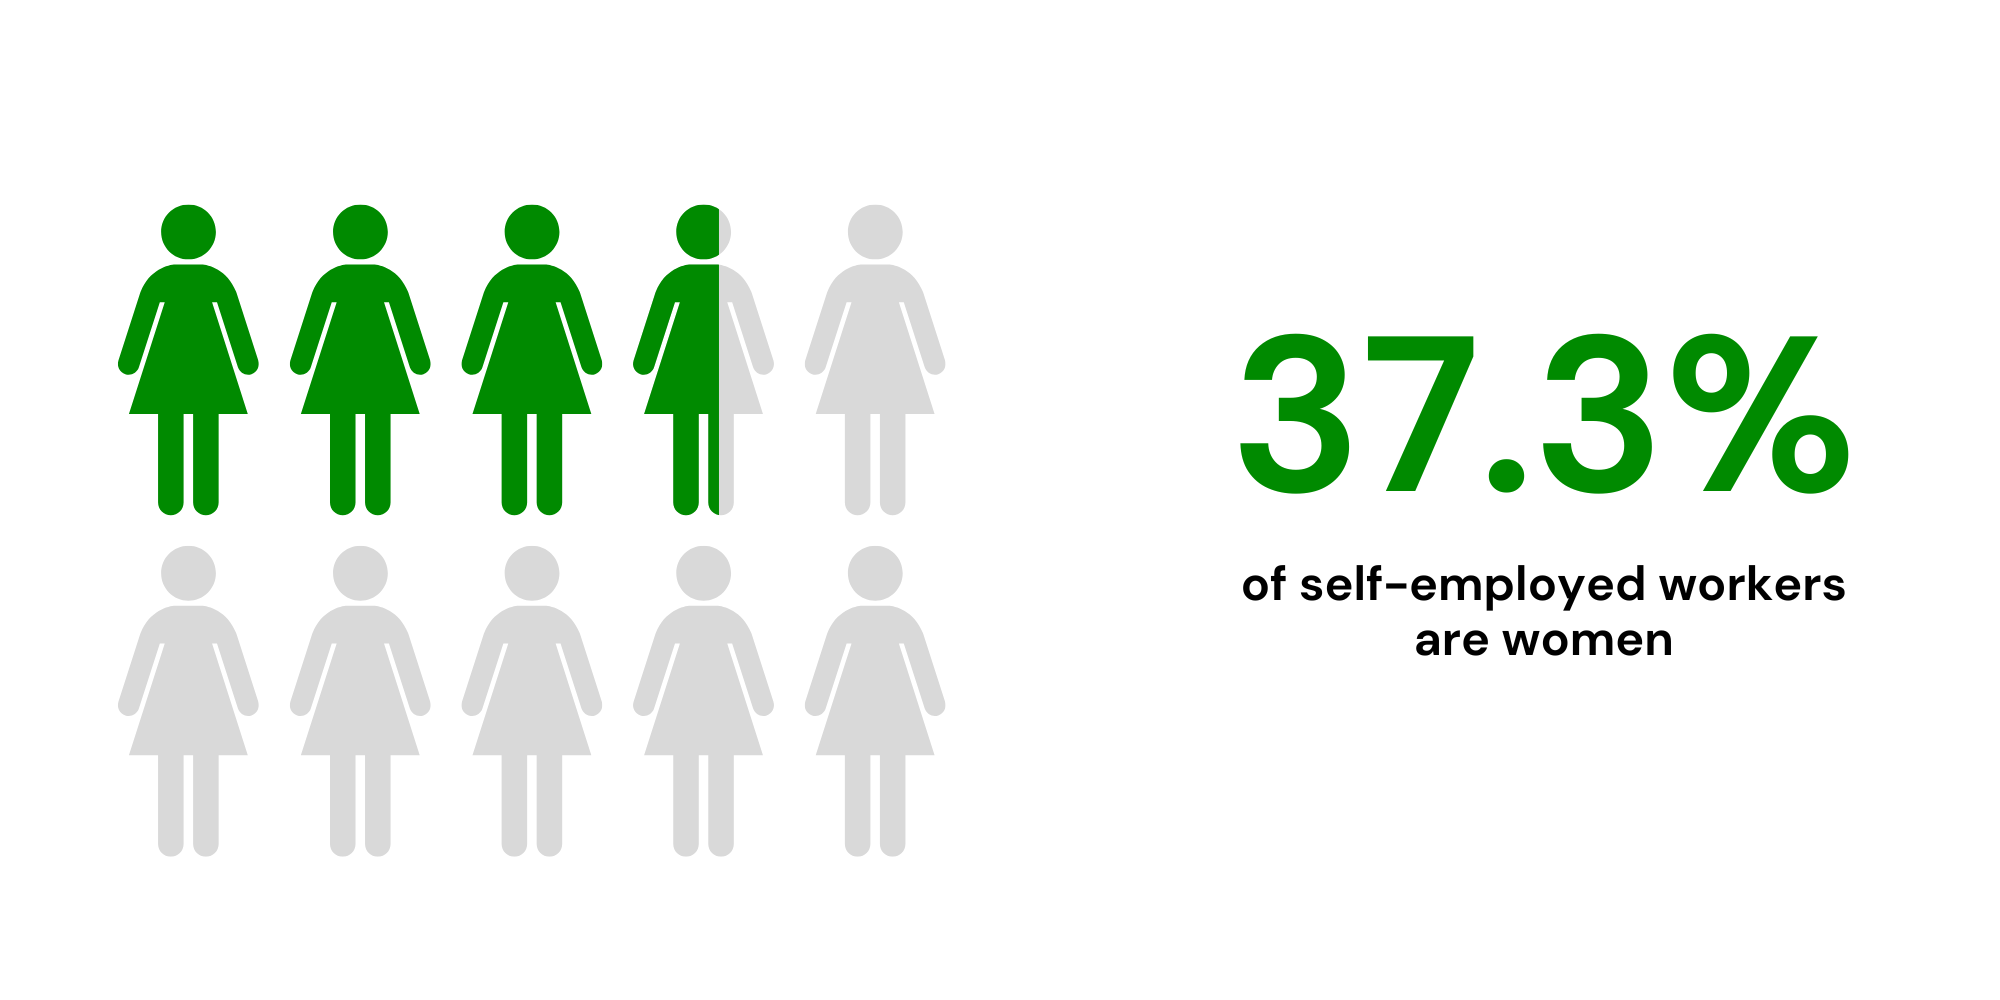
Since TD Economics' last report on women's entrepreneurship in 2015, self-employment had continued to rise among women, although declined among men. The pandemic brought this trend to a halt. Self-employment among men recovered quickly since the onset of the pandemic, but less so for women, thus far. This has resulted in the gains women had made in self-employment flatlining in recent years (Chart 2).
There are likely a variety of reasons overall self-employment declined through the pandemic. It could be that public policy favoured large or medium enterprises during the pandemic3, or larger businesses had more resources to cope with the prolonged disruptions and extra costs. At the same time, the conditions for eligibility for emergency loan programs raised an additional barrier for small businesses that could have proven difficult to overcome. Pandemic-related shifts in standard paid-employment towards greater flexibility, given hybrid and online work environments, may have also made working as a traditional employee more attractive for self-employed Canadians and they opted to switch.
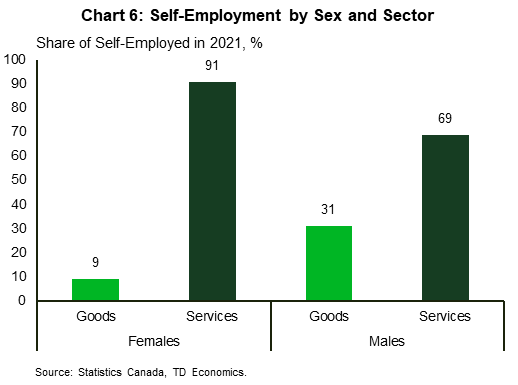
Why self employment fell more for women is likely due to a combination of factors. Women entrepreneurs disproportionately work in the hard-hit services sector (Chart 6). Women owned SMEs tend to be smaller than their male counterparts and may not have had the resources to weather the relentless open-shut nature of the pandemic and re-opening. With women still shouldering the bulk of childcare duties, the pandemic closures of schools and daycares likely proved an insurmountable challenge for many self-employed women with younger children. Many of whom likely had to stop their work to manage full-time childcare or virtual schooling.
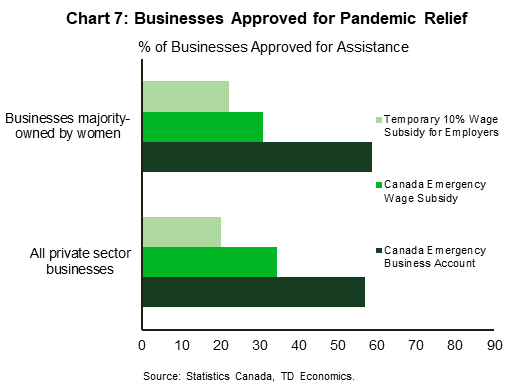
However, it does not seem to be due to a lack of access to government assistance programs. Women-owned business appear to have been approved for various assistance programs at similar rates to their male counterparts (Chart 7). We also know that women-owned businesses took a larger hit from the pandemic. The 2020 Survey of Small and Medium Sized Enterprises4 reported that nearly half (46.5%) of women-owned SMEs had temporary closures due to the Covid-19 pandemic, compared to a third of all SMEs. Canadian women entrepreneurs laid off a disproportionately larger number of employees during the pandemic5 : 62% of female-owned business laid off 80% or more of their employees, compared to 45% of SMEs overall.
Widening the Entrepreneurial Pipeline a Key Challenge
The current federal government has made gender a key lens for policy evaluation, and gender equity a key goal. It launched a Women Entrepreneurship Strategy in 2018 with various programs such as loans or funding for entrepreneurs or would-be entrepreneurs, and a knowledge hub to foster information sharing. Many other such initiatives exist at other levels of government, and in the private sector in supplier diversity programs which aim to support businesses owned by women or other minority groups. These programs are likely impactful at the level of individual entrepreneurs. However, they don’t directly address increasing the likelihood that women choose to become entrepreneurs.
There is evidence that shows the lower tendency for women to consider entrepreneurship emerges quite young. Teenage girls are less likely than teen boys to aspire to entrepreneurial careers, and are also less likely to participate in voluntary entrepreneurship programming opportunities such as Junior Achievement6. Much research has shown women have lower levels of entrepreneurial self-efficacy than men, due to socialization and an absence of role models. Women also have typically scored lower in entrepreneurial intention and knowledge. People with these characteristics hold a positive view of entrepreneurship and believe that they have the skills and abilities to start a new business. The fact that these biases emerge quite young shows that any efforts to widen the future pipeline of women entrepreneurs needs to start early.
Efforts to change these biases through education or exposure to role models clearly needs to start relatively early to increase the likelihood women pursue entrepreneurship. To the extent that programs like the Women Entrepreneur Strategy increases the profile of role models such that they can influence women at younger ages, they could help increase the likelihood women consider entrepreneurship.
The Bottom Line
The Covid-19 pandemic has proven to be a setback to women's increased representation among the self employed. But, there is reason for optimism. We are still in the early days of the recovery from the pandemic and it is likely that as the hardest hit sectors of the economy continue to rebuilt, the pre-pandemic trend of women gaining ground in self employment will reassert itself. The share of women owned SMEs seems to be a tougher nut to crack, although the fact that there was a slight increase even in the difficult pandemic year is perhaps cause for some cautious optimism. There is clearly room for improvement when it comes to changing perceptions of younger women towards entrepreneurship to increase that potential pipeline earlier on.
Characteristics of Majority Women-Owned SMEs


End Notes
- https://wekh.ca/wp-content/uploads/2022/03/WEKH_State_of_Womens_Entrepreneurship_in_Canada_2022-1.pdf
- https://www150.statcan.gc.ca/n1/pub/71-222-x/71-222-x2019002-eng.htm
- https://www.cbc.ca/news/business/self-employment-decrease-1.6279658
- https://www.ic.gc.ca/eic/site/061.nsf/vwapj/h_03166a_en.pdf/$FILE/h_03166a_en.pdf
- https://read.oecd-ilibrary.org/view/?ref=119_119680-di6h3qgi4x&title=Covid-19_SME_Policy_Responses
- https://ir.lib.uwo.ca/cgi/viewcontent.cgi?article=1004&context=brescialeadershipsocialchangepub
Disclaimer
This report is provided by TD Economics. It is for informational and educational purposes only as of the date of writing, and may not be appropriate for other purposes. The views and opinions expressed may change at any time based on market or other conditions and may not come to pass. This material is not intended to be relied upon as investment advice or recommendations, does not constitute a solicitation to buy or sell securities and should not be considered specific legal, investment or tax advice. The report does not provide material information about the business and affairs of TD Bank Group and the members of TD Economics are not spokespersons for TD Bank Group with respect to its business and affairs. The information contained in this report has been drawn from sources believed to be reliable, but is not guaranteed to be accurate or complete. This report contains economic analysis and views, including about future economic and financial markets performance. These are based on certain assumptions and other factors, and are subject to inherent risks and uncertainties. The actual outcome may be materially different. The Toronto-Dominion Bank and its affiliates and related entities that comprise the TD Bank Group are not liable for any errors or omissions in the information, analysis or views contained in this report, or for any loss or damage suffered.
Download
Share this: