Highlights
- Spending data continues to show a strong recovery from the Omicron lull through to May 31st, particularly on experiences, rather than stuff.
- Inflation is driving a wedge between nominal and real spending. But spending continues to make gains in real terms.
- After a pandemic pause, consumers have re-embraced credit cards, as the spending mix has shifted. Consumer spending patterns now look a lot more like they did pre-pandemic.
- Supported by the revival of spending on travel and entertainment, services outlays are likely to remain strong this summer as consumers make up for lost time, but are expected to slow in the fall as consumers tighten the purse strings.
- Anonymous, aggregated TD Spending data provide valuable and more timely insights on Canadian spending patterns across a wider range of categories than retail sales data released by Statistics Canada. Cards spending (which includes spending on debit and credit cards) grew by a healthy 2.2% month/month (m/m) in May, a moderation from recent months which saw a strong rebound in spending post-Omicron wave (Chart 1).
- Some of the strength in nominal card spending is due to high inflation, and the wedge between inflation-adjusted and nominal figures has grown (Chart 1). Even so, spending in volume terms was still up a solid 0.8% m/m in May. Relative to the year ago, real spending is up an impressive 15% y/y, with little evidence (as of yet) that consumers are paring back due to inflation.
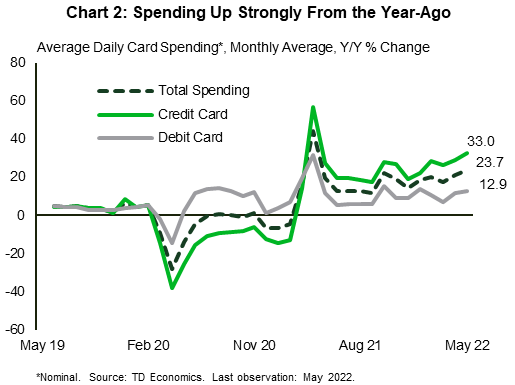
- Consumers are clearly keen to get out and have fun after two years of pandemic restrictions. Nominal spending on debit and credit cards was up 24% from its year-ago level – an acceleration relative to 21% pace in April (Chart 2).
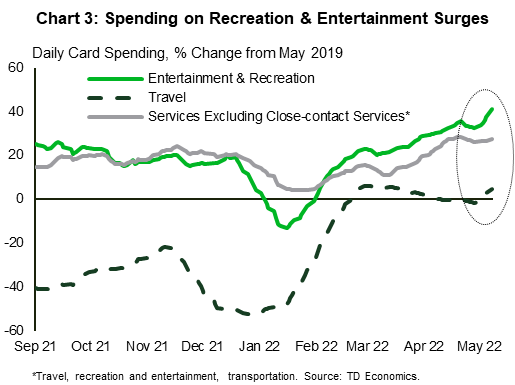
- With virus-related restrictions largely gone, many Canadians have been eager to resume their pre-pandemic lifestyles, spending more on services, such as dining out and travelling. Spending data clearly snow the shift in spending patterns away from goods and toward services in recent months. Higher spending in May has been increasingly supported by a strong rebound in outlays on high-touch services most impacted by the restrictions. Whereas spending on other service-related categories appears to have levelled off (Chart 3).
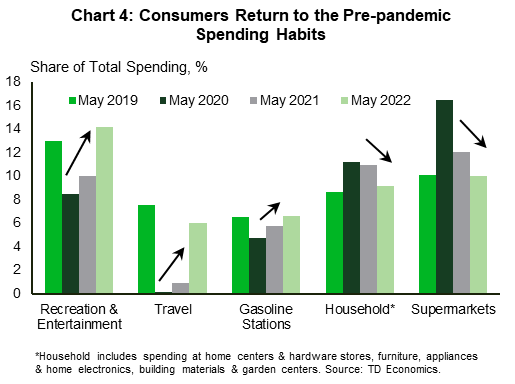
- Within the high-touch spending category, the recreation & entertainment category has been especially strong as of late and continued to lead the way in May. Spending on recreation & entertainment is currently 40% higher in nominal terms relative to its pre-pandemic level (Chart 3). As a share of total spending, it has not only recovered but surpassed its pre-pandemic share, suggesting consumers are eager to have fun after two years of restrictions (Chart 4). This bodes well for restaurant, theaters, amusement parks and other entertainment venues if they can keep up with this demand tsunami amid tight labour market conditions and rising costs.
- With consumers eager to enjoy experiences, they have been spending less of their budgets on groceries, with supermarkets accounting for a lower share of total spending than they did last year (Chart 4). This was echoed by the latest retail sales data, with sales at food and beverage stores down 8% in volume terms relative to the year-ago.
- While spending on entrainment has been strong, the rebound in travelling (includes items such as airline tickets, car rental services and hotels) has fizzled out. It could be that staffing shortages, delays and long lines at the airports, combined with high prices are keeping the lid on the recovery in this sector (Charts 3 and 4). Households are also allocating less of their budget to spending on household items, like furniture, electronics, and building materials than they did last year. There is likely more room to cool alongside the expected correction in the housing market (Chart 4).
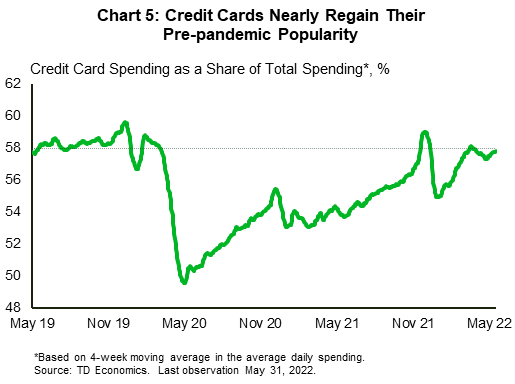
- After paying back credit card debt and leaning more on debit cards during the pandemic, consumers are once again embracing credit cards. Spending via credit cards was up 33% in May relative to the year-ago period, and has continued to outpace debit card spending growth (Chart 2). After dipping below 50% at the start of the pandemic, credit card’s share of total spending reached 58% in May – nearly on par with where it was prior to the pandemic (see Chart 5).
- A brisk increase in spending in categories which are typically more credit card-oriented, is contributing to the revival in credit cards’ popularity. The biggest uptick in credit card usage this year is in categories where spending was very depressed during the pandemic and is now rebounding, such as travel and recreation. These two categories account for just under a quarter of total volume of spending on credit cards. Travel has one of the highest prevalence of credit card usage with around 90% of all transactions being done via credit cards.
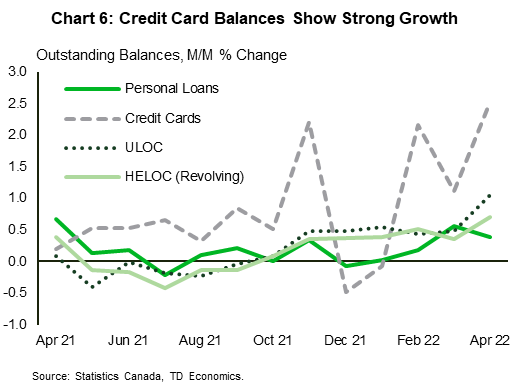
- Strong in spending at the start of the year, including on the big-ticket items, such as travelling (up more than 700% from the year-ago), means that consumers are also less likely to paydown balances in full at the end of the month. This is evident in the build-up of credit card balances, which have increased more than other forms of consumer credit (Chart 6).
- Consumer spending patterns now increasingly resemble their pre-pandemic trends. With inflation and higher rates now in the picture (forecast), there is little evidence in May’s spending data to suggest that higher prices are weighing on consumer behaviour yet. The shift to pre-pandemic spending patterns has been accompanied by gains in both nominal and real spending. This notion is further supported by the brisk increase in spending on dining out and entertainment, suggesting consumers are not yet turning frugal.
- With elevated household savings rates relative to the pre-pandemic period, alongside the build-up of wealth, the summer months are likely to see consumers splash out on experiences after two years of uncertainty and restrictions. However, we expect the early fall months will usher in more conservative behaviors as the reality of high prices and interest rates, rising debt servicing costs, and reduced savings and wealth cushions comes to bear (forecast).

Disclaimer
This report is provided by TD Economics. It is for informational and educational purposes only as of the date of writing, and may not be appropriate for other purposes. The views and opinions expressed may change at any time based on market or other conditions and may not come to pass. This material is not intended to be relied upon as investment advice or recommendations, does not constitute a solicitation to buy or sell securities and should not be considered specific legal, investment or tax advice. The report does not provide material information about the business and affairs of TD Bank Group and the members of TD Economics are not spokespersons for TD Bank Group with respect to its business and affairs. The information contained in this report has been drawn from sources believed to be reliable, but is not guaranteed to be accurate or complete. This report contains economic analysis and views, including about future economic and financial markets performance. These are based on certain assumptions and other factors, and are subject to inherent risks and uncertainties. The actual outcome may be materially different. The Toronto-Dominion Bank and its affiliates and related entities that comprise the TD Bank Group are not liable for any errors or omissions in the information, analysis or views contained in this report, or for any loss or damage suffered.
Download
Download
Share this: