2026 Quebec Budget
Fiscal Restraint Anchors Path Back to Balance
Date Published: March 18, 2026
- Category:
- Canada
- Government Finance & Policy
Highlights
- The Quebec government’s pre election budget avoids major new initiatives, prioritizing core services, targeted social supports, and infrastructure investment while reaffirming its commitment to balance by FY 2029/30.
- Deficits are projected to steadily narrow beginning in the upcoming fiscal year, largely on plans to significantly rein in spending growth. At 0.9% of GDP in FY 2026/27, Quebec’s forecasted deficit is one of the lowest of the six provinces that have released their 2026 budgets so far this spring.
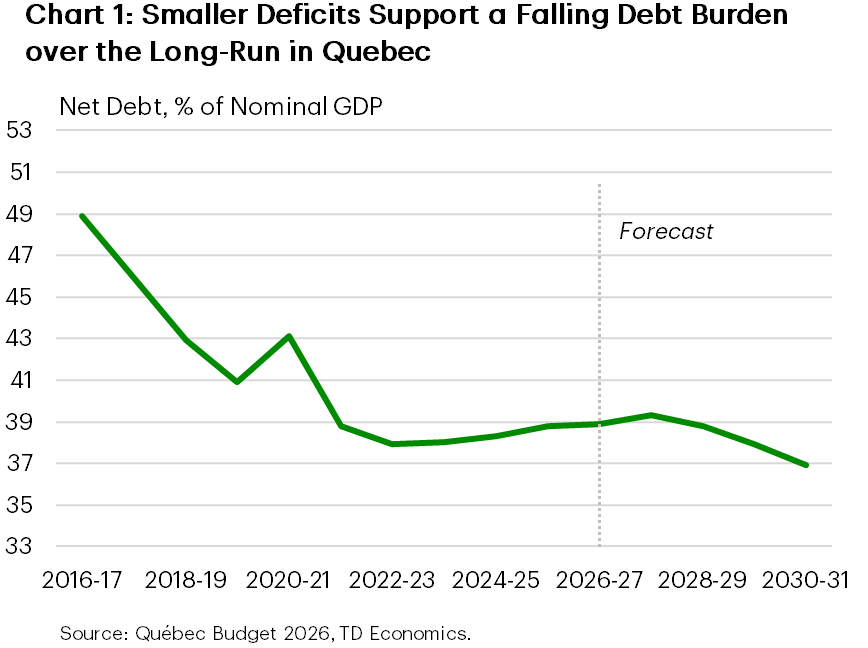
- Slow spending and moderate revenue gains help support a relatively flat debt burden as a per cent of GDP over the next few years. This disciplined outlook is in stark contrast to the provincial trend of sharply rising debt ratios.
In their last budget before an election this year, the Quebec government has refrained from rolling out major new initiatives and will instead focus on the delivery of core services like education, healthcare and targeted social supports (such as the creation of 5k new daycare spaces) while topping up infrastructure investment and capping school tax growth at 3%. The government remains committed to balancing the budget by FY 2029/30 while its debt burden is projected to remain relatively stable over much of the planning horizon. Of note, program spending is expected to be soft over the next several years.
The FY 2025/26 deficit is estimated at $7.7 billion (before deposits into the Generations Fund), representing 1.2% of GDP. This marks an improvement from the $9.9 billion shortfall pegged in the November fiscal update, driven by lower expenses. Quebec’s shortfall is expected to narrow to $6.3 billion in the upcoming fiscal year. At 0.9% of GDP, Quebec’s anticipated FY 2026/27 deficit would be among the lowest of any province so far this budget season (although Alberta’s deficit situation will be greatly improved by the recent flare up in oil prices).
Net debt to GDP, meanwhile, is projected to hang around 39 % (elevated compared to most other large provinces) before sliding lower in the outer years of the projection.
Sub-trend Growth in Revenues Anticipated This Year
Total revenues are projected to rise 3.7% in FY 2026/27. Growth is also expected to remain in the 3%–4% range over the remainder of the forecast.
Own-source revenues in FY 2026/27 are expected to be supported by gains in personal income and consumption taxes, the latter reflecting some resilience in household spending. Gains in corporate taxes are a touch more subdued, weighed down by slower profit increases. Federal transfers are forecast to jump 5.1% in the upcoming fiscal year, with growth moderating thereafter.
Quebec’s FY 2026/27 revenue assumptions are underpinned by nominal GDP growth of 3.5% this year. In 2027, growth is seen as slightly softer. Real GDP growth is projected to average 1.25% over 2026 and 2027. Compared to our own forecasts, we’re slightly weaker over both years, on average, in real and nominal GDP growth, suggesting some modest downside risk to revenues if we’re more on the mark. The government’s baseline economic growth and inflation assumptions incorporate the current Middle East conflict. Similar to our view/consensus, the government assumes a relatively short lived war, with the WTI oil price averaging around $60 per barrel for 2026 overall. In comparison, our forecast assumes WTI will average $76 per barrel.
The budget acknowledges economic risks through alternative economic scenarios, illustrating how, for example, a sharper trade shock, complications with the CUSMA review, or worsening geopolitical tensions could materially worsen the fiscal balance and raise debt ratios over time. In their recession scenario (where real GDP shrinks in 2026 and 2027), the budget would remain in deficit through the forecast horizon, hitting as high as $11 billion (after Generations Fund contributions) in the upcoming fiscal year before narrowing thereafter. In their stronger growth scenario (where GDP grows at a healthy 1.8% average rate in 2026 and 2027), balance would be achieved one year earlier than in the baseline.
Québec Economic Assumptions
[ % change unless otherwise noted ]
| 2026 Budget | |||
| Calendar Year | 2025 | 2026 | 2027 |
| Real GDP | 0.8 | 1.1 | 1.4 |
| Nominal GDP | 4.5 | 3.5 | 3.4 |
| Unemployment Rate (%) | 5.6 | 5.4 | 4.6 |
| Population (000s) | 9,058 | 9,045 | 9,025 |
| Housing Starts (000s) | 59.9 | 56.0 | 49.0 |
| 3-Month T-Bills (%) | 2.6 | 2.2 | 2.4 |
| 10-Year Bonds (%) | 3.2 | 3.3 | 3.3 |
Soft Spending Gains Expected This Year
On the spending side, total outlays are projected to grow 1.5% in FY 2026/27, a notably restrained pace by historical standards. Program (portfolio) expenditures rise slightly faster, but remain well below anticipated nominal GDP growth, helping to narrow the deficit.
The core services of health care (+4.1% growth in FY 2026/27) and education (+2.4%) remain the dominant drivers of departmental spending, reflecting rising costs. At the same time, transportation expenditures fall dramatically from their elevated 2025/26 levels that reflected advance payments for infrastructure expenditures. Program spending is also set to be scaled back in a few other portfolios, such as housing, in FY 2026/27.
After FY 2026/27, program spending growth is forecast to average about 2% over next four years, or roughly flat in real terms.
Quebec’s Debt Burden to Hold Relatively Steady
Quebec’s net debt ratio is forecast to be 38.8% of GDP in FY 2025/26, edging up slightly through FY 2027/28, partly boosted by the plan to top up infrastructure expenditures by $5 billion over 6 years. Note that in the recently released survey of capital intentions, public sector investment was forecast to climb 4% this year. By FY 2030/31, the ratio drops to 36.9%, moving closer to the government’s longer-term targets of 35.5% by 2032 – 2033 and 32.5% by FY 2037-2038.
Quebec’s FY 2026/27 total borrowing requirements are projected to be $26.2 billion. This is lower than in the prior year, thanks to pre-financing. Importantly, the interest bite remains manageable, with debt service absorbing roughly 6% of revenues, well below historical norms and providing some insulation against fiscal stress.
Bottom Line
Quebec presented a stay-the-course budget, with little in the way of new initiatives. It is the only jurisdiction projecting a path back to balance so far this budget season. Similarly, Quebec’s debt burden is still elevated, but its plan to hold the line in coming years could allow for some further narrowing in the gap with other large provinces. In a likely slow growth environment, Quebec’s return to balance will hinge on keeping expenses in check, which could be tough given the demands of an aging population.
What’s more, the economic backdrop is highly uncertain. A weaker-than-expected global environment, renewed tariff escalation, or softer domestic demand could quickly erode revenue momentum. Tensions in the Middle East add to challenges given Quebec’s status as an oil importer.
If slower program spending gains are indeed achieved, this could weigh on economic growth this year and over the next few, although a steady focus on infrastructure investment could supply an offset while potentially lifting longer-term productivity.
Québec Government Fiscal Position
[ Millions of C$ Unless Otherwise Noted ]
| Fiscal Year | 2025-26 | 2026-27 | 2027-28 | 2028-29 | 2029-30 | 2030-31 | |
| Revenues | 160,529 | 166,492 | 172,756 | 177,615 | 181,779 | 188,157 | |
| % Change | 2.8 | 3.7 | 3.8 | 2.8 | 2.3 | 3.5 | |
| Own-Source | 129,952 | 134,361 | 139,808 | 144,593 | 149,442 | 154,832 | |
| Federal Transfers | 30,577 | 32,131 | 32,948 | 33,022 | 32,337 | 33,325 | |
| Expenditures | 168,184 | 170,757 | 175,210 | 177,249 | 179,499 | 185,489 | |
| % Change | 4.3 | 1.5 | 2.6 | 1.2 | 1.3 | 3.3 | |
| Program Expenditures | 158,029 | 160,489 | 164,279 | 165,909 | 167,887 | 173,218 | |
| Debt Charges | 10,155 | 10,268 | 10,931 | 11,340 | 11,612 | 12,271 | |
| Total Consolidated Entities | -7,655.0 | -4,265.0 | -2,454.0 | 366.0 | 2,280.0 | 2,668.0 | |
| Contingeny Reserves | 0 | 2,000 | 1,500 | 1,500 | 1,500 | 1,500 | |
| Surplus (+) / Deficit (-) | -7,655 | -6,265 | -3,954 | -1,134 | 780 | 1,168 | |
| % of GDP | -1.2 | -0.9 | -0.6 | -0.2 | 0.1 | 0.2 | |
| Generations Funds Deposits | 2,289 | 2,347 | 2,491 | 2,616 | 2,780 | 2,918 | |
| Gap to be Bridged | 0 | 0 | 750 | 2,250 | 2,000 | 1,750 | |
| Budget Balance* | -9,944 | -8,612 | -5,695 | -1,500 | 0 | 0 | |
| % of GDP | -1.5 | -1.3 | -0.8 | -0.2 | 0.0 | 0.0 | |
| Net Debt | 250,289 | 259,509 | 271,141 | 276,806 | 279,304 | 281,342 | |
| % of GDP | 38.8% | 38.9% | 39.3% | 38.8% | 37.9% | 36.9% | |
| Gross Debt | 272,644 | 290,045 | 303,609 | 312,724 | 317,521 | 321,451 | |
| % of GDP | 42.3 | 43.5 | 44.0 | 43.8 | 43.0 | 42.2 | |
| Accumulated Deficits | 130,433 | 136,432 | 139,370 | 137,988 | 134,942 | 131,758 | |
| % of GDP | 20.2 | 20.5 | 20.2 | 19.3 | 18.3 | 17.3 | |
Disclaimer
This report is provided by TD Economics. It is for informational and educational purposes only as of the date of writing, and may not be appropriate for other purposes. The views and opinions expressed may change at any time based on market or other conditions and may not come to pass. This material is not intended to be relied upon as investment advice or recommendations, does not constitute a solicitation to buy or sell securities and should not be considered specific legal, investment or tax advice. The report does not provide material information about the business and affairs of TD Bank Group and the members of TD Economics are not spokespersons for TD Bank Group with respect to its business and affairs. The information contained in this report has been drawn from sources believed to be reliable, but is not guaranteed to be accurate or complete. This report contains economic analysis and views, including about future economic and financial markets performance. These are based on certain assumptions and other factors, and are subject to inherent risks and uncertainties. The actual outcome may be materially different. The Toronto-Dominion Bank and its affiliates and related entities that comprise the TD Bank Group are not liable for any errors or omissions in the information, analysis or views contained in this report, or for any loss or damage suffered.
Download
Share: