Narrowing of the Wealth Gap – Outcomes of Canadian Households Post Pandemic
Mekdes Gebreselassie, Economic Analyst
Date Published: March 11, 2026
- Category:
- Canada
- Future Ready Economy
Highlights
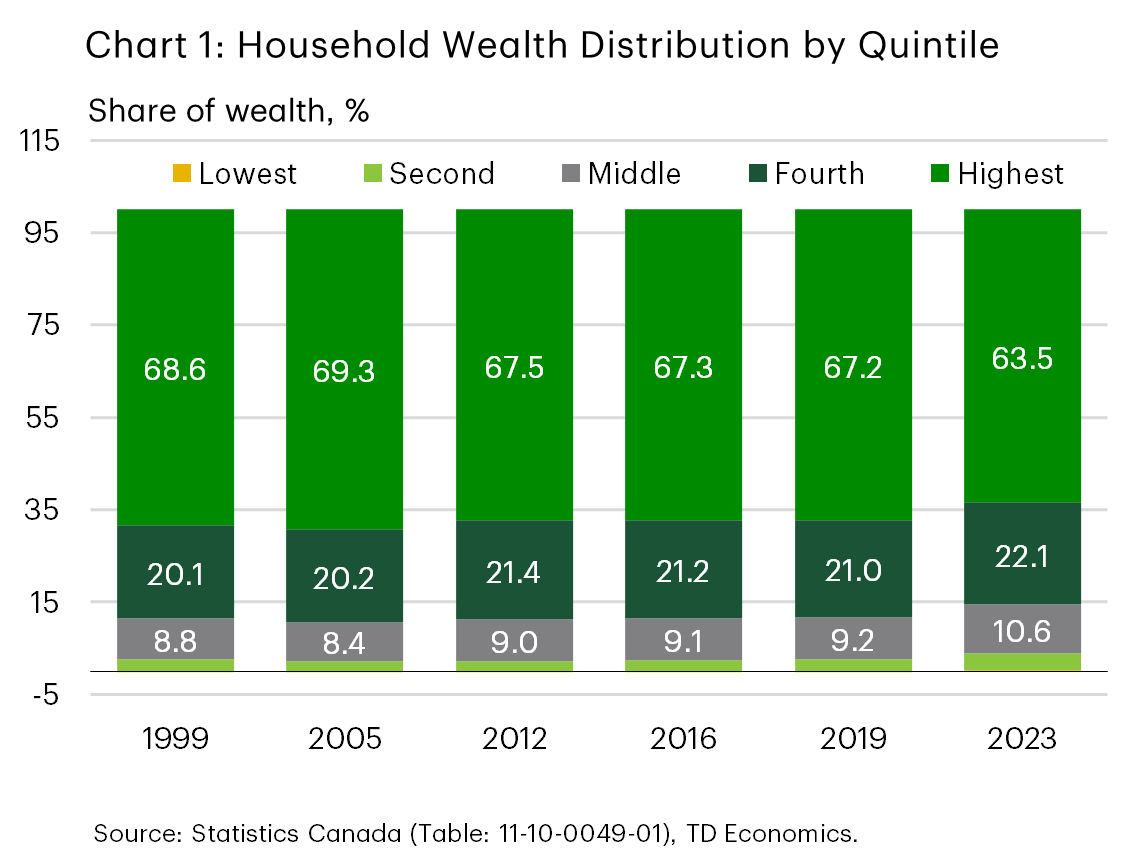
- Despite high living costs, data shows that the wealth gap, the difference in the share of wealth held by the top 20% and the bottom 40% of households by wealth, narrowed by 5 percentage points from 2019 to 2023 reaching a record low.
- Average wealth for the bottom 40% increased over seven times faster than for the top 20%. Similarly, average wealth for households where the major income earner is under 35 years of age also increased over seven times faster than that of 35 years and older households.
- Across the board, financial and real estate assets showed strong performances as did vehicles and other non-financial assets.
- However, vulnerabilities exist with the net worth of households in the bottom 40%, at a median of $64,150 in 2023, falling short of providing financial security.
- Moreover, many young households that became homeowners between 2019 and 2023 were likely propped up by funds from parents, with recent data up to the third quarter of 2025 indicating that young households could be opting out of homeownership due to cost-of-living pressures.
The rising cost of living has left many Canadian families feeling like they are struggling to make ends meet. According to a recent survey by Abacus Data, 67 percent of Canadians said the cost of living “feels as bad as it ever has”1. It comes as a surprise then that data from the Survey of Financial Security (SFS) show that low wealth households grew their net worth faster than their wealthier counterparts as did young over older households, in 2023 compared to 2019. In fact, the wealth gap, the difference in the share of aggregate wealth held by the top 20% and the bottom 40%, narrowed by 5 percentage points to reach a record low of 60 percentage points (chart 1).
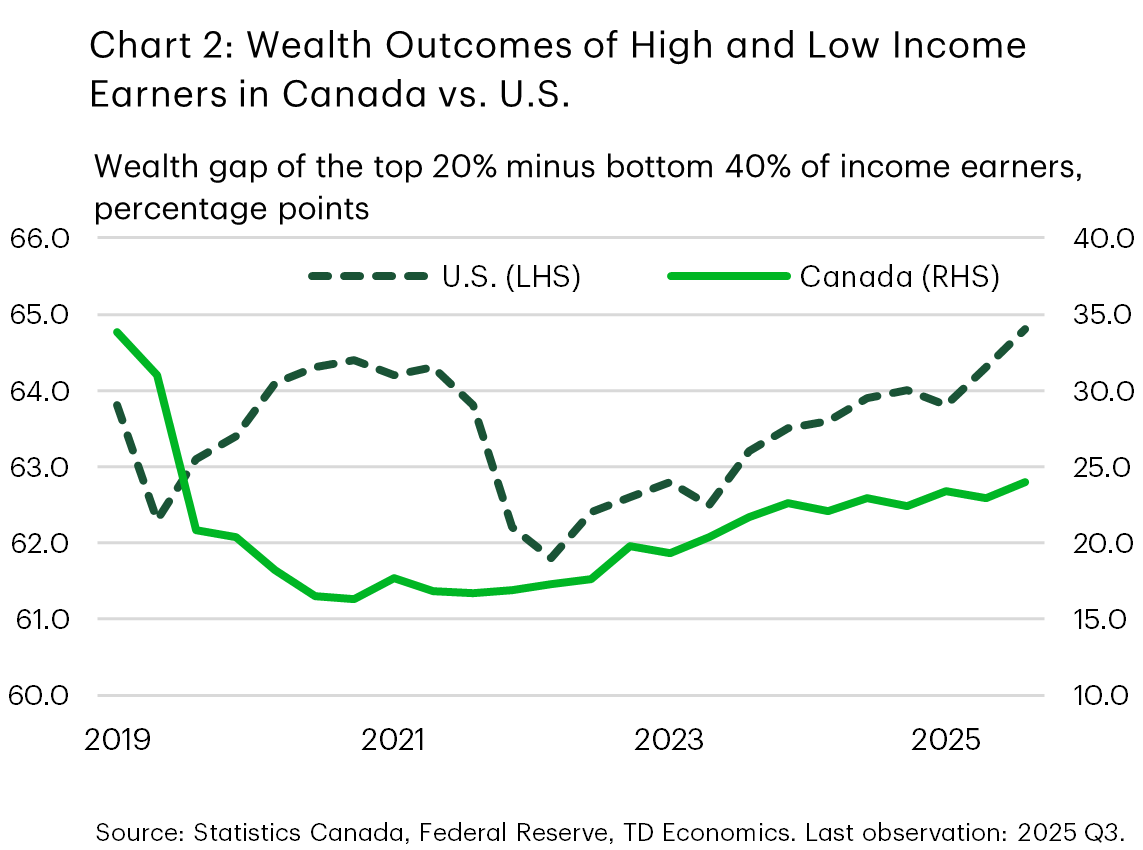
What is more, based on Distributions of Household Economic Accounts (DHEA) data, the gap has stabilized into the third quarter of 20252. This is also the case with the wealth distribution by income, where the wealth gap between the top 20% and bottom 40% of income earners narrowed from pre-pandemic levels in 2019. By way of comparison, this diverges from the story in the U.S. where the wealth gap between the top 20% and bottom 40% of income earners in 2025 edges higher than that in 2019 (chart 2).
Canadian data indicate that low wealth and young families pulled together their financial resources to take advantage of the low-interest rate environment and financial market strength by investing in real estate and financial markets. Pandemic era government support, income gains, and familial financial support are likely to have uniquely boosted those deemed lower wealth and younger households, resulting in their net worth growing faster than the rest of the population.
Bottom 40% Gained on All Fronts
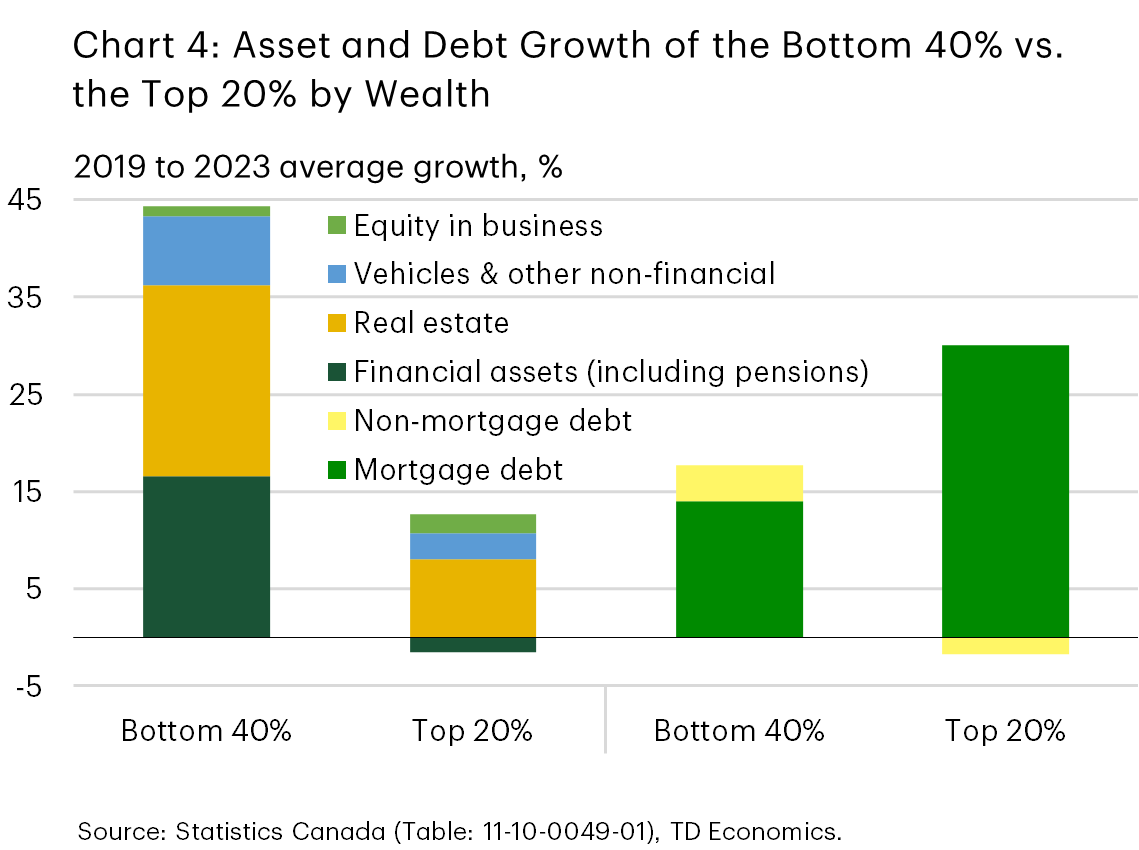
The bottom 40% of Canadian households gained wealth rapidly relative to their richer counterparts between 2019 and 2023. Over this period, average net worth grew by a record 76 percent for the bottom 40% which is over seven times faster than for the top 20% (chart 3). Both real estate and financial assets were strong contributors to asset gains for the bottom 40% with their average assets rising four times faster than that of the top 20%. However, net debt, financial and other non-real estate assets become top contributors to net worth gain as mortgage debt dampens gains from real estate assets (chart 4).
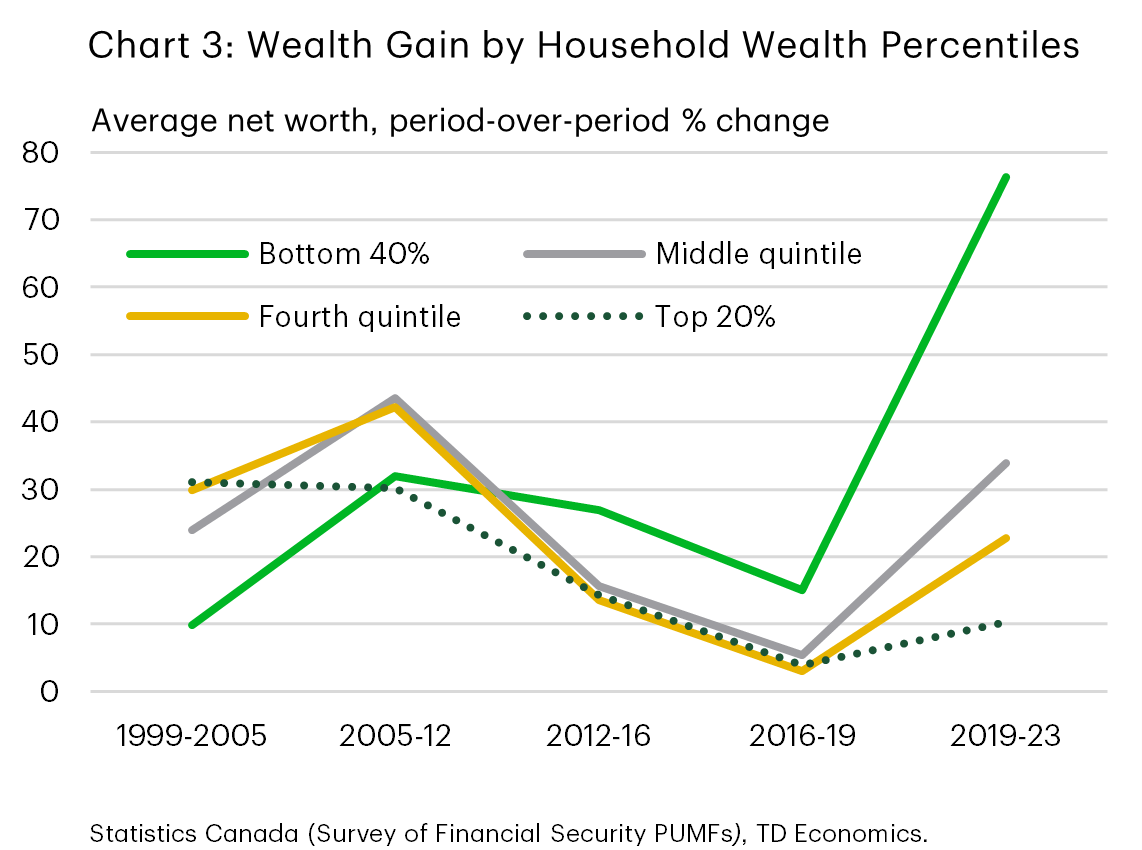
Now compare that to the wealth for the average household in the highest quintile, which grew by just 10 percent with roughly 70% coming from real estate equity. A factor holding back asset accumulation for this cohort was a reversal in fortunes for financial assets reflective of a decline in pensions. This is unique to the wealthiest quintile and comes through in the 55 to 64 and, to a lesser extent, the 45 to 54 years old cohorts. Plausible explanations are an increased shift to defined contribution plans (DCPs) from defined benefit plans for the 45 to 54 age group and reduced employee contributions towards DCPs as these older age groups redirect funds to other priorities.
Wealth Across Age Groups
Young Canadians have been facing acute challenges with affordability and unlocking homeownership, yet the SFS data show that they were able to build wealth at a higher rate than the rest of the population. The average household under 35 years of age increased its wealth by over seven-fold the pace of the increase for the average household 35 and above (81% vs. 11%), between 2019 and 2023. This led to a record increase in young households’ share of total household wealth of 3 percentage points to 9% despite a relatively modest decline, of 2 percentage points to 19%, in their population share.
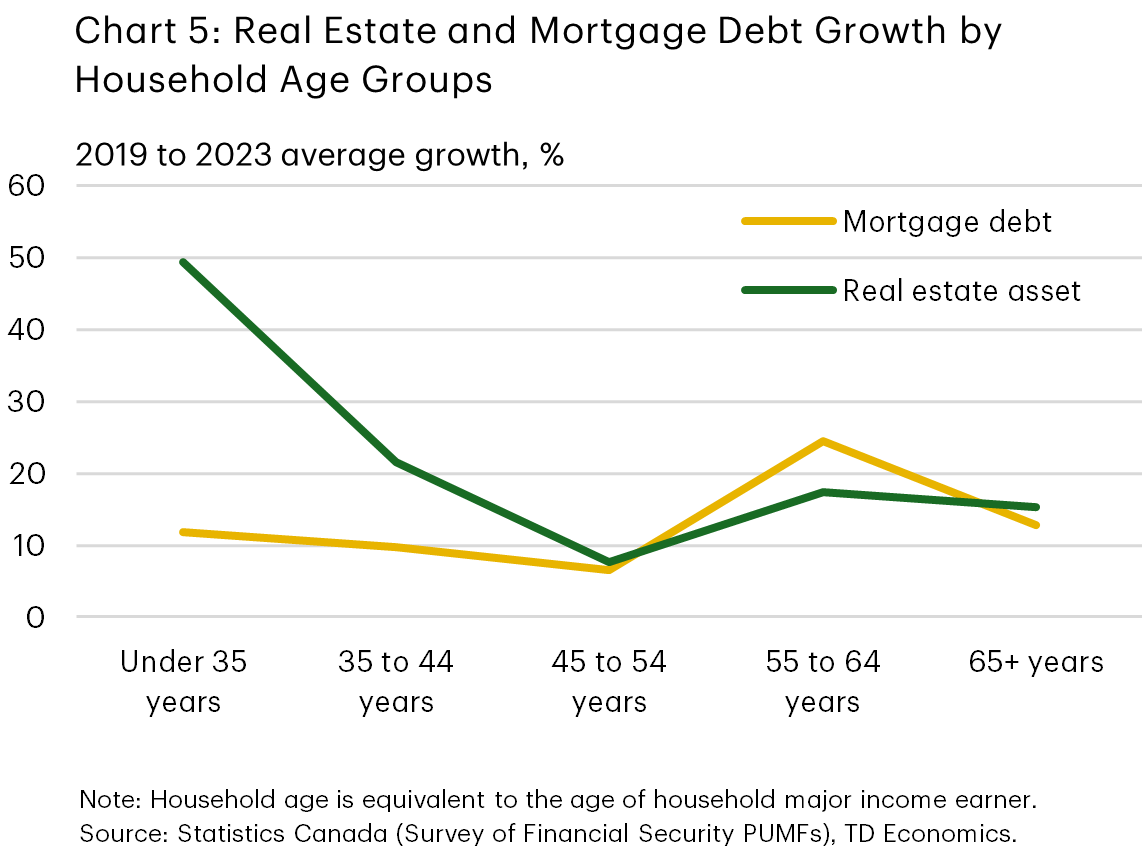
Comparing asset and debt growth trends across age groups and over SFS survey years reveals the extent to which the bank of mom and dad could have propped up young households. Average mortgage debt of households aged 55 to 64 years – the age of most parents to those aged under 35 – increased by 1.4 times the increase in their average real estate asset, between 2019 and 2023. In reverse, under-35 households saw an increase in average real estate assets that was 4.2 times that of average mortgage debt (chart 5). This could be attributed to parents drawing on their home equity to take on secondary mortgages, and/or making lower down payments on properties they bought after 2019, to financially support their children with down payments towards homes.
Homeownership of Young Households
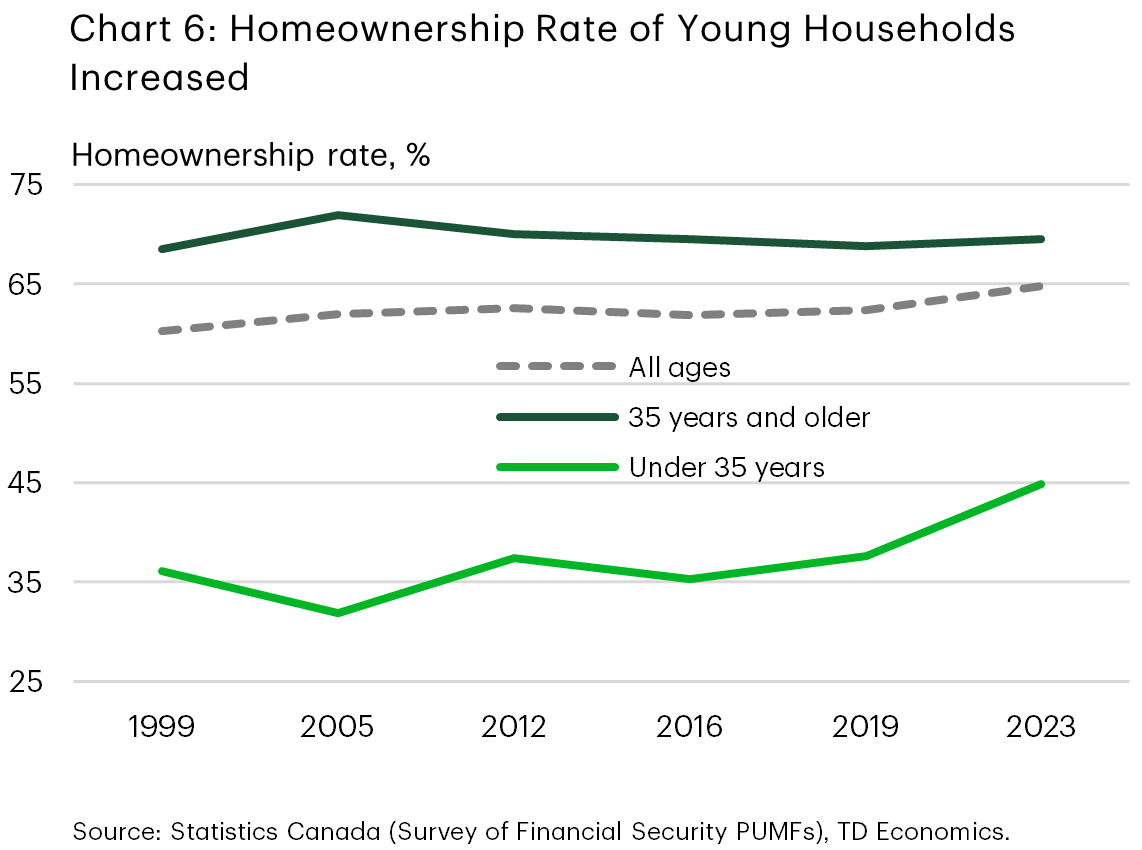
In line with young households’ significant wealth gains, their homeownership rate also reached a record high, growing at a faster pace than that of the rest of the population – a 7 percentage points increase for under 35 years aged households compared to 0.6 percentage points for the rest of the population between 2019 and 2023 (chart 6).
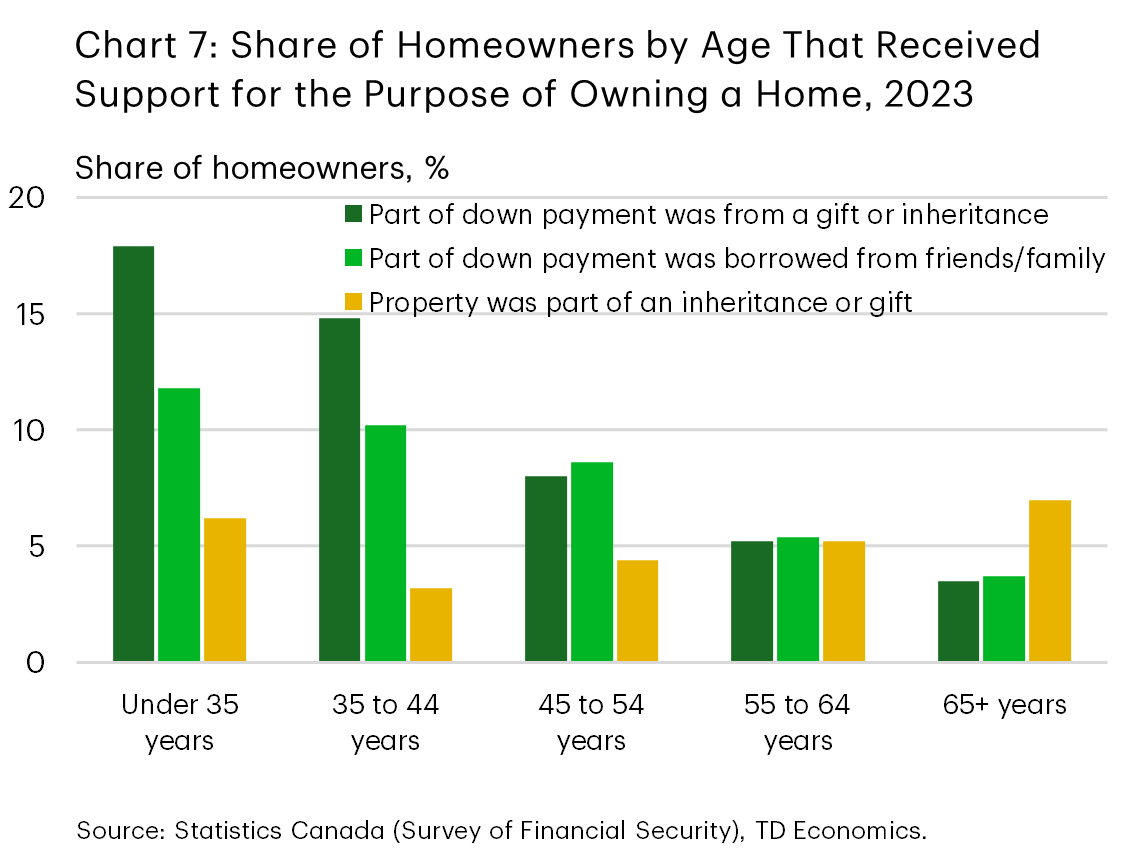
As referred to earlier, financial support from family members, in the form of inheritance, loans and gifts, likely played an important role in this record high homeownership rate. The average inheritance received by under 35 households increased 45 percent (to $138,438) compared to 22 percent for all households (to $197,245), in real 2023-dollar terms, between 2019 and 2023. Moreover, although the SFS does not specifically capture the amount of financial support going towards down payment, it does show that the percentage of younger homeowners reporting to have received some form of familial support in owning their homes was higher than homeowners in older age groups in 2023 (chart 7).
In addition, within the 25-34 years age range, there has been a shift in demographics towards the upper end, where homeownership rates tend to jump up. Compared to 2016, a greater share of households were in the 32-33 age group, which now reflected the highest weight in 2023. We estimate that this shift in age demographics accounted for 5 percent of the homeownership rate increase for the entire age cohort3.
Vulnerabilities
So why does affordability sentiment not match the numbers? It is important to highlight that in absolute terms, the wealth held by many households in the bottom 40%, with a median net worth of $64,150 in 2023, still falls short of providing financial security in the face of high living costs and job uncertainties. Households in the lowest quintile are especially vulnerable with a median net worth of only $12,500 in 2023.
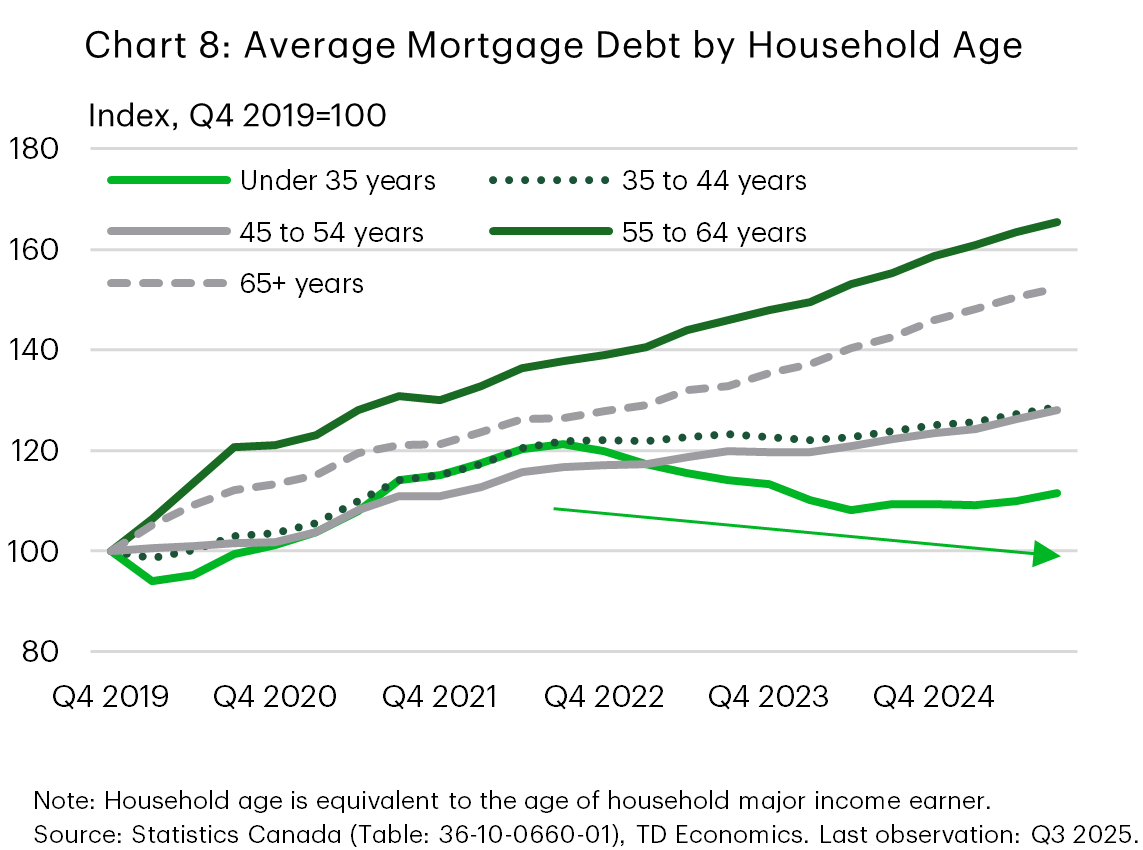
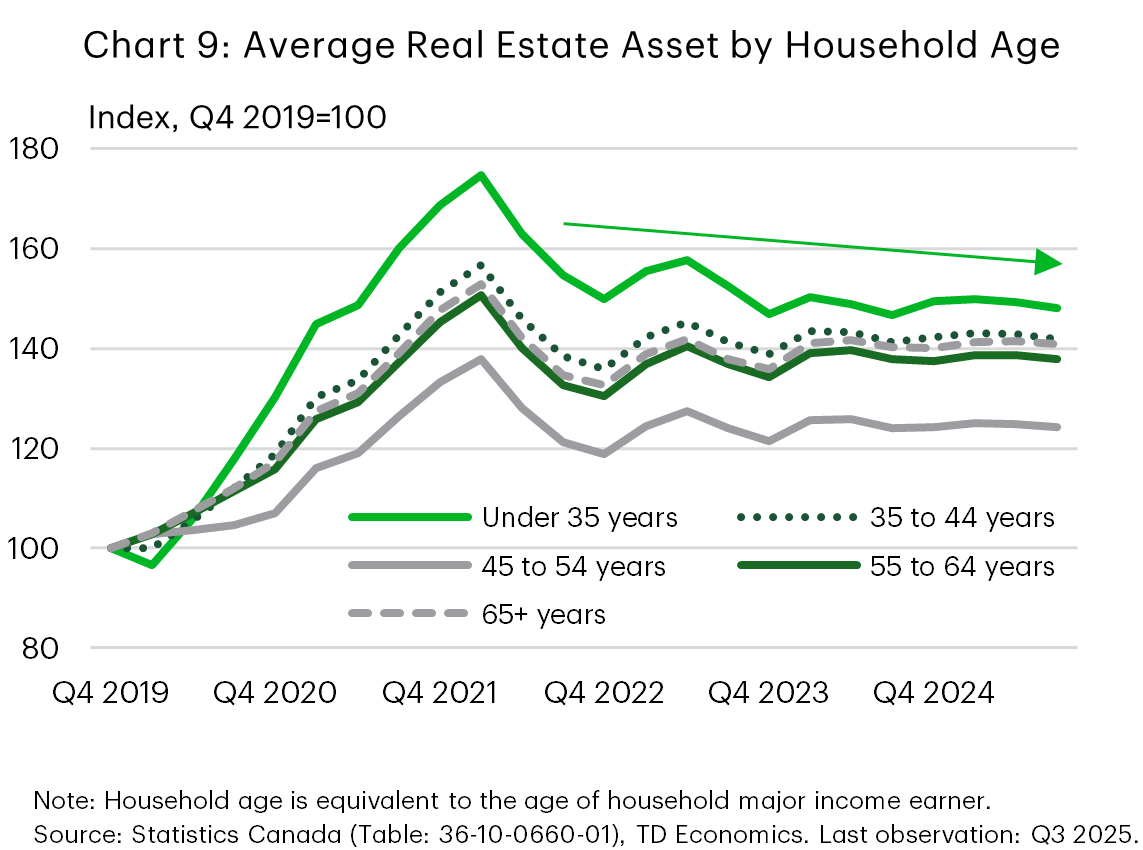
What is more, recent data from the DHEA potentially reflect an unwinding in the record high homeownership rate captured by the 2023 SFS data. Specifically, the DHEA indicates that young households under 35 years could be opting out of homeownership. Average real estate assets for this group decreased 4 percent alongside an 8 percent decrease in mortgage debt from Q3 2022 to Q3 2025 (charts 8&9). This period coincides with mortgage rates that sat at their highest level since 20084, demonstrating the younger age cohort has greater sensitivity to interest rates due to the lack of existing wealth or equity within a home. Statistics Canada noted that prospective homeowners could be avoiding the housing market due to affordability concerns, while existing homeowners may be paying off their mortgage debt balances or relocating to more affordable accommodations5.
Bottom Line
The 2023 SFS data, especially the release of the public use microdata file in 2025, provided the first opportunity for a comprehensive comparison of the state of household wealth outcomes in Canada after the pandemic relative to prior years. And it is clear that wealth outcomes in 2023 were heavily influenced by historically low interest rates from 2020 to early 2022 that led to peak real estate activity and strong financial market gains. Encouraged by government transfers, familial support and income gains, low wealth and young families were able to increase financial investments and own homes at unprecedented rates.
However, the data also provides a reminder of the advantages of those with intergenerational wealth. We had previously written that homeownership and wealth creation are closely linked and in many instances stem from having parents who can afford to transfer wealth. That is echoed here. The concern is that young people today without intergenerational wealth will become increasingly disadvantaged in future years. Among other reasons, this could be behind the existing negative sentiment around housing and living costs, especially among young people. Additionally, in absolute terms many in the lowest two quintiles simply do not have wealth that creates a sense of financial security in the face of relatively elevated prices of essentials combined with economic uncertainties. Lastly, cognitive biases such as recency bias, as in people retaining sentiment tied to pandemic era high inflation, could be at play.
Ultimately, areas where people continue to feel strains – food, shelter and job security – would have to be addressed, along with broader national productivity challenges. And policies geared towards low wealth/income population improved upon, like the automatic tax filling for low-income individuals, Automatic Federal Benefits, announced late last year. That said, the overall positive development in Canadian household wealth since the pandemic is cause for some optimism.
End Notes
- Abacus Data, For 67% of Canadians, the cost of living feels as bad as it ever has, December 15, 2025
- In absolute terms the wealth gap calculated from the DHEA data is slightly different from that calculated using the SFS data, due to differences in data source and methodologies. However, the trend is identical with the gap narrowing 4.3 ppts from 2019 to 61.6 ppts in 2023 and staying at about that level as of Q3 2025 (62.4 ppts).
- 2016 is the latest SFS year where the PUMF data uses the actual age of the major income earner rather than a range and could thus be used to isolate homeownership rate by age. Calculation is derived by holding the homeownership rate by age constant at 2016 levels and using individual population by age data to approximate for household by age in 2023.
- Statistics Canada, Canada Mortgage and Housing Corporation, conventional mortgage lending rate, 5-year term, February 16, 2026
- Statistics Canada, Distributions of household economic accounts for income, consumption, saving and wealth of Canadian households, third quarter 2025, January 29, 2026
Disclaimer
This report is provided by TD Economics. It is for informational and educational purposes only as of the date of writing, and may not be appropriate for other purposes. The views and opinions expressed may change at any time based on market or other conditions and may not come to pass. This material is not intended to be relied upon as investment advice or recommendations, does not constitute a solicitation to buy or sell securities and should not be considered specific legal, investment or tax advice. The report does not provide material information about the business and affairs of TD Bank Group and the members of TD Economics are not spokespersons for TD Bank Group with respect to its business and affairs. The information contained in this report has been drawn from sources believed to be reliable, but is not guaranteed to be accurate or complete. This report contains economic analysis and views, including about future economic and financial markets performance. These are based on certain assumptions and other factors, and are subject to inherent risks and uncertainties. The actual outcome may be materially different. The Toronto-Dominion Bank and its affiliates and related entities that comprise the TD Bank Group are not liable for any errors or omissions in the information, analysis or views contained in this report, or for any loss or damage suffered.
Download
Share: