Housing affordability has always been a hot button issue in Canada, but it was set ablaze as national home prices skyrocketed in the last decade. Even with the recent correction, the average home price is still 80% higher than 10 years prior and has significantly outpaced employee compensation that’s clocking in at 47%.
While sky-high home prices have traditionally been a story of major urban areas, the rise of remote work during the pandemic unhinged prices in smaller cities. Take Ontario. The province has experienced the steepest price correction so far within the country, yet prices in the Greater Toronto Area (GTA) remain 40% higher relative to the last two years and have more than doubled in the past decade. By comparison, over those time periods, we estimate that the average Toronto income has risen by approximately 7% and 32%, respectively. Yet, that's a better experience than regions like Guelph and Hamilton, where prices have almost tripled in the past decade. Meanwhile, once thought of as bedroom communities, home price escalation has been even faster in Brantford, the Kawartha Lakes region and Woodstock. In short, it will take more than a short-lived price correction to unwind the erosion of affordability that has been years in the making.
However, the impact of rising home valuations on wealth inequality is complex. Contrary to the perception that housing is leading to higher inequality, the data on its surface suggests the opposite. Wealth inequality, while high, has narrowed slightly over time with the rise in homeownership among low-wealth households acting as one force keeping inequality in check. And in another contradiction to the narrative around housing, the households driving that increase are disproportionately younger Canadians.
 Disaggregating that "low wealth" group of individuals reveals that younger homeowners are acquiring that designation because of the higher rates of leverage they take on to become homeowners. Data used in this report from the Survey of Financial Security (SFS) does not follow the same cohort of individuals over time. If it did, we suspect that many of those individuals in their early years of homeownership would not hold that “low wealth” status with the passage of time. The dynamics of rapid home price escalation and a shrinking outstanding mortgage would automatically improve net wealth standings. This means that wealth inequality is really a narrative that differentiates Canadians who are homeowners versus those who are not.
Housing access as the great leveler?
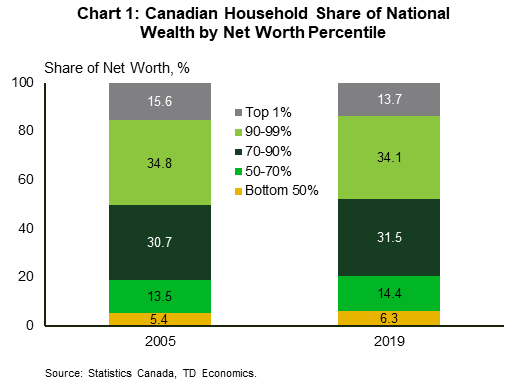
This narrative becomes evident when looking at SFS data on Canadian wealth over time. In 2019, the share of wealth held by the top 10% of the wealthiest Canadians fell from 50% in 2005 to 47.8%. Even the share of wealth held by the top 1% fell over those years (Chart 1). National net wealth more than doubled over those years, meaning that the middle and bottom portions of the distribution gained ground, both in absolute terms and relative to the top.
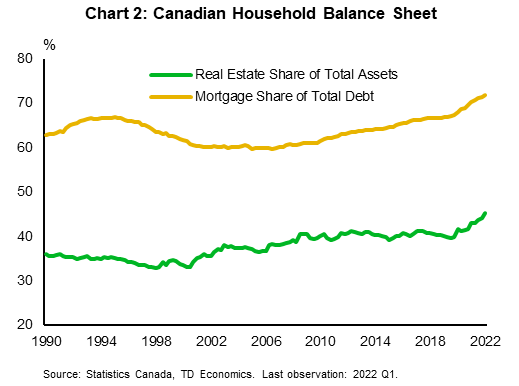
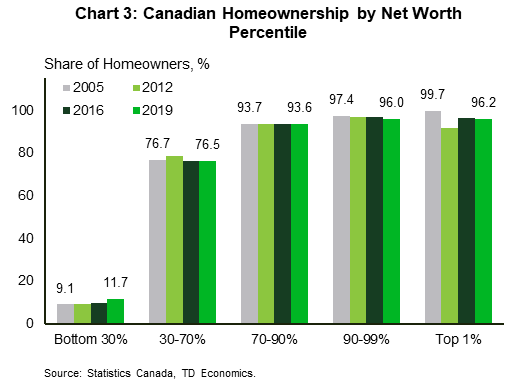
Several factors have kept wealth inequality in check, but housing is the single, most important element of the household balance sheet. The real estate share of total assets rose from 37% in 2005 to 45% today. By extension, the mortgage share of total debt also rose (Chart 2). And the SFS data show homeownership increase among the bottom 30% paired with a slight decrease among the top 10% to be a main factor in the modest narrowing of the wealth gap – 3 percentage points increase as opposed to an average 2 percentage point decrease in the top 10% (Chart 3).
Young Canadians drive the wealth increase in the bottom 30%, but not all is as it seems
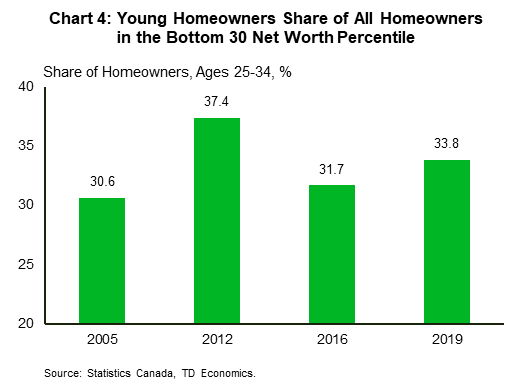
While already counter to the prevailing narrative, the story is further complicated by who is partly driving the increase in homeownership in this wealth bracket. A growing share in the bottom 30% are younger people between the ages of 25 and 34. In 2019, only 12% of people in the bottom 30% were homeowners, but among them, the share of the younger cohort rose by 3 percentage points since 2005 (Chart 4).
These data may challenge conventional thinking that young Canadians have been shut out of the housing market. In fact, they are acquiring housing at similar rates as previous generations at that equivalent age.1, 2
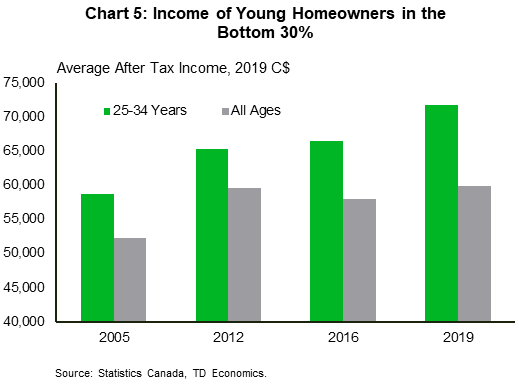
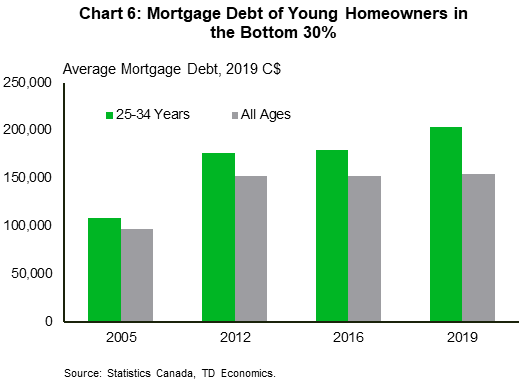
But digging beneath the surface, we find that the profile of these young households has changed. First off, after inflation-adjusting the SFS data, it shows that average incomes and mortgage debt among those surveyed in 2019 was far higher than those in the same age bracket from prior surveys (Chart 5 and 6). As the cost of homeownership rises, more leverage is creating a lower starting point in the net worth of these young owners, capturing them in the lower net worth brackets.
This shifting composition of homebuyers towards those with higher incomes may have been exacerbated by changing mortgage regulations after the 2008-09 financial crisis, including the implementation of income stress tests that applies to all borrowers of federally regulated financial institutions. The stress test requires lenders to assess a prospective borrower's income at a higher interest rate relative to their mortgage contract rate. It has been a key factor mitigating financial risks within the housing market, but a side-effect is that lower-income and lower-wealth borrowers face a high bar on accessing homeownership.
In addition, a growing body of research points to the role of parental wealth in perpetuating unequal access to homeownership. Drawing on a recent U.S. study, it showed a 17.3 percentage point gap in homeownership rates between millennials whose parents were homeowners relative to those whose parents were renters. Even correcting for age, household income, education level, marital status and race, the gap remains at 8.4 percentage points.3
This occurs primarily because homeowners tend to have higher levels of wealth that can be passed on as financial assistance to their children. A 2020 survey conducted by the National Association of Realtors in the U.S. indicated that 32% of first-time homebuyers received a gift or a loan from a friend or relative to help with the down payment. And homeowners were more than twice as likely to provide this assistance relative to non-homeowners.4
Recent data on Canada underscore the more significant role that parental wealth may be playing in driving housing access among young people. A 2020 Abacus survey conducted in Ontario showed that 41% of parents with children under 38 years of age have helped their children financially in purchasing a home, with the average gift exceeding $73,000 and the average loan exceeding $40,000.5 While parents did not explicitly cite drawing from home equity to achieve this, the source of the funding itself is less relevant.
The role of real estate is truly unique in the household balance sheets of advanced economies, both historically as the only appreciating non-financial asset and as the only appreciating asset that is also continuously consumed – namely, as owner's equivalent rent. This unique combination presents an important safety net that allows for the acquisition and disposition of other, more liquid assets that can then be passed on more easily as financial assistance. In contrast, renter households have no equivalent mechanism.
Unequal access perpetuates more of the same
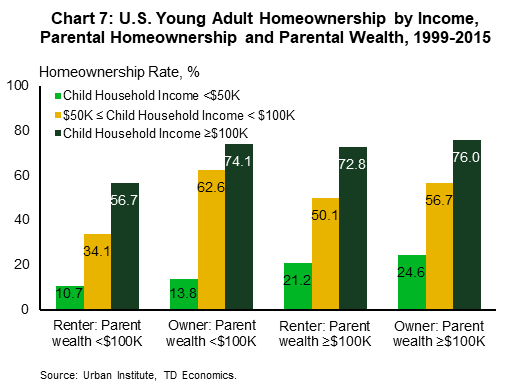
A broad consensus has emerged that there are also social and geospatial equity dimensions to housing access. Galster and Wessel (2019), for example, followed three generations of Norwegian families using linked census, tax, and other register data to track how homeownership perpetuates social inequality. Their findings show that, beyond just wealth and financial assistance channels, homeownership in older generations also bestows a variety of economic benefits including proximity to higher education, better economic opportunities, a higher perceived socioeconomic status and its associated social capital.6 The effects were found to be positively correlated with the geographic distribution of home prices. For instance, higher priced real estate in larger cities, particularly Oslo, was found to have greater indirect effects than smaller cities and rural areas. The data do support this, as even correcting for parental wealth, there still appears to be significant transmission effects between parental homeownership and that of their children. In the U.S., children of homeowner parents with less than $100 thousand in wealth show significantly greater homeownership rates than renter parents with equivalent levels of wealth (Chart 7). Despite these studies reflecting non-Canadian specific data, there’s no reason to presume that the transmission mechanism stemming would tell a different story in Canada.
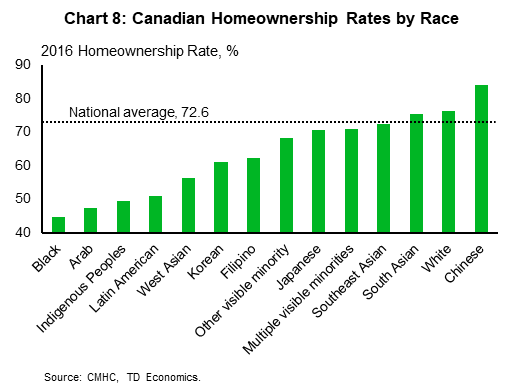
This dynamic is of particular importance to racial equity given historically large disparities in homeownership rates across ethnic groups. According to Canadian Mortgage and Housing Corporation (CMHC), Black Canadians and Indigenous Peoples have homeownership rates almost 28 and 23 percentage points lower than the national average, respectively, with significant variation across other racial and ethnic backgrounds (Chart 8). Much of the difference is accounted for by differences in income levels, with the gap narrowing significantly after correcting for this. However, even among households with incomes above $150,000, the gap in homeownership remains.7 In other words, the dynamics of how housing perpetuates inequality is embedded directly into the racial dynamics of the country.
Wealth inequality is a story of housing inequality
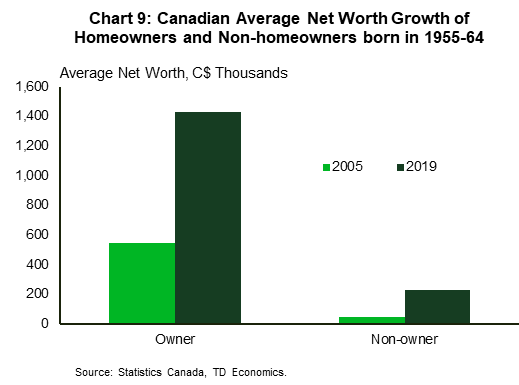
So, while the picture does show that wealth inequality has narrowed across the broad measures, that picture is thoroughly muddied by low wealth households that are relatively well off within their peer group and the intergenerational effects of homeownership. It’s too simplistic to define Canada’s wealth inequality as one of rich versus poor. Over time, it has proven to be one of homeowner versus non-homeowner. For instance, focusing on a single age group born between 1955-1964 in the iterations of the SFS, we estimate that the average net worth of homeowners was more than $1.4 million by 2019. This is $1.2 million more than the average non-homeowner (Chart 9). Back in 2005, this gap was just $498,600, highlighting the wealth-generating advantage posed by real estate.
The low level of average net worth among non-owners in 2005 and the million-dollar divide with homeowners today speaks to the difficulty of accumulating wealth outside of real estate, recognizing this can also be correlated with other outcomes like lower levels of financial literacy. The rise in homeownership in the bottom 30% of the wealth distribution is tinged by the possibility that these higher-income, low wealth, homeowners are perpetuating inequality because those not already in the market may find it significantly more challenging to build wealth over time.
Rising Interest Rates Likely To Widen Wealth Inequality
The current generation of young Canadians is likely to not just repeat, but accentuate the narrative of wealth inequality across housing lines with affordability now at its worst level in decades. The lengths to which young households have to go to acquire housing is becoming untenable without a starting point of higher income relative to peers and/or a transfer of intergenerational wealth, commonly in the form of parental wealth.
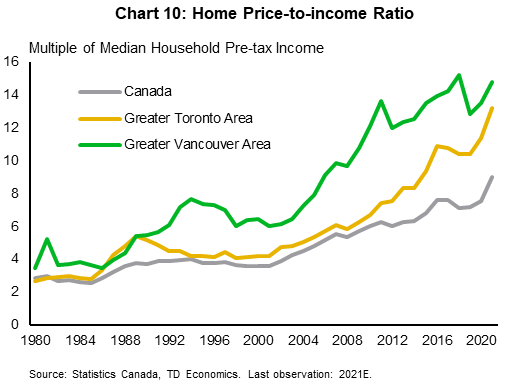
It is important to note that affordability at one point was supportive of younger, middle-income families. The headline indicators might not give that impression. For example, the home price-to-median income ratio has increased steadily from 4.8 times income in 2005 to a record high of 8.8 times income in 2020. In the Greater Toronto and Vancouver Areas, the ratios were 11.4 and 13.5, respectively (Chart 10). Even including our projection for roughly a 25% decline in the average price from the first quarter of 2022, it would only bring the multiple down to 6.7 times income – turning back the clock on affordability by only a few years.
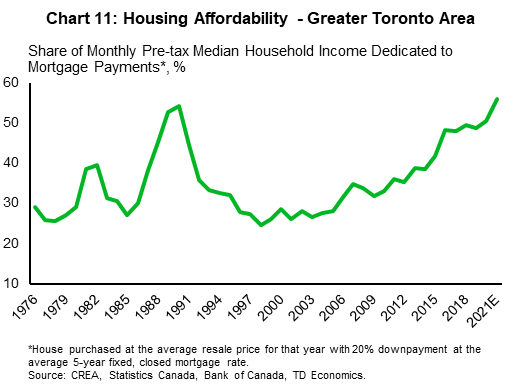
But, corrected for the secular decline in interest rates, the story becomes more nuanced. Using the Greater Toronto Area as an example, affordability improved dramatically following the 1990's recession as both prices and interest rates fell. Even through to 2012, the hypothetical share of the pre-tax median household income dedicated to an average mortgage was relatively low and in line with history. This partly explains why homeownership among young Canadians was able to surge between the 2005 and 2012 surveys of financial security, from 40% to 46%. Since then, the deterioration in affordability (Chart 11) means that a household living in the GTA earning the median household income would need to dedicate 56% of their pre-tax monthly income to mortgage payments to afford the average priced home. Of course, this is predicated on being able to have saved for a sufficient down payment in the first place. Such a high ratio becomes a barrier to even qualifying for a mortgage as Canada’s financial regulator caps the housing-cost-to-income ratio at a certain level in order to protect regulated institutions from excessive risk taking. Consequently, many middle-to-lower income households are, by default, shut out of the market without pre-existing access to wealth from the market.
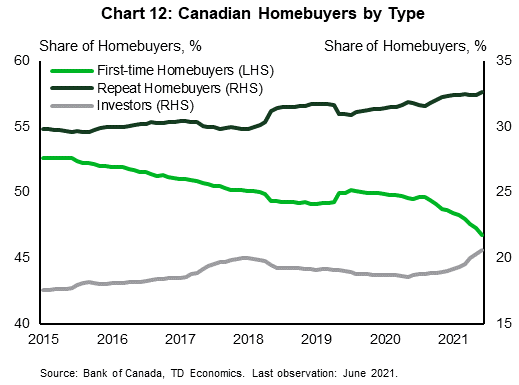
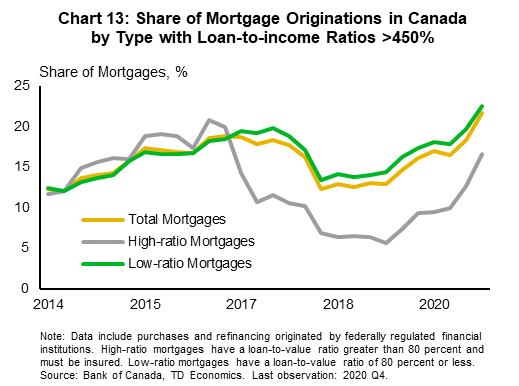
A host of other data further underscore this growing stress. First-time homebuyers have traditionally accounted for more than half of all purchases. However, that share has slowly declined, reaching a low of 46.8% in June 2021, with real estate investors and multiple property owners picking up the difference (Chart 12). In addition, more than one-fifth of new mortgages originated at the end of 2020 had loan-to-income ratios above 450%. This threshold acts as a key indicator of vulnerability for the Bank of Canada. It demonstrates the lengths that Canadians are going to for access to homeownership (Chart 13).
And the story is becoming more challenging over time for those left out. The recent spike in interest rates has lowered home prices and the down payment thresholds, but it has ultimately worsened affordability with higher debt service costs. Each percentage point increase in interest rates from current levels will need to be accompanied by a roughly 10 percent decline in prices to keep mortgage payments the same. Since their low in August 2021, mortgage rates have risen by roughly 238 basis points as of this past August, with more upward pressure still occurring as the Bank of Canada keeps raising rates to anchor inflation expectations. Meanwhile, home prices have so far fallen only modestly. While average home prices are down by 16% between February and August, the MLS home price index is down only 7%. The latter is one of Canada's primary quality-adjusted price indices that offers better guidance on a truer price picture by limiting the impact from compositional shifts in demand. The data do suggest that some regions, cities, and neighbourhoods are seeing greater corrections, and more downward pressure is also coming, but likely not enough to offset the significant increase in interest rates. Moreover, the gap in declines between the average price and the MLS home price index suggests a concentration of downward pressure in higher-priced homes and markets, less relevant to first-time buyers or to the conversation about accessibility more broadly. Also of note, the income stress test, which uses a 2-percentage point buffer above contract rates, further narrows the buyer pool when interest rates are already high and still rising, again favouring those that can access intergenerational wealth to make larger down payments.
Implications, Vulnerabilities, and Policy Considerations
The role that housing and accessibility have played in Canada's economic narrative cannot be understated. Even up to the mid-2010s, the benefits of rising home valuations were accruing to a much broader range of households on the wealth and income spectrums under better accessibility. That thread of the narrative is now fraying, as rapid home price gains have limited accessibility to either high-income households, investors, repeat buyers, or those who benefit from pre-existing family wealth. In a complicated twist, housing has played a role in driving inequality between homeowners and non-homeowners, while also keeping inequality in check among homeowners. This highlights the importance of housing accessibility, not just as a basic necessity-of-life, but also as a natural lean against inequality.
The situation begs the question on whether something ought to be done, particularly for the non-homeowner households? Unfortunately, there are no quick fixes and there’s a simple reality that Canada’s policy milieu can often find itself misaligned or in conflict. For instance, Canada’s immigration policies and targets are critical in addressing regional and sectoral labour shortages and have a broader ambition as a tool for nation building. However, those targets are in tune with labour demand needs, rather than with what aligns to affordable housing by region. And, affordability is further pressured by a Canadian population that settles within a small geographic footprint despite the large landmass of the country. Roughly 60% of the population resides within only a 200-kilometer radius to five metropolitan areas.
From a longer-term wealth and inequality perspective, society depending on homeownership and rising home valuations in perpetuity is unlikely to be a solution to inequality. There will always be a segment of the population for whom homeownership is not possible, or not even desirable, and policies aimed at continually increasing the homeownership rate may simply exacerbate the problem.
On this front, many government initiatives have been announced and should be accelerated and evaluated regularly for outcomes. For instance, at the federal level, net new support for housing affordability is coming mainly from the government’s National Housing Strategy (NHS) launched in 2017. Most of the funding is for either affordable housing for vulnerable populations through the National Housing Co-Investment Fund and the Rapid Housing Initiatives, or market-based rental housing through the Rental Construction Financing Initiative. Although none of these supply-side measures directly address affordability challenges in the ownership space, the inequity divide with non-owners suggests this is an area of pressing need to lower housing costs, which can also help support savings among this group. However, we have yet to see any downward pressure on rents from higher supply, particularly in a high-inflationary environment, and vacancy rates in major metropolitan areas are only now starting to creep up from record lows, but this has more to do with the economic cycle than policy.
To address homeownership accessibility, the federal government has launched several demand-side initiatives aimed at helping first-time buyers, such as the First-Time Homebuyer Incentive or the recently announced Tax-Free First Home Savings Account. However, this does not change the calculus in either the supply-demand mismatch, nor the gap in homebuying potential between those with higher incomes and pre-existing housing or family wealth, versus those without those advantages. Federal policymakers could instead consider a market-based housing initiative aimed at the former or consider easing income-tested conditions for lower and middle-income borrowers within the mortgage stress test when interest rates are already high, in a nod to countercyclical macroprudential policies that are more dynamic than static in consideration of starting points.
In addition, government initiatives to boost supply need a strategic lens. More supply may simply end up in the hands of multiple property owners who, again, have a leg-up on non-owners without pre-existing housing wealth. According to Statistics Canada, multiple property owners represent 15% of owners in BC and Ontario and 20% in New Brunswick and Nova Scotia, but hold 30% and 40% of existing housing stock, respectively.8
Although real estate investors play an important role in helping to fund and develop new housing stock, have the financial benefits become too skewed to one group over another? Mortgage interest deductibility on investment properties helps to direct capital towards building more housing supply. But it is debatable at this point whether a lack of capital is the challenge that property developers face and whether the subsidy, as currently structured, is fit for purpose. Paring deductibility back to align with, say, capital gains inclusion rates and redirecting those supports to underrepresented groups, including Black and Indigenous Canadians, might do more in helping to close housing gaps.
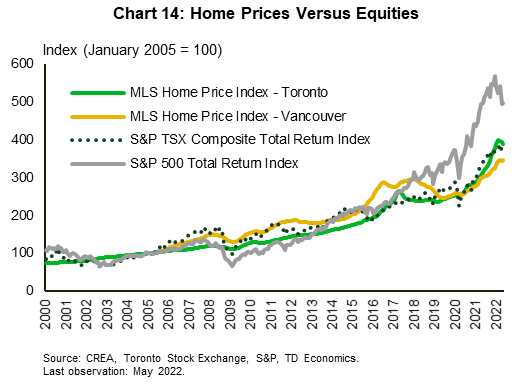
Non-homeowners deserve similar financial support that homeowners receive such that housing doesn't dominate as the “go-to” investment. But longstanding housing policies disproportionately benefit homeowners, including the capital gains exemption on principal residences, the partial GST rebate on new homeownership and new construction, the first-time homebuyers tax credit, renovation tax credits, and the list goes on. All of these tax expenditures and spending programs amass into the popular perception that housing is "always a good investment". Given enough history, a total return equity portfolio can rival or outperform the quality adjusted home price indices, even in Toronto and Vancouver (Chart 14). But that might not be the case for after-tax gains – policy makes all the difference.
On the broader savings side, numerous attempts have been made to raise the savings outcomes of lower-income or lower-wealth households including expansions to programs like the Working Income Tax Benefit (WITB), RESPs and Canada Learning Bonds, RRSPs and TFSAs. However, the overwhelming evidence suggests that many programs tend to disproportionately benefit higher-income, higher-wealth households who naturally have more savings to invest, and even those targeted at lower-income, lower-wealth households are often left untapped. Canadians may be unaware of the supports available, or the supports themselves may be difficult to understand. All said, the savings and investing landscape is so heavily skewed towards housing because the housing system itself is designed to perpetuate inequality between homeowners and non-owners, from zoning that prioritizes single-family homes to tax policies that subsidize ownership. More policies are instead needed to improve outcomes for long-term renters. This can be achieved either by re-assessing the current milieu of housing subsidies, or by providing targeted, equal-value supports for renters to allow the opportunity to save and keep up, rather than forcing Canadians to leverage to greater lengths in order to “get in”.
On the surface, Canada might appear to be doing quite well on inequality, but digging beneath that surface shows that we have merely papered over the fissures that separate Canadians along housing lines. Governments should ensure they are assessing how new and existing policies can unintentionally deepen the divides and how to improve broader access to wealth creation.
End Notes
- https://www150.statcan.gc.ca/n1/pub/11f0019m/11f0019m2010325-eng.pdf
- https://www150.statcan.gc.ca/n1/daily-quotidien/171025/cg-c004-eng.htm
- https://www.urban.org/sites/default/files/publication/98729/2019_01_11_millennial_homeownership_finalizedv2_0.pdf
- https://www.nar.realtor/sites/default/files/documents/2020-downpayment-expectations-and-hurdles-to-homeownership-report-04-16-2020.pdf
- https://www.orea.com/affordabilitypollingwave2
- https://www.sciencedirect.com/science/article/abs/pii/S0049089X17309717
- https://assets.cmhc-schl.gc.ca/sites/cmhc/professional/housing-markets-data-and-research/housing-research/research-reports/housing-finance/
research-insights/2021/homeownership-rate-varies-significantly-race-en.pdf?rev=8c074e0c-111e-47ff-9a9f-8233c623cf11 - https://www150.statcan.gc.ca/n1/daily-quotidien/220412/cg-a001-eng.htm
Disclaimer
This report is provided by TD Economics. It is for informational and educational purposes only as of the date of writing, and may not be appropriate for other purposes. The views and opinions expressed may change at any time based on market or other conditions and may not come to pass. This material is not intended to be relied upon as investment advice or recommendations, does not constitute a solicitation to buy or sell securities and should not be considered specific legal, investment or tax advice. The report does not provide material information about the business and affairs of TD Bank Group and the members of TD Economics are not spokespersons for TD Bank Group with respect to its business and affairs. The information contained in this report has been drawn from sources believed to be reliable, but is not guaranteed to be accurate or complete. This report contains economic analysis and views, including about future economic and financial markets performance. These are based on certain assumptions and other factors, and are subject to inherent risks and uncertainties. The actual outcome may be materially different. The Toronto-Dominion Bank and its affiliates and related entities that comprise the TD Bank Group are not liable for any errors or omissions in the information, analysis or views contained in this report, or for any loss or damage suffered.
Download
Share: