Highlights
- The current elevated level of youth unemployment is largely reflective of the overall weakness in the labour market as younger workers bear a larger share of the slowdown. However, the rise in unemployment among teenagers is less explained by the overall state of the labour market and likely reflects additional factors.
- Sectoral evidence shows that employment weakened most in industries that traditionally employ younger workers. More broadly, changes in workplace organization are likely limiting opportunities for entry-level jobs.
- Rapid population growth amplified the cyclical pressure by expanding the labour force. As labour force growth slows and the labour market recovers, much of the recent increase in youth unemployment should unwind.
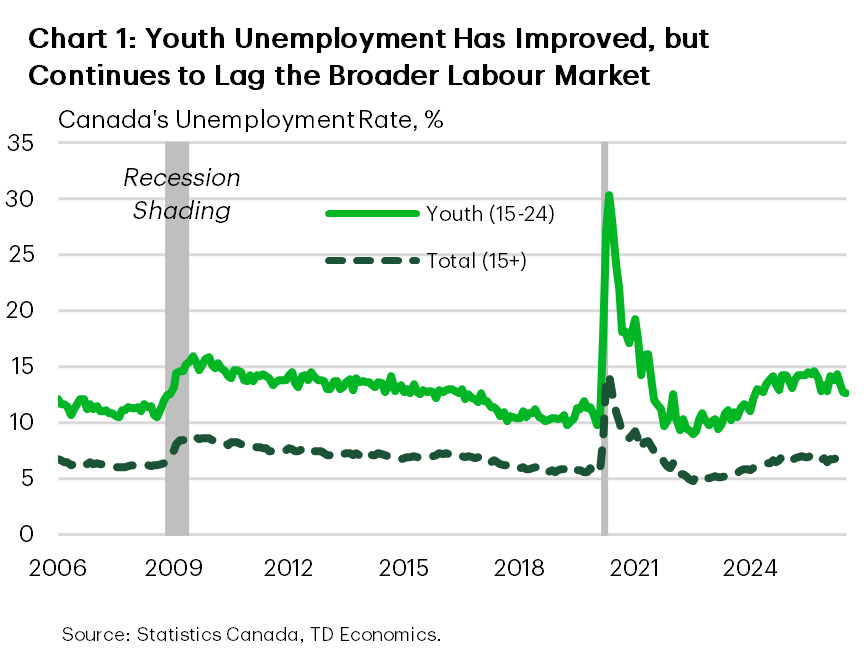
Recent Labour Force Survey releases brought welcome signs that Canada’s labour market is stabilizing. Employment recovered much of the ground lost earlier this year, and youth labour market conditions have improved alongside it. The unemployment rate for Canadians aged 15 to 24 has fallen from 14.6% last September to 12.6% in July. Yet despite that improvement, the gap relative to the overall unemployment rate remains wide, suggesting that younger workers continue to experience a much softer labour market (Chart 1).
Public debate has gravitated toward dramatic explanations: artificial intelligence hollowing out entry-level work, a broken school-to-work transition, or an immigration surge overwhelming the youth labour market. In reality, current conditions likely reflect both the rise in labour supply and the traditional amplified deterioration in the youth labour market when economy-wide job prospects weaken. There is also an important nuance: the rise in unemployment among teenagers is less well explained by macroeconomic conditions and may reflect additional factors.
Start With the Business Cycle
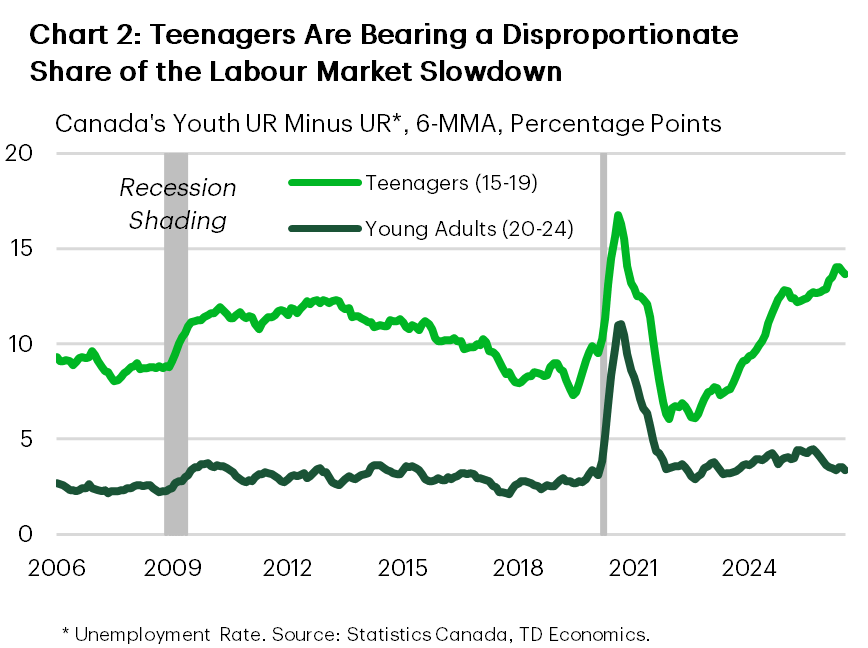
Economic slowdowns rarely affect all workers equally. Younger workers (aged 15-24) are usually the first to feel the effects. They are often the last hired and the first affected when hiring slows. When demand softens, employers typically stop adding to the bottom of the career ladder first, causing the youth share of employment to decline before broader labour market weakness becomes pronounced. Yet, the current cycle has been particularly harsh for teenagers. Relative to Canada’s overall unemployment rate, the labour market for the youngest workers (15 to 19) has deteriorated far more than that of young adults (20 to 24) (Chart 2). This suggests that the youngest workers are bearing a disproportionate share of the slowdown.
To get a sense of just how far things have weakened, we model what the unemployment rate for teenagers (15-19) and youth (20-24) would be expected to be based purely on the unemployment rate for those 25 and over (excluding the atypical pandemic period)1. This relationship should describe slack in the labour market for younger people relative to older workers, capturing common factors like the population surge and the business cycle. The implied unemployment rates in Chart 3a, and 3b show that for those 20-24 the current labour market is roughly where one would expect it to be, whereas for those 15-19, the unemployment rate is higher. It should be noted that the relationship between teenage unemployment rates and the general market is not as strong as that of the 20-24 year-old cohort and can underestimate the variation. Importantly, this suggests movements in teenage unemployment are less closely tied to the broader business cycle than the older cohort (Chart 3a, 3b).
The reassuring part for the outlook is that as the national unemployment rate has started falling, so has the youth unemployment rate. The expectation is that younger workers should benefit disproportionately from the recovery, just as they absorbed a disproportionate share of the slowdown. However, the case of teenagers (15 to 19) bears closer examination.
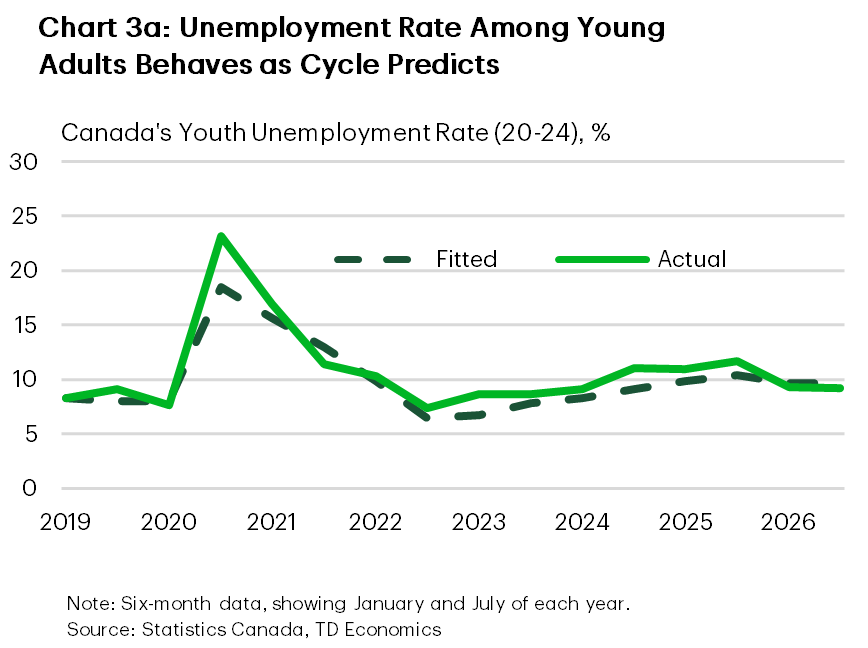
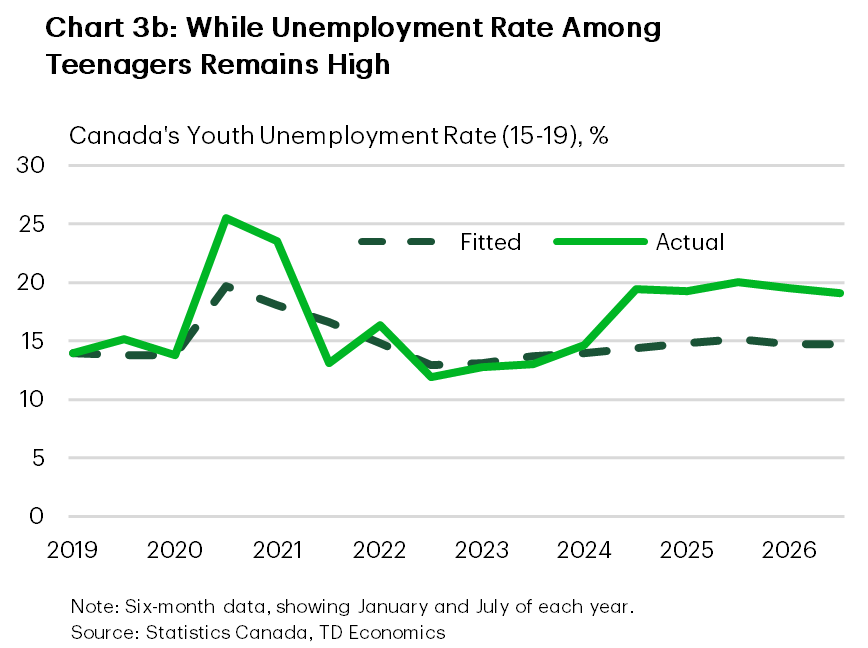
The gap is meaningful. It is worth exploring whether the explanation goes beyond macroeconomic conditions and toward the types of jobs teenagers typically hold: first jobs, part-time jobs, and positions requiring less experience concentrated in a relatively small number of industries.
Industries Tell Part of the Story
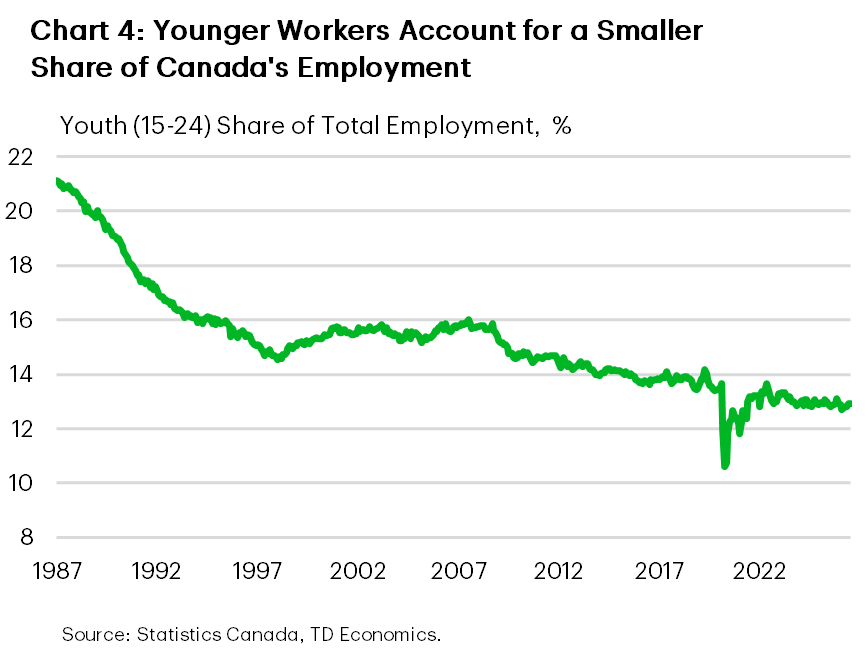
To understand where youth employment has weakened, we look at the industries which tend to employ large numbers of youth. Industry level data from the labour force survey don’t provide more detail than the 15-24 age group, but it is important to note that youth share of total employment has been on a gradual structural decline since the late 1980s, reflecting demographic change, rising educational attainment, and longer-term shifts in the economy (Chart 4). That trend paused between the mid-1990s and the Global Financial Crisis before resuming, with the pandemic accelerating the decline.
Since 2019, the deterioration has been concentrated in a handful of sectors. There are two ways a sector can pull down youth employment. The sector can employ fewer workers overall, either because demand has weakened or because it is producing the same output with fewer workers as productivity improves. Or it can carry on at the same employment level but hire fewer young people.
The two industries behind most of the recent decline in the youth’s share of employment are accommodation and food services and retail trade (Chart 5). Together they have been responsible for roughly 25k fewer jobs among young people between 2019 and today. Both sectors combine two characteristics: they are among the most cyclical industries in the economy, and they employ the highest concentration of young workers. If the business cycle is the primary driver of youth unemployment, these are precisely the sectors where we would expect the effects to be most pronounced. Moreover, as of 2023 (the most recent data) 55% and 60% of employees in these industries have a high school education or less. Given their disproportionate weakness, this could partially explain the weak job market for 15–19-year-olds, versus their more educated counterparts.
The Accommodation and Food Services sector was hit hard by the pandemic and has been slow to regain momentum (Chart 6). However, younger workers held their place inside it, even gaining share. Its drag on youth employment comes from the sector’s shrinking footprint, not from hiring fewer young people. If it continues to recover, those jobs should return.
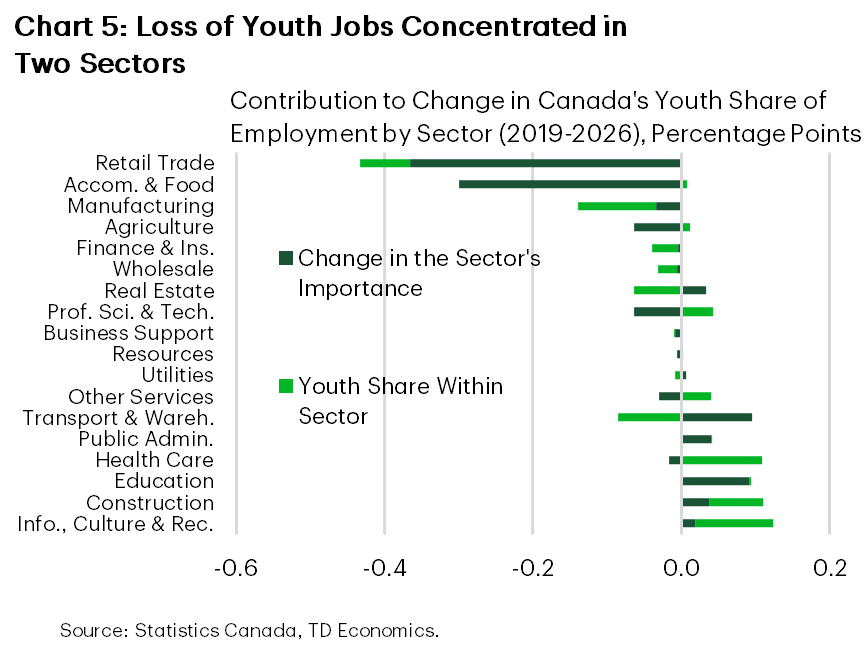

Employment in the retail sector is the more troubling case. As hiring has slowed, employers appear to be retaining and hiring proportionately more experienced workers, leaving a smaller share of remaining jobs for younger workers, suggesting both cyclical and structural forces at work. The continued shift toward e-commerce and automation has played a structural role and likely reduced the number of job opportunities for young people.
The manufacturing sector tells a similar story. Young people have been a shrinking share of the sector’s workforce for decades: over our full sample it is the single largest source of that within-industry erosion. The current slowdown, sharpened by trade uncertainty and U.S. tariffs, may be giving that decline a fresh push, but the trend long predates it.
Not every structural shift has worked against young workers. Youth representation has increased in transportation and warehousing, consistent with the expansion of e-commerce. Gains have also been evident in information, culture and recreation, construction, and several services industries, suggesting that while some traditional entry points have narrowed, others have emerged.
A handful of other industries have also seen their youth share decline, though to a lesser degree. Finance and insurance, real estate, and professional services are not traditional youth-job sectors, but they matter for young adults taking the first step onto the career ladder and have also seen their share of youth employment shrink.
The rise of artificial intelligence has often been mentioned as a primary culprit for reduced hiring of young people. Recent U.S. research does find that since the emergence of generative AI in 2022, employment has declined among early-career workers in AI-exposed occupations, such as software developers and customer service representatives, while employment among older workers in those same occupations remained relatively stable or continued to grow2.
Canadian data do not yet reflect a compelling case that AI’s impacts are being felt. Notably, the unemployment rate for the 15-19 cohort started separating itself from the economy at large prior to the pandemic (Chart 2). Moreover, other research suggests that the decline in early-career hiring preceded the emergence of AI and is closely linked to the rise of remote work, which has reduced the mentoring and on-the-job learning that traditionally brought junior employees up to speed, and enhanced the preference for more experienced employees3. AI may prove to be an additional headwind over time, but the evidence today points more broadly to a changing model of workplace organization having a large impact on entry-level jobs.
Labour Supply Reversing Past Increases
Labour demand tells part of the story, but it is only half of the equation. Labour supply also changed materially over this period. Strong population growth has substantially expanded the youth labour force. Data from the July Labour Force Survey show that compared to July 2023, Canada’s population aged 15–24 rose by roughly 360k, with the 20-24 group accounting for more than 60% of the increase. This rapid population growth expanded the pool of young people available to work, which in turn helped push the jobless rate higher.
Here again, however, the two age groups tell different stories. Relative to July 2023 there were 35k fewer teenagers (15–19) participating in the labour force, but the decrease was more than offset by 179k more young adults (20-24). This has happened against a backdrop of a steady labour force participation rate for 20-24 year olds, but a drop in participation for teenagers.
One worry may be that many teenagers dropped out because they can’t find work. The survey data provide a bit more insight into this dynamic. Of the 1,386k people aged 15-24 who were outside of the labour force in July, 9.6% (215k) said they wanted to work, up from the 9.4% in July 2023. The biggest driver of the increase was the share of respondents saying they didn’t look for work because they were discouraged. While that is worrisome, the average rate of discouraged workers increased to 1.7% in July 2026 (vs. 0.9% in July 2023) and amounts to roughly an additional 13k people. Even if all that increase were teenagers, it would explain only part of the 35k decline in their labour force. This suggests the reduction in labour force participation of teens is not attributed solely to weak labour market conditions and may reflect other factors as well.
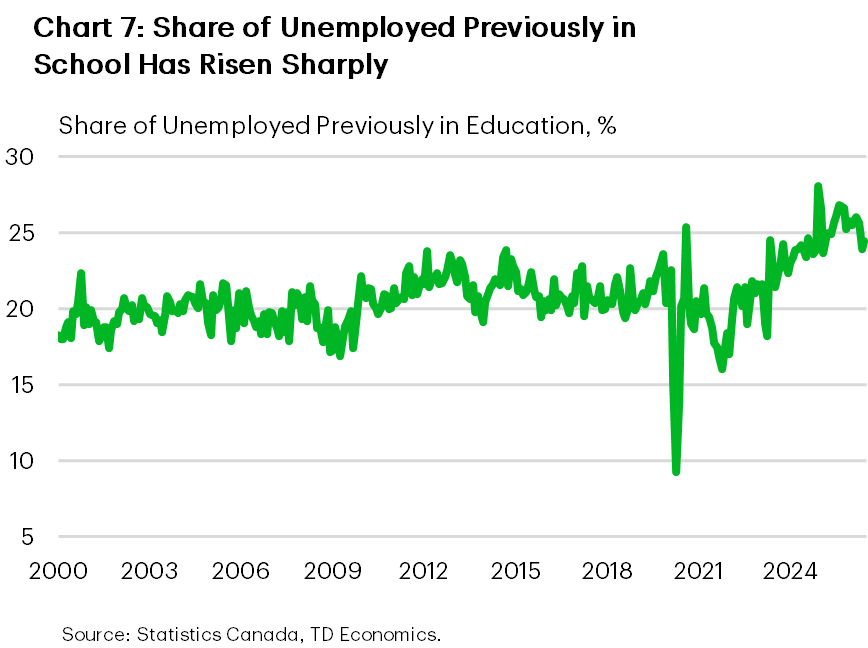
Much of the increase in 15-24 year old labour supply likely reflects transition from school into workforce. The share of unemployed who had previously been in school (rather than employed or discouraged) has risen sharply since 2023 (Chart 7). Given that the labour market has been able to absorb a consistent share of 20–24-year-olds, but disproportionately fewer 15–19-year-olds, it raises the prospect that underemployment among older youth could be crowding out the youngest workers.
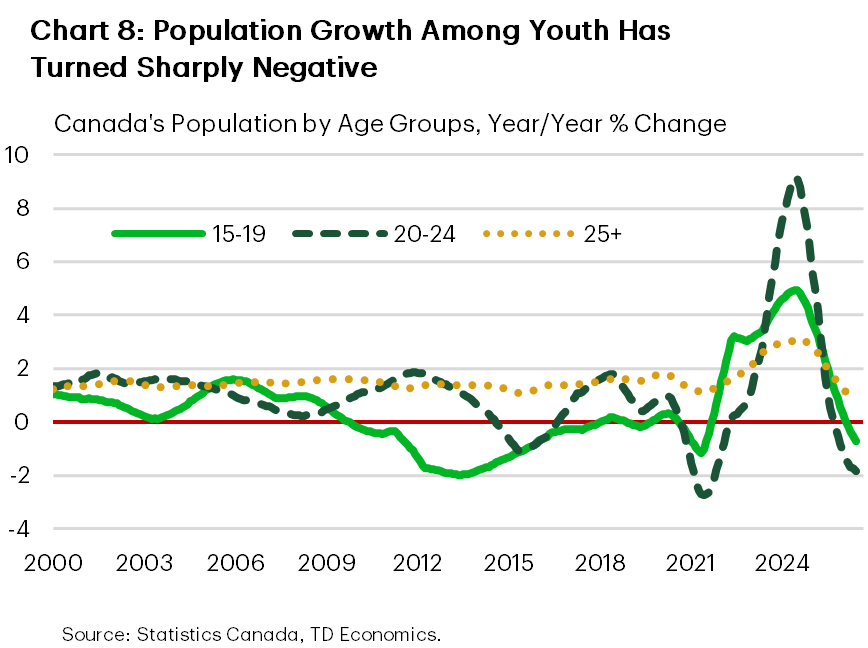
Looking ahead, one of the key assumptions underpinning a large part of our forecast is the expectation that the labour supply will stabilize. This is something we’re seeing now: as population growth for young people has turned sharply negative (Chart 8). This is expected to further remove available workers from the labour pool, putting downward pressure on the unemployment rate.
Bottom Line
Canada’s rise in youth unemployment is largely in line with what would be expected given the state of the labour market for older workers, with the deterioration hitting the youngest workers hardest. Importantly, both the large rise in labour supply and softer labour demand worked together to worsen conditions. Nonetheless, as we have seen in recent months, slowing labour force growth and a gradual economic recovery should work to unwind the increase in youth unemployment.
Not all of it fits a perfect story. Teenagers continue to underperform the historical relationship with the broader labour market, and some of the industries that have traditionally provided first jobs appear to be offering fewer entry points than before. Moreover, artificial intelligence’s future impacts on the demand for entry-level work remain an unknown. Canadian data do not yet reflect a compelling case that its impacts are being felt, but coupled with the rise of remote work, it may yet another headwind for young people in the labour market in the years ahead.
End Notes
- Model-implied unemployment rates are estimated using the historical relationship between non-overlapping six-month changes in unemployment for each youth cohort and those aged 25 and over. The models are estimated over a pre-pandemic sample, with out-of-sample estimates generated using the observed unemployment rate for the 25+ cohort.
- Brynjolfsson, Erik, Bharat Chandar, and Ruyu Chen. “Canaries in the Coal Mine? Six Facts about the Recent Employment Effects of Artificial Intelligence.” Stanford Digital Economy Lab, November 2025.
- See Lambert, P. J., & Schindler, Y. (2026), The Broken Ladder: AI, Remote Work, and Early-Career Hiring, SSRN Working Paper No. 6787638. or Emanuel, N., Harrington, E., & Pallais, A. (2026). Remote Work Leaves Younger Workers Sidelined. Liberty Street Economics, Federal Reserve Bank of New York, June 1, 2026.
Disclaimer
This report is provided by TD Economics. It is for informational and educational purposes only as of the date of writing, and may not be appropriate for other purposes. The views and opinions expressed may change at any time based on market or other conditions and may not come to pass. This material is not intended to be relied upon as investment advice or recommendations, does not constitute a solicitation to buy or sell securities and should not be considered specific legal, investment or tax advice. The report does not provide material information about the business and affairs of TD Bank Group and the members of TD Economics are not spokespersons for TD Bank Group with respect to its business and affairs. The information contained in this report has been drawn from sources believed to be reliable, but is not guaranteed to be accurate or complete. This report contains economic analysis and views, including about future economic and financial markets performance. These are based on certain assumptions and other factors, and are subject to inherent risks and uncertainties. The actual outcome may be materially different. The Toronto-Dominion Bank and its affiliates and related entities that comprise the TD Bank Group are not liable for any errors or omissions in the information, analysis or views contained in this report, or for any loss or damage suffered.
Download
Share: