Highlights
- AI adoption within U.S. labour markets is broader than in Canada, though the lack of a global standardized definition complicates cross-border comparisons.
- Canadian employment in occupations at higher risk of AI displacement is more resilient, but both nations are exhibiting steady job creation in roles complementary to AI usage.
- The normalization of Canada’s labour demand is more a function of cyclical factors rather than AI, although some AI related productivity relationships are loosely emerging.
- Youth wages in AI-complementary roles in the U.S. and Canada are growing at a faster pace than other roles in the labour market. These include industries such as healthcare, real estate, and professional occupations in applied sciences.
The rapid advancement of artificial intelligence (AI), particularly since the introduction of generative AI tools in late 2022, has sparked intense debate about its impact on labour markets. AI adoption is a double-edged sword – fuelling both concerns about job displacement and optimism about productivity gains. But the actual effects on employment, wages, and workforce dynamics are complex and evolving.
As a global leader in AI corporate adoption, investment, and research, the U.S. is showing early signs of labour market shifts. Employment is growing at a slower pace in industries where AI usage has ramped up, especially where job displacement risk is higher in technology, finance and professional roles. AI is also starting to shape higher wage outcomes for high-skilled workers, while demanding new skill sets from new graduates. This report sets out to examine whether Canada’s labour market is exhibiting the same trends, drawing on recent empirical research, industry surveys, and comparative analysis.
Canadian AI Adoption Lags the U.S. – With Some Caveats
It is important to lead the discussion with one point: the term “AI adoption” does not have a universally accepted definition. This inherently presents challenges when comparing data on AI utilization between Canada and the U.S. For example, surveys often employ varying criteria for what constitutes AI and measure its use differently. Additionally, differences in survey design, as well as variations in firm sizes and industry compositions, can influence reported outcomes related to AI adoption.
With that said, the most consistent and comparable estimates place Canada behind the U.S. in both breadth and depth of AI integration. An aggregation of recent data suggests that up to 60-80% of U.S. companies now use AI1 in some capacity compared with the lower rates reported, on average, in Canada. Despite lagging the U.S., Canada stacks up well on the global scale, ranking in the top 15 according to recent studies that aim to establish a one-size-fits all approach to AI adoption2,3.
Industry AI Use and Employment Trends Are More Pronounced in the U.S.
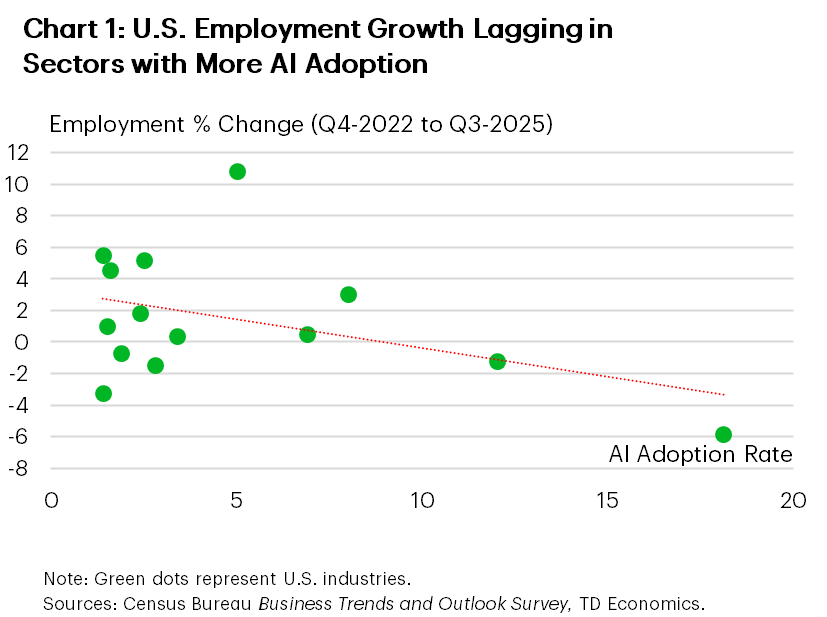
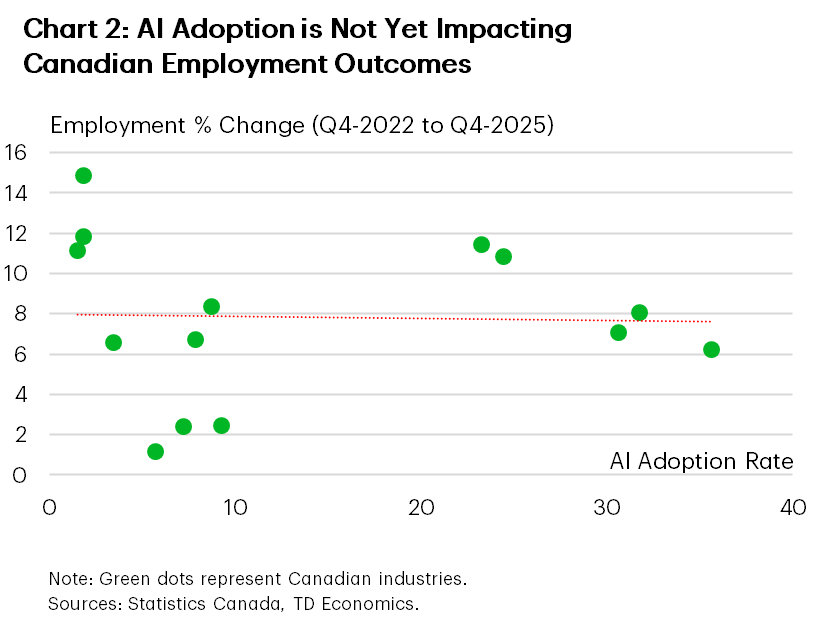
In our best attempt to avoid mismeasurement of AI adoption rates by industry, we leverage specific U.S. and Canadian surveys4,5 that similarly qualify AI adoption as the percent of businesses reporting to have used AI to produce goods or deliver services over the past 12 months. We find consistencies across both countries in the industries with the highest AI adoption rates: information and culture, professional/scientific/technical services, finance and insurance, real estate, and health care. Similarly, the data show that the accommodation and food, forestry, and transportation and warehousing sectors are lagging in AI adoption in both the U.S. and Canada.
How this translates into employment outcomes is becoming more measurable in the U.S. The impacts are modest, but a negative correlation south of the border shows industries with higher AI adoption rates are seeing worse employment outcomes since early-2023 (Chart 1). This relationship is so far absent in Canada (Chart 2).
AI Adoption vs AI Exposure
The terms AI adoption and AI exposure are related, with the latter being a broader term for its influence across the labour market. We are particularly interested in the industries and occupations which are highly exposed to AI and whether these areas are likely to see job displacement or transformation based on its capacity to replace or augment certain positions. We leverage AI exposure qualifiers from Statistics Canada6, which is often used a basis for analysis in Canada. It classifies occupations and industries based on their exposure to AI and the degree to which it compliments work functions7.
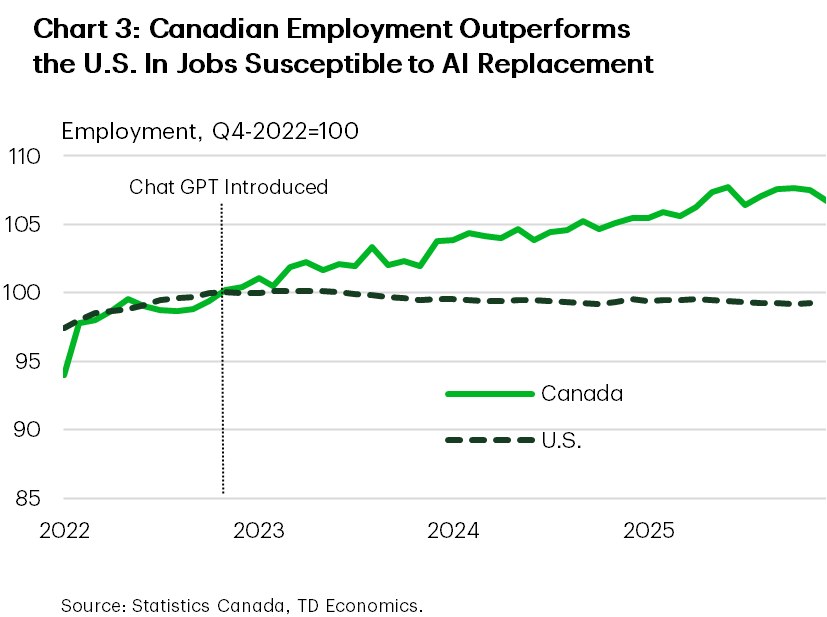
Starting with employment in highly AI-exposed sectors with low-complementarity, which is where AI is likely to replace jobs. These workers have fared much better in Canada than in the U.S. since late-2022 (Chart 3). U.S. employment has seen virtually no growth, led by information and professional services, versus Canada showing fewer signs of job displacement.
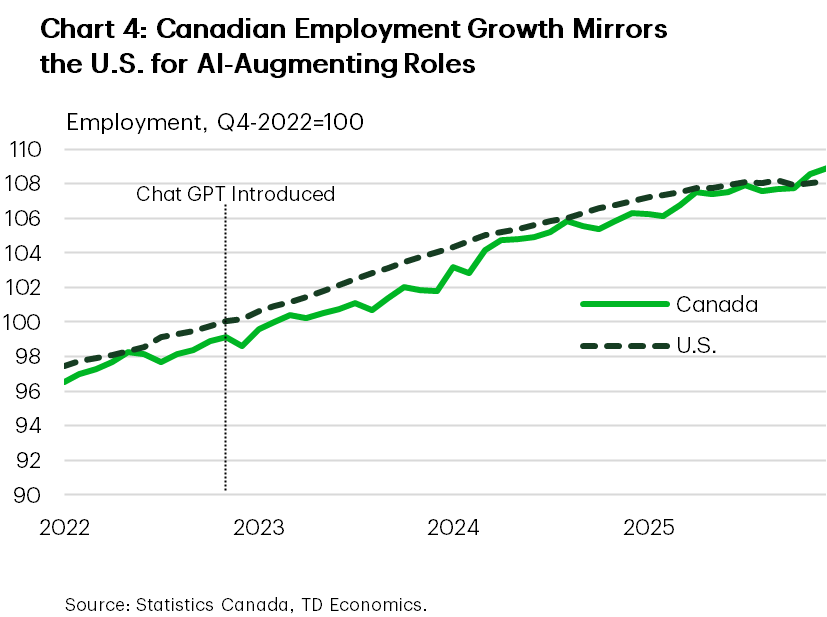
The narrative converges for AI-exposed occupations that are highly complementary with AI. In both the U.S. and Canada, aggregate employment growth in occupations such as engineering, physical and life sciences professionals, and professional occupations in education, law, and nursing, has remained robust (Chart 4). These roles tend to be higher paid and require advanced education.
Canada’s Labour Markets and the Business Cycle
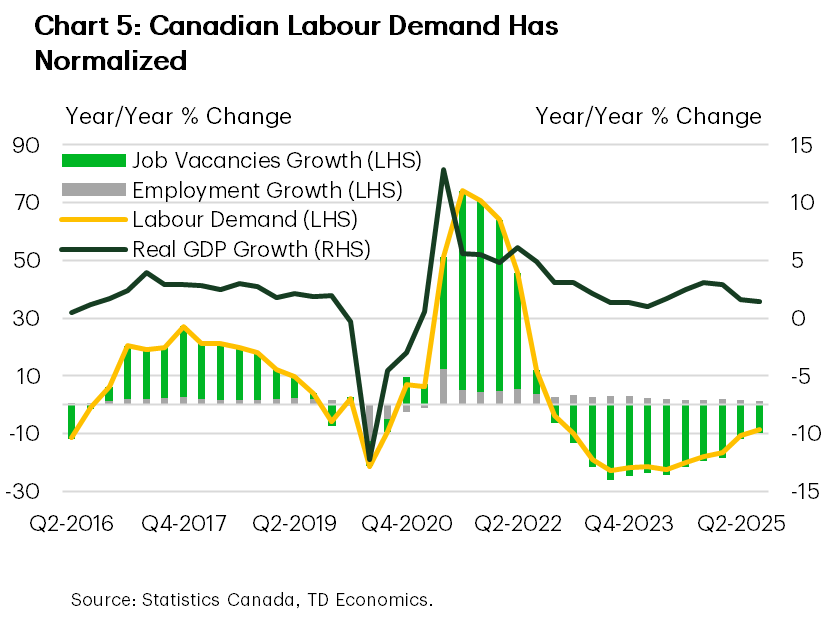
Even though Canadian employment in AI-exposed sectors is more resilient than the U.S., the broader labour market has still cooled over the past couple of years. This reflects a normalization in labour demand following the pandemic recovery, when Canadian companies chose to hoard labour amid hiring difficulties. The unemployment rate has risen by roughly 1.5 percentage points over the last two years, driven by reduced hiring activity and normalizing job vacancies (Chart 5). Across all industries, whether AI-exposed or otherwise, employment and GDP growth are falling in tandem, suggesting that cyclical factors are the primary drivers of current trends.
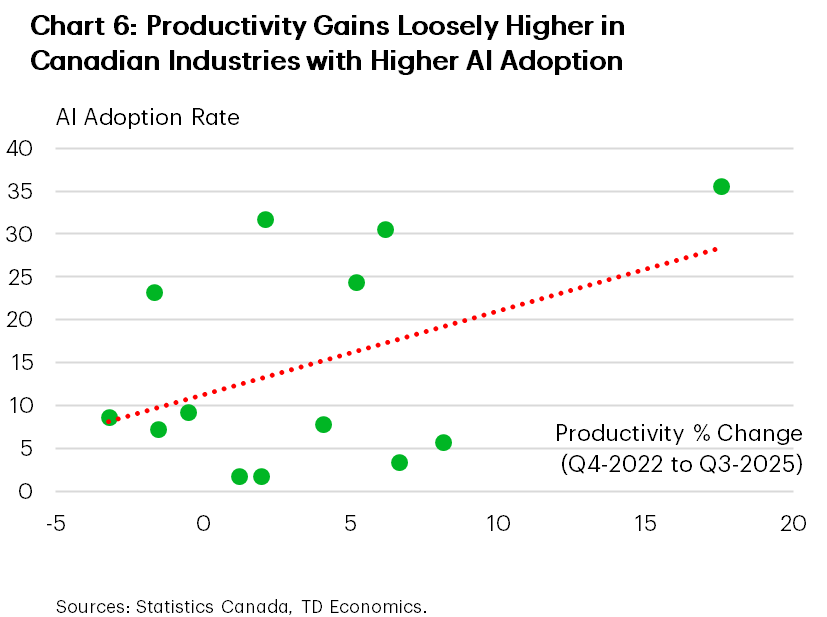
There is some, albeit limited, evidence that AI may be influencing Canadian productivity similar to American trends. Recent studies show that AI is credited with helping the U.S. economy avoid a deeper slowdown and its adoption correlates with higher productivity growth across tech, finance and data-intensive sectors8. Chart 6 shows that in Canada, productivity is higher in industries that are likewise higher in adoption rates, though the relationship is tenuous. Given Canada’s lagging productivity growth over the past several years, AI presents one of the more substantial levers to shrink the productivity gap with other G7 countries.
Uncovering AI Wage Trends
The impact of AI on wages is nuanced and varies by sector, job type, and skill level. In the U.S., entry-level wages in highly AI-exposed roles are facing downward pressure, as it automates many routine tasks traditionally performed by younger workers. Conversely, young workers with AI skills can command higher wages. Overall, high-complementarity jobs — where AI augments human work — are commanding significantly higher wages and are experiencing more robust wage growth9.
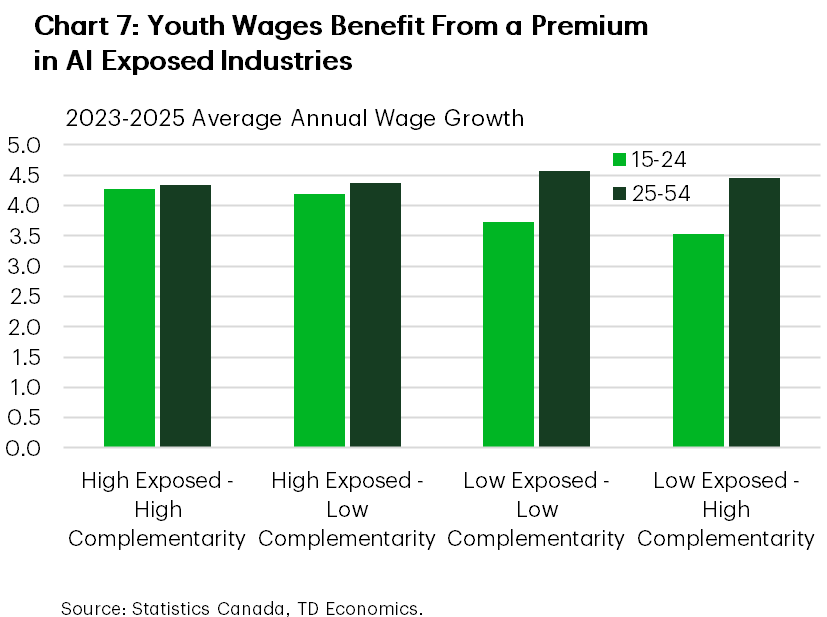
In Canada’s case, we’re finding some similarities. Wages for youth workers (aged 15–24) in AI-complementing industries have grown at a faster pace, on average, than ones with lower AI-exposure over the last few years (Chart 7). This wage deviation does not occur for core-aged workers (aged 25- 54), suggesting a wage premium potentially exists for younger workers with AI skills. The data also suggests that, so far, youth are not at a comparative disadvantage to core-aged workers in highly AI-exposed sectors. Looking ahead, overall economic conditions are still expected to be the primary governor of wage dynamics in Canada. AI-specific wage effects are likely to take longer to materialize in Canada due to slower broad adoption rates.
Education Matters
Both the U.S. and Canada are seeing higher unemployment pressures for recent graduates. In the U.S., AI is more directly correlated with declines in entry-level hiring and graduate employment in exposed sectors. A Stanford report found that AI-driven automation has caused a 13% drop in entry-level jobs since 2022, disproportionately impacting young workers aged 22–25.
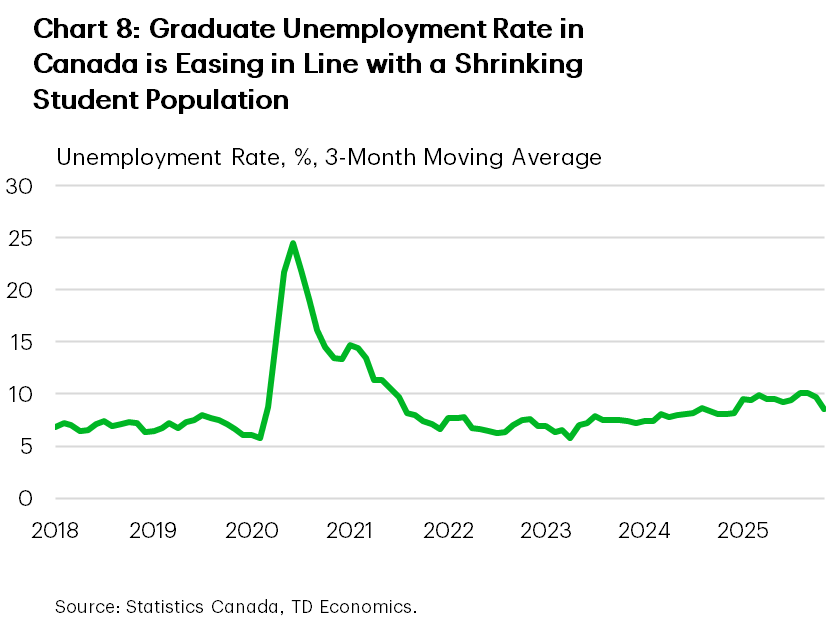
In Canada, we don’t find direct evidence of the same. Indeed, the unemployment rate for recent graduates – defined as those 18-24 with university degree or postsecondary certificate or diploma – had recently risen to 4-year highs. But this is more directly attributed to the rapid increases in the labour force as the student population ballooned. The graduate unemployment rate is now moderating in line with the drastic reduction in student base (Chart 8), suggesting that immigration and demographics remain the primary drivers of jobless rates for new graduates. Instead, AI in Canada is reshaping graduate hiring through increasing demand for related skills. Canadian universities are adapting by emphasizing critical thinking and preparing students to work alongside AI, focusing on skills that technology cannot easily replicate.
Bottom Line
AI doesn’t appear to be a dominant force in shaping Canada’s labour market, but its influence continues to grow. The U.S. offers a glimpse of the future as the rate of adoption expands in Canada. AI is no different than other technological leaps of the past, it will offer both opportunities and challenges. It’s only a question of whether the nation can work toward making the transition more transformative than destructive . The trajectory of AI’s impact remains uncertain, but proactive adaptation will be key to ensuring that Canadian workers can thrive in the evolving labour market.
End Notes
- Arledge, R. (2025, September 15). Census Bureau’s 2023 Annual business survey provides insight into technology adoption by businesses. Census.gov. https://www.census.gov/library/stories/2025/09/technology-impact.html
- Li, M. (2025, December 17). Top 10 countries with highest AI adoption rates in 2026. Second Talent. https://www.secondtalent.com/resources/top-countries-with-highest-ai-adoption-rates/
- The ai engagement index: Countries leading the AI adoption in 2025. ApX Machine Learning. (n.d.). https://apxml.com/posts/ai-engagement-index-country-rankings
- Bryan, V., Sood, S., & Johnston, C. (2025, June 16). Analysis on artificial intelligence use by businesses in Canada, second quarter of 2025. https://www150.statcan.gc.ca/n1/pub/11-621-m/11-621-m2025008-eng.htm
- Bryan, V., Sood, S., & Johnston, C. (2025b, September 11). Analysis on expected use of artificial intelligence by businesses in Canada, third quarter of 2025. https://www150.statcan.gc.ca/n1/pub/11-621-m/11-621-m2025011-eng.htm
- Mehdi, T., & Frenette, M. (2024, September 25). Exposure to artificial intelligence in Canadian jobs: Experimental estimates. https://www150.statcan.gc.ca/n1/pub/36-28-0001/2024009/article/00004-eng.htm
- The report introduces a framework dividing jobs into four quadrants: High-Exposure, High-Complementarity (HE-HC): Jobs like engineering and healthcare, where AI assists and augments complex, cognitive tasks. These roles tend to be higher paid and require advanced education. High-Exposure, Low-Complementarity (HE-LC): Roles such as administrative assistants and data entry, where AI is more likely to automate routine digital tasks. These jobs are at greater risk of disruption and tend to offer lower wages. Low-Exposure, High-Complementarity (LE-HC): Jobs with limited direct AI exposure but where AI could assist, such as nursing. Low-Exposure, Low-Complementarity (LE-LC): Roles with little AI interaction and high potential for automation, like some factory work.
- Bick, A., Blandin, A., & Deming, D. (2026, January 5). The impact of Generative AI on work productivity. Federal Reserve Bank of St. Louis. https://www.stlouisfed.org/on-the-economy/2025/feb/impact-generative-ai-work-productivity
- Dodson, R. (2025, November 13). The Ai Readiness Report: Which Industries are falling behind?. Nexford University. https://www.nexford.edu/research/ai-readiness-report
Disclaimer
This report is provided by TD Economics. It is for informational and educational purposes only as of the date of writing, and may not be appropriate for other purposes. The views and opinions expressed may change at any time based on market or other conditions and may not come to pass. This material is not intended to be relied upon as investment advice or recommendations, does not constitute a solicitation to buy or sell securities and should not be considered specific legal, investment or tax advice. The report does not provide material information about the business and affairs of TD Bank Group and the members of TD Economics are not spokespersons for TD Bank Group with respect to its business and affairs. The information contained in this report has been drawn from sources believed to be reliable, but is not guaranteed to be accurate or complete. This report contains economic analysis and views, including about future economic and financial markets performance. These are based on certain assumptions and other factors, and are subject to inherent risks and uncertainties. The actual outcome may be materially different. The Toronto-Dominion Bank and its affiliates and related entities that comprise the TD Bank Group are not liable for any errors or omissions in the information, analysis or views contained in this report, or for any loss or damage suffered.
Download
Share: