U.S. Presidential Elections and Stock Markets: It’s the Economy…Obviously
James Orlando, CFA, Director & Senior Economist | 416-413-3180
Tarek Attia, Research Analyst
Date Published: October 15, 2024
- Category:
- Canada
- Financial Markets
Highlights
- Stock market performance has historically been stronger under Democratic Presidents, but this may be due to the state of the business cycle at the time of election rather than the party’s inherent influence.
- Democrats have been fortunate to be elected during the early stages of the economic cycle much more often than Republicans, contributing to stronger stock market returns during their Presidential terms.
- The current state of the economic cycle could have a greater impact on market performance than the election outcome. If the Federal Reserve manages a soft landing, the economic cycle would be extended, allowing markets to benefit from mid-cycle momentum, but a hard landing could lead to significant market weakness.
The U.S. Presidential election is just weeks away and investors are quickly turning their attention to the potential implications for financial markets. Would a Trump or Harris win be better for the stock market? Historical election cycles have generated a lot of debate on the impact of which political party is better for investors. While we find that Democrats have a historical edge when it comes to stock market performance, this is more reflective of the state of the economy when they take office, rather than the party itself being a key factor.
Historical Market Performance: Democrats versus Republicans
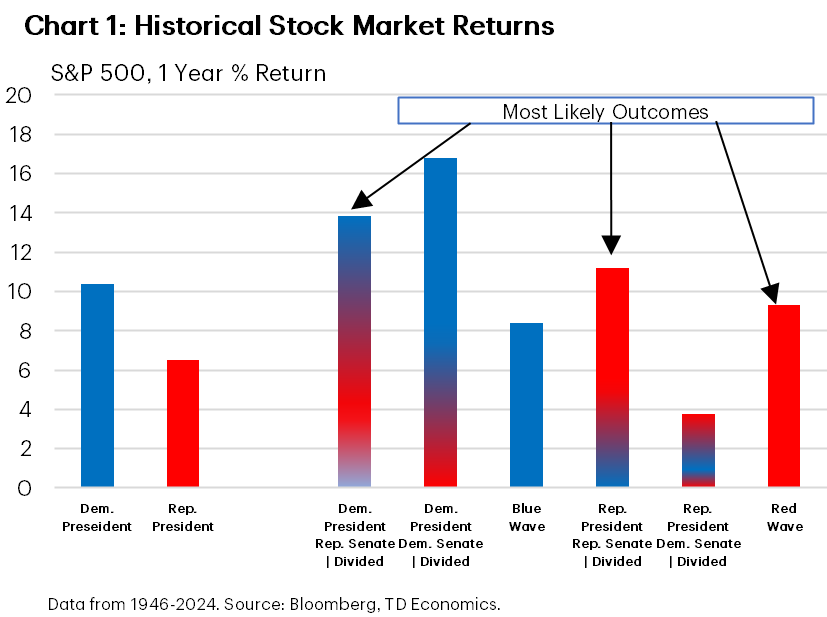
A lot has been made about how the stock market generally performs better when Democrats are in power. This plays out in the data, with a one year return post-election more than double that for Republicans (Chart 1). From Barack Obama’s Presidency following the Global Financial Crisis to Bill Clinton’s lead during the Great Moderation, the stock market gained significantly under various Democratic Presidents. This shouldn’t discount the Republicans, as the stock market performed extremely well under Donald Trump and Dwight Eisenhower, but market performance under George W. Bush and Richard Nixon, pulled down the average.
While the above would imply that a Harris win would be better for markets, the answer isn’t so simple. When we consider the composition of Congress, we find that when the House and Senate are divided (with Republican’s leading the House), the relative stock market performance for Democrats is diminished significantly. Importantly, having a divided Congress appears to have a more positive impact on stock market performance than in the event of a Blue or Red Wave overtaking the Oval Office, House, and Senate. This goes to the ‘do no harm’ principle, where a divided Congress puts limits on a President’s agenda, reducing fiscal and political uncertainty. Current polling suggests that the most likely outcomes in November will be a Trump Red Wave or a split Congress under Trump or Harris. This could result in strong equity market gains under any of the most likely outcomes.
Timing Matters: It’s About the Economy
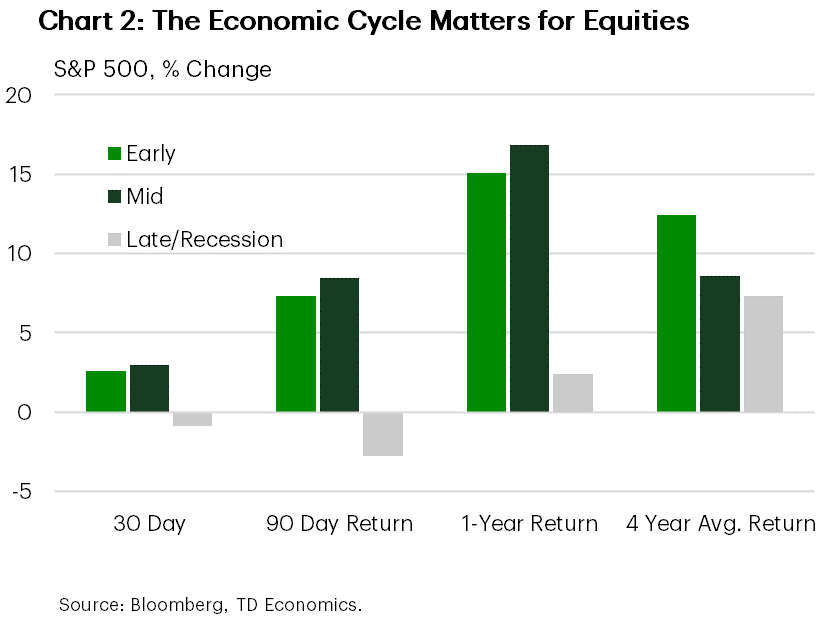
Leave it to the economists to ask, doesn’t the state of the economy matter? And of course, it does. Presidential elections can happen at various times in the economic cycle. You could have a President elected right in the middle of the Digital Revolution like Bill Clinton during the 1990s. Or you could have the misfortune of being elected at the end of the business cycle like George W. Bush in 2000. Timing matters, and sometimes the President has little influence over the direction of markets. We find that being elected during the early- or mid-stages of an economic expansion matters tremendously for equity market performance. The average S&P 500 return is significantly positive 30, 90, and 365-days post-election (Chart 2). But if it is late cycle, the opposite is true. The point is that a weak start to a Presidency carries through the full four-year term, where stock market returns typically underperform.
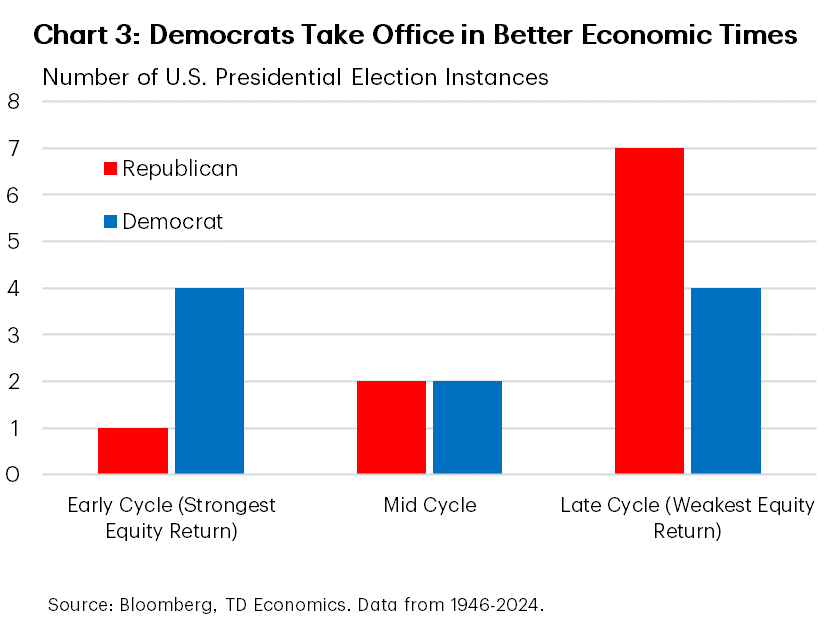
But then why is the historical stock market average return so much higher for Democratic Presidents then Republican Presidents? This comes down to the fact that Democrats had the fortune of being elected in the early stages of the economic cycle on four occasions versus just once for Republicans (Chart 3). On the other hand, Republicans were elected at the late stage of the economic cycle much more often. Certainly, this could be indicative of the mood of voters wanting a change of leadership based on where we are in the economic cycle. Wanting a new political party to take the Oval Office when the economy is at risk of recession may be the driving force here.
For Election 2024, determining where we are in the economic cycle may matter much more than who is elected. While many would assume that the economy is in the late innings of the business cycle, this will depend on whether the Federal Reserve is successful in achieving a soft landing. If it is, the economic cycle would be extended, similarly to what happened in the mid-1990s. That would mean the current election would be categorized as mid-cycle, potentially resulting in several years of strong equity market returns. But if the Fed is unsuccessful and a hard landing ensues, that would mean the current election would be labeled as late-cycle. This could foretell weak equity market returns for whoever takes over the Oval Office come January.
Disclaimer
This report is provided by TD Economics. It is for informational and educational purposes only as of the date of writing, and may not be appropriate for other purposes. The views and opinions expressed may change at any time based on market or other conditions and may not come to pass. This material is not intended to be relied upon as investment advice or recommendations, does not constitute a solicitation to buy or sell securities and should not be considered specific legal, investment or tax advice. The report does not provide material information about the business and affairs of TD Bank Group and the members of TD Economics are not spokespersons for TD Bank Group with respect to its business and affairs. The information contained in this report has been drawn from sources believed to be reliable, but is not guaranteed to be accurate or complete. This report contains economic analysis and views, including about future economic and financial markets performance. These are based on certain assumptions and other factors, and are subject to inherent risks and uncertainties. The actual outcome may be materially different. The Toronto-Dominion Bank and its affiliates and related entities that comprise the TD Bank Group are not liable for any errors or omissions in the information, analysis or views contained in this report, or for any loss or damage suffered.
Download
Share: