Canadian Housing Outlook:
Testing the Foundation
Rishi Sondhi, Economist | August 29, 2022
Date Published: August 29, 2022
- Category:
- Canada
- Real Estate
This report is a Q&A on the outlook for housing markets across Canada. In it, we detail what's happened so far and our expectations for Canadian and regional activity, both in the near and longer-term. We also articulate factors that might help to lessen the extent of adjustment and address the major risks to our outlook.
- Question 1: It's well known that Canadian housing markets are softening as borrowing costs have jumped.
How do we judge the depth of the correction so far? - Question 2: How deep will the correction be and how long will it last?
- Question 3: Why a "recalibration" and nothing worse?
- Question 4: What is your longer-term view of the market?
- Question 5: What about housing's impact on the overall economy?
- Question 6: What are the risks or special considerations for your outlook?
Questions and Answers
Question 1: It's well known that Canadian housing markets are softening as borrowing costs have jumped. How do we judge the depth of the correction so far?
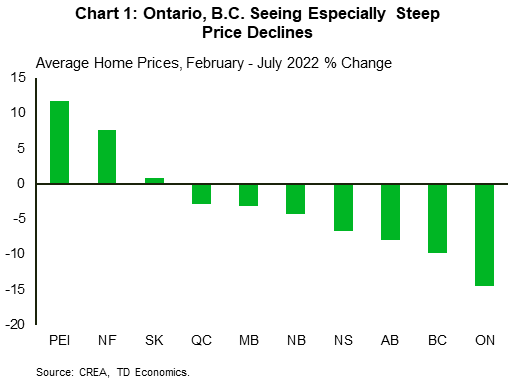
In the second quarter, Canadian home sales declined by 20% on a quarter-on-quarter basis, while national average home prices dropped by 9%. And, national sales and prices took another leg down in July. However, peeling away the headline reveals a more nuanced regional story (Chart 1):
- Home prices have fallen by the most in Ontario and B.C. – two markets which saw rapid affordability deteriorations during the pandemic. What's more, elevated investor demand in Ontario left it more vulnerable to a correction.
- Prices have also fallen at a relatively steep clip in Alberta, although sales levels are still quite healthy and markets are comparatively tight, so conditions look solid compared to B.C. and Ontario. Elsewhere, Quebec also saw a meaningful deterioration in affordability in the pandemic. As such, the moderation in price growth so far suggests that the correction in prices still has legs.
- The story is different elsewhere in the country. In the rest of the Prairies and the Atlantic Region, prices are holding up better. The former has been supported by some of the best affordability conditions in the country, while the latter region is drawing support from robust population growth and relatively tight conditions.
- These differing dynamics capture a partial unwinding of buyer behaviour during the pandemic. Remote work and the desire for larger living spaces prompted buyers to bypass larger urban centres for nearby suburbs or exurbs. Some chose to locate even further away (while some left their home province all together). These behavioural shifts caused a shock wave to price growth in markets further afield to the larger centres within B.C. and Ontario, that is now deflating faster than in the major markets.
- To have this dynamic occur simultaneously across large provinces is abnormal. In B.C., for example, this pattern of outsized adjustments in markets outside of the GVA has held true in prior housing downturns. However, this hasn't generally been the case in Ontario, as prices have typically corrected by more in the GTA than in other less-densely populated jurisdictions in the province.
Relatedly, benchmark prices (which are a less volatile measure than average home prices) for single-detached homes have dropped 7% since February, while condo prices have held up better. This reflects the steeper erosion in affordability for detached units during the pandemic. It is also similar to the 2017-2019 experience, where a host of macroprudential measures (i.e., Ontario's Fair Housing Plan, B-20) and rising interest rates cooled detached markets following their steep affordability deterioration, while condo prices increased.
Unlike the 2017-2019 period, we think that condo prices will drop in coming months although likely not the same extent (or perhaps duration) as their single-detached counterparts. To this point, we've already seen some softening as they've declined in 3 of the past 4 months. Note that condo affordability also worsened significantly during the pandemic. In addition, rising borrowing costs and falling prices could be weighing on investor demand for these units, as they are providing some counterbalance to rapidly rising rents.
Question 2: How deep will the correction be and how long will it last?
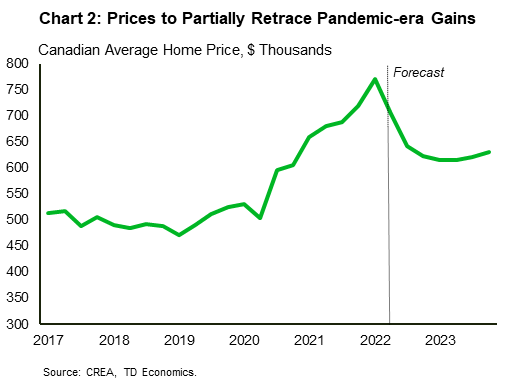
Canadian average home prices could fall 20-25% on a peak-to-trough basis from 2022Q1 – 2023Q1 (Chart 2), as sales crater by about 35% over the same period. Reflecting their affordability deteriorations (Chart 3), steeper declines are forecast in B.C and Ontario while more middle-of-the-road retrenchments are likely in Alberta, Quebec, and the Atlantic Region. Meanwhile, we expect prices to hold up better in Manitoba and Saskatchewan over this period.
Our forecasted decline in national home prices would only partially retrace the 46% runup over the course of the pandemic. As such, our forecast can be more aptly described as a recalibration of the market, instead of something more severe.

Note that our forecasted peak-to-trough decline in Note Note that our forecasted peak-to-trough decline in Canadian home sales falls well within the range seen in past housing downturns and was surpassed by the Global Financial Crisis, where sales tumbled by 38%. Our projected price drop represents an unprecedented decline (at least from the late 80's onwards, when the data began). However, it follows an equally unprecedented runup during the pandemic.
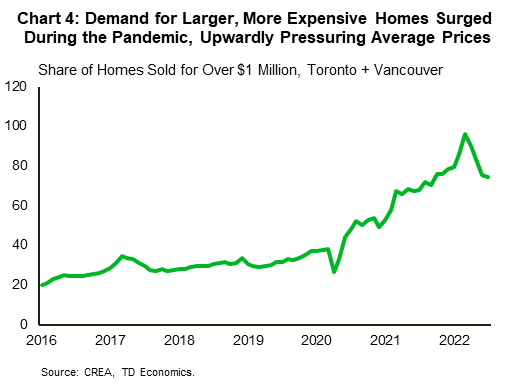
As previously noted, demand for larger, more expensive housing soared during the pandemic (Chart 4), which imparted even more upward pressure on average home prices. Because of how they're calculated, average home prices are disproportionately impacted by transactions that take place at the upper (or lower) end of the price spectrum. This has now switched from being a tailwind to a headwind for average prices, as valuations for more expensive units (like detached housing) are unwinding at a relatively speedy pace.
Question 3: Why a "recalibration" and nothing worse?
We think there are some factors that will help cushion housing demand and prices:
- Firstly, following the fastest rate hike cycle in decades, we expect the Bank of Canada to pause its hiking campaign in the fourth quarter or, at least, move in much smaller increments thereafter. That would place the bulk of tightening in the policy rate behind us. Secondly, we expect 5-year bond yields
 (which underpin 5-year fixed mortgage rates) to dip next year as economic activity softens and inflation slows. And finally, it's important to keep in mind that mortgage qualification stress tests in Canada were explicitly designed to qualify buyers at much higher rates than what prevailed through most of the pandemic. This has added a layer of protection from rising rates for both borrowers and lenders that is lacking in many countries also experiencing an interest rate shock, like the United States.
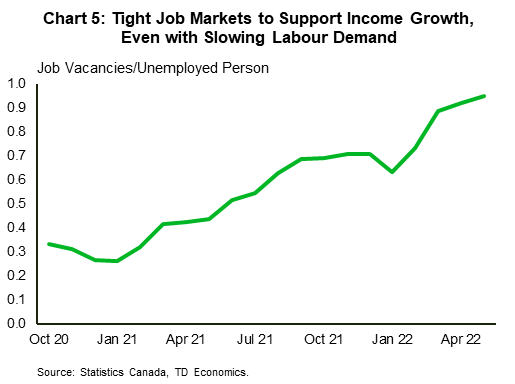
 - Our baseline forecast captures a soft-landing scenario where personal income continues to grow. Moreover, labour markets are currently extremely tight and some slowdown in labour demand could serve to restore balance (Chart 5).
- Canadian consumers have built a pool of excess savings, which looks to have increased in the first quarter on the back of robust growth in employee compensation. This is a key distinction from past cycles, even in the event of recession. The unusual pool of savings offers a longer lifeline to finance existing mortgages and down payments as lower prices entice buyers back.
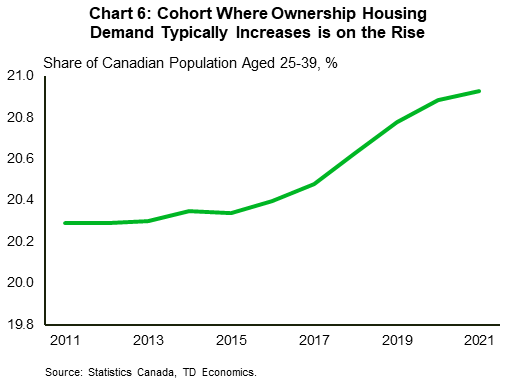
- Population and demographic factors are demand-supportive. Canadian population growth is robust, offering fundamental support to demand (particularly in the Atlantic Region), while the share of Canadians aging into cohorts where ownership housing demand typically increases is also on the rise (Chart 6).
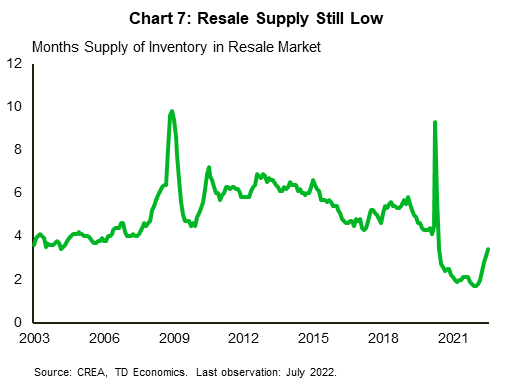
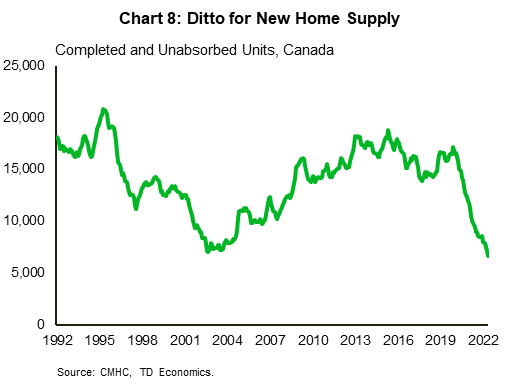
- Inventory levels in both the new and resale markets are low. Even as it's hooked higher recently, the months' supply of resale homes is still well below long-run norms, while the share of standing inventory in the new home market remains historically low (Charts 7 and 8). A large part of this is a consequence of the past cyclical strength in demand. However, structural factors, like an aging population (which tends to move less) and lengthening construction timelines continue to hold down supply.
Question 4: What is your longer-term view of the market?
Long-term, we're more positive on the outlook for housing. This has to do with our view that population growth should remain healthy, underpinning fundamental demand for housing. Note that the federal government is targeting 432k new permanent residents in Canada this year. Much of this quota is being filled by persons who are likely already in the country and are transitioning from non-permanent to permanent resident status. Data from Immigration, Refugees and Citizenship Canada indicates that in a typical year, these transitions account for about 25% of new permanent residents, although this figure is closer to 50% in 2022. However, if you net these people out, immigration this year is on track to match 2017's solid level, which was during Canada's most recent population boom.
Their targets for 2023 and 2024 are even more ambitious compared to 2022, as they are targeting some 450k new permanent residents in Canada in both years. Historically, the government has seen mixed results on this front, with the number of new permanent residents falling below target in some years and exceeding it in others.
After next year, we estimate that to just keep up with population growth (and other drivers of fundamental demand), Canada will require about 215-220k new units each year through 2028, which is somewhat above the country's pre-pandemic run-rate for starts. However, this is only part of the story. With interest rates rising and home prices likely to only partially retrace pandemic-era gains, affordability should remain strained over the next several years. So, the recovery stage of the cycle is likely to reflect a slower price growth trend than the past decade, where Canadian average home prices rose at annual average pace of 7%.
Question 5: What about housing's impact on the overall economy?
Our forecast anticipates that the housing downturn will shave from 1 – 1.5 ppts from GDP from 2022Q2 – 2023Q1 as residential investment declines and consumer spending is hit by falling home prices. This is a milder hit to growth than what took place during the Global Financial Crisis and the late-80s housing downturn. At the same time, it's more in line with what took place during the mid-90s and is more severe than the policy-induced decline in activity observed from 2017-2019. It also isn't enough, in our baseline forecast, to cause a contraction in overall GDP.
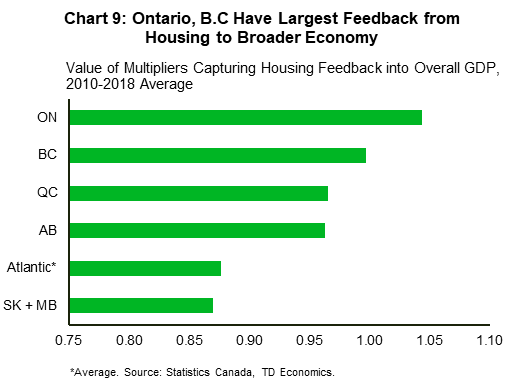
Regionally, the impacts of the housing downturn are likely going to be felt more in B.C. and Ontario. Housing should retrench the most in these two markets and their overall economies have historically been more sensitive to spillovers from housing (Chart 9). On the opposite end, there should be less spillover in Saskatchewan, Manitoba and the Atlantic Region as housing should hold up better, and the historical linkages between housing and the rest of the economy aren't as pronounced.
Question 6: What are the risks or special considerations for your outlook?
There are several:
- The largest downside risk stems from a steeper and/or more protracted economic slowdown than our baseline. Our prevailing base case assumes slightly positive growth and only a moderate increase in the unemployment rate from its current 4.9% level. This raises the prospect that the housing correction spills more broadly into the overall economy, exacerbating economic weakness and creating a negative feedback loop.
- In a recent report, we sketched out how a recession could play out in Canada (see here). The thought is that growth could slow more than anticipated in the second half of this year, before contracting mildly through much of 2023. Such a scenario would generate more upward pressure on unemployment rates with knock-on effects to housing demand. However, as long as the economic downturn was shallow, prices would probably keep some of their pandemic-era gains, especially as an economic contraction would eventually allow policymakers to lower interest rates if inflationary pressures likewise come down faster.
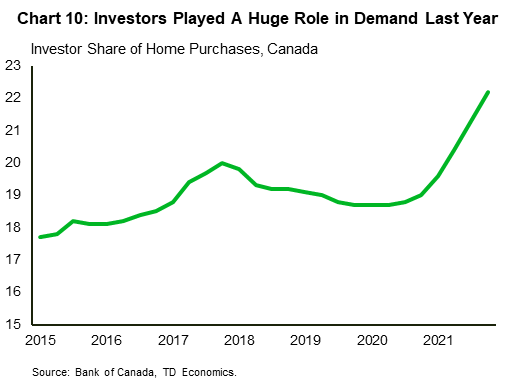
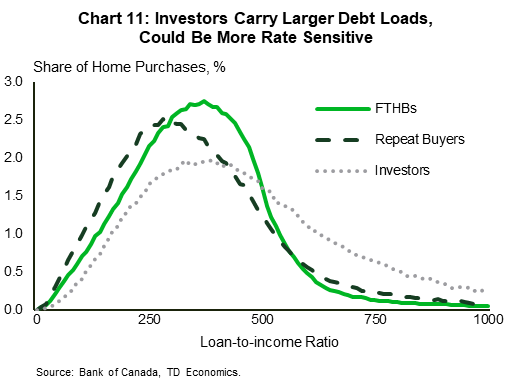
- Investors played an outsized role in housing demand in 2021, and likely through the early part of this year (Chart 10). However, some portion of the contraction we're seeing now is probably would-be investors remaining on the sidelines as housing cools, especially as these buyers are likely more interest-rate sensitive (Chart 11). It's possible that this source of demand sours more than anticipated.
- On the supply side, it's also possible that listings rise faster on the higher carrying costs. This would mean more supply and lower prices for a given level of demand, and could be especially true for investors, who tend to have higher loan-to-income ratios. The Bank of Canada estimates that only 2% of Canadian households have variable rate mortgages with variable payments (i.e.,homeowners that are immediately impacted by rising borrowing costs). However, this still amounts to around 300k households. Note that Canadian new listings have yet to break meaningfully higher since housing began its recalibration.
- It could also be logical to assume that economic weakness could cause a boost in supply as people lose their jobs and are forced to list their homes. However, note that new listings fell, on average, in the two recessions prior to the pandemic. In other words, a supply-side shock is less likely to unfold independently because as noted earlier, Canada's inventory of homes is not in excess to population dynamics. A demand-side shock would be the more likely culprit, thereby exacerbating supply due to a faster retreat in buyers relative to sellers.
- Federal government policies have mixed influences and are unlikely to sway housing outcomes too much. For instance, the foreign buying ban (set to start next January), is unlikely to hit demand too much, given the many cohorts that are exempt from it, and the fact that foreign buying taxes are already in place in B.C. and Ontario. In contrast, the anti-flipping tax on residential properties could have some impact on demand, although data gaps make any potential impact difficult to quantify. Meanwhile, the First Time Home Savings Account should support first-time homebuying demand, although it's capped at only 40K, while the Housing Accelerator Fund should boost supply, albeit with a lag. Moreover, the federal government's target of 100k new homes by 2024-25 through the Accelerator Fund is unlikely to move the needle too much on affordability.
Disclaimer
This report is provided by TD Economics. It is for informational and educational purposes only as of the date of writing, and may not be appropriate for other purposes. The views and opinions expressed may change at any time based on market or other conditions and may not come to pass. This material is not intended to be relied upon as investment advice or recommendations, does not constitute a solicitation to buy or sell securities and should not be considered specific legal, investment or tax advice. The report does not provide material information about the business and affairs of TD Bank Group and the members of TD Economics are not spokespersons for TD Bank Group with respect to its business and affairs. The information contained in this report has been drawn from sources believed to be reliable, but is not guaranteed to be accurate or complete. This report contains economic analysis and views, including about future economic and financial markets performance. These are based on certain assumptions and other factors, and are subject to inherent risks and uncertainties. The actual outcome may be materially different. The Toronto-Dominion Bank and its affiliates and related entities that comprise the TD Bank Group are not liable for any errors or omissions in the information, analysis or views contained in this report, or for any loss or damage suffered.
Download
Share: