
The Federal Reserve Chair Powell has repeatedly said that the U.S. economy is strong and can handle more rate hikes. Can it? The American consumer may beg to differ.
The third revision of a GDP report is usually a bore, but last week’s release of first quarter data was anything but. Revisions revealed a more hesitant consumer with a mark down of spending growth to 1.8% (annualized) from a previously reported 3.1%. This difference in underlying momentum is night and day, particularly considering that the first rate hike didn’t occur until the end of the quarter. It could be chalked up to the usual data volatility if not for a second quarter that is tracking even weaker, with spending growth ranging between 1.0% and 1.5%. This slowdown was fully expected in our baseline forecast, but it has happened earlier with data revisions revealing a softer underbelly. We hope this is just a “pull forward” of the dynamics of those expectations and not the beginning of a recession-mindset taking hold.
To some extent, household expenditures are being constrained by insufficient supply rather than an unwillingness to spend. Although spending on services has returned to pre-pandemic levels, large deficits remain within two categories that have struggled to hire sufficient staff to keep up with demand – recreation and transportation services. There’s a strong belief that pent-up demand exists within these categories, but as the saying goes…the cure for higher prices, is higher prices. Air transportation prices have risen at the fastest three-month annualized pace in history, while recreation is tracking a pace last seen in the 1990s. No surprise that the most recent Conference Board survey noted a softening in vacation plans as rising prices take their toll.
It’s now likely that the U.S. economy will have produced no growth in the first half of the year, and this could be a best-case scenario. A negative print is a real possibility. Softening consumer spending has left a thin cushion relative to the weight coming from contracting residential investment, government spending, and some areas of business investment. Two back-to-back quarterly contractions in real GDP would normally equate to the early markings of a recession, but not when almost 2.5 million jobs were created over the same period alongside a falling unemployment rate.
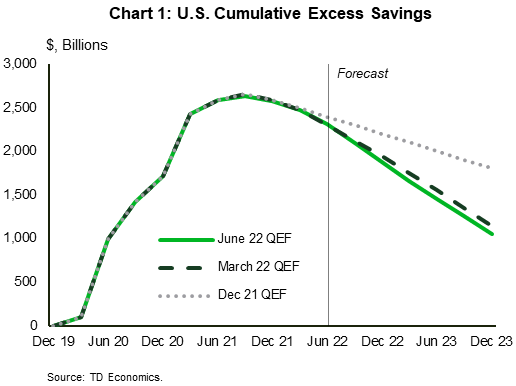
Facing an interest rate shock combined with an inflation shock, we hope that consumers will only sputter and not capitulate under the benefit of widespread job opportunities and a stronger financial position relative to pre-crisis. But we are mindful that some swift changes are afoot. The savings rate has already dropped below pre-pandemic levels and real after-tax incomes have been largely flat-to-negative since the start of this year. Although excess savings remain in place, this too is coming down faster than expected. We estimate that 60% (or almost $1.6 trillion) of excess saving will be spent by the end of 2023. This is almost $735 billion more than our forecast in December (Chart 1).
Since the drawdown hasn’t produced outsized consumption patterns, it must be the case that it’s increasingly being used to keep up with the necessities of life. In the consumer price basket, shelter, energy and food make up more than 50% of household expenditures. Prices as a share of these expenditures are rising at an aggregate pace of 6% relative to last year. Little near-term relief is expected in these three areas, particularly given the lagging nature of prices and related geopolitical supply risks. Recent developments of Russia cutting natural gas supply to major regions in Europe, alongside worries of a global oil supply crunch highlight this deepening risk environment and global economic weight.
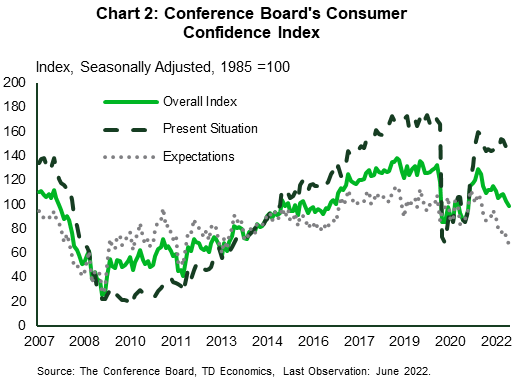
For a while, there were mixed messages coming from U.S. consumer sentiment. The Michigan sentiment index plunged to record lows in June, but it was at odds with a sturdier Conference Board measure. Here too, updated data brought a deterioration, with consumer expectations hitting a decade low (Chart 2). Since this measure tends to be more aligned to labor market conditions, it makes sense that sentiment of the present situation is holding higher and at more stable levels. For now, the job environment is worker-friendly with employer demand exceeding available supply. But sentiment on the present situation could face difficulty holding its current pattern. The direction of these two measures do not tend to deviate for a sustained period. Interestingly, it’s not until the ‘present’ sentiment index deteriorates that recessions tend to follow with a lag of about six months. And, it’s not the level of sentiment that matters, it’s the direction and the speed of change. So far, this indicator offers comfort that a recession is not an immediate threat but should be kept on the radar.
Developments have been consistent with our June forecast update, where we stressed that the U.S. economy would walk the line between modest growth and recession. Data revisions reveal that the economy has already hit stall-speed and now the only question is whether it can hold this pattern in the best-case scenario, or whether consumers will fully capitulate. Either way, the only way out of this cycle is for the economy to sustain a period of below-trend growth to cool inflationary pressures and give the central bank reason to pause on this aggressive interest rate cycle.
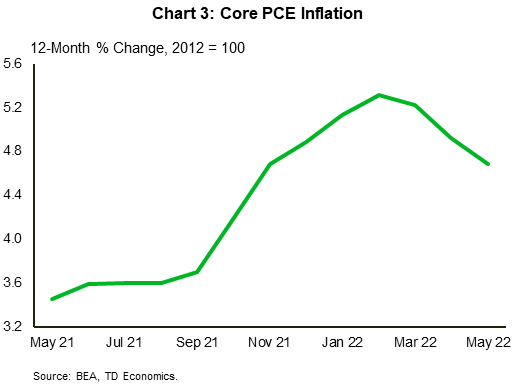
There was a glimmer of hope on this front last week. Amidst the disappointing consumer spending data, the Federal Reserve’s preferred inflation metric – core PCE — showed some signs of levelling off. Expanding at a rate of 0.3% for four consecutive months has allowed the annual rate to edge down to 4.7%. This might not seem like much, but the direction is favorable (Chart 3). Unfortunately, inflation is one of the most lagging economic indicators of the batch, and this development alone wouldn’t be enough to deter the Federal Reserve from another 50 to 75-basis point hike in July. It is also one reason why we believed markets got ahead of themselves a month ago by expecting a 3.6% fed funds rate by year-end. We stuck to a view that 3.25% would prove sufficiently restrictive, and even this may be toppish. The headwinds on the economy are already formidable. Aside from higher prices eroding household purchasing power, the interest rate shock has already collapsed residential investment into contraction territory. Private-sector investment is also showing signs of weakness, while government spending has been in retreat for two quarters. That means when it comes to domestic demand drivers — i.e. those largely within the influence of domestic policy — the only thing separating the economy from growth and recession is the consumer.
With the economy walking the line, we have formulated an alternate economic profile on how a U.S. recession might unfold. Although not our base case view at this time, it’s useful to consider the migration of the economy on further data disappointments given the high degree of global and domestic uncertainty. Based on Bloomberg Consensus, there are only a handful of forecasters officially embedding a recession as their baseline view. Of those, many place the occurrence into mid or late-2023. This typically follows the logic and theory that recessions occur within one-to-two years of peak interest rates. However, this might seem like a heroic assumption in this cycle given simultaneous shocks from inflation, interest rates and confidence. Even within a strong job market, consumer cautiousness is already upon us and leaves little margin for error. Should a recession unfold, the timing would likely be earlier. The favorable starting point on the job market and household finances should help mitigate depth, but might be less of a shield on duration. Inflation’s high starting point and lagging nature could lead to a longer period of “growth-sacrifice” by the central bank, constraining their ability to turn on the relief valve by easing monetary policy (Tables 1 and 2).
Table 1: Economic and Financial Baseline Forecasts Table 2: Recession Scenario Forecasts
| 2022 | 2023 | Ann. Avg. | 2022 | 2023 | Ann. Avg. | |||||||||||||||
| Q1 | Q2E | Q3F | Q4F | Q1F | Q2F | Q3F | Q4F | 22F | 23F | Q1 | Q2E | Q3F | Q4F | Q1F | Q2F | Q3F | Q4F | 22F | 23F | |
| Real GDP growth (%*) | ||||||||||||||||||||
| Canada | 3.1 | 3.8 | 2.7 | 1.6 | 1.3 | 1.0 | 1.1 | 1.4 | 3.6 | 1.6 | 3.1 | 3.8 | 1.6 | 1.0 | -0.6 | -1.4 | -0.1 | 1.0 | 3.4 | 0.2 |
| U.S. | -1.6 | 0.3 | 1.9 | 1.6 | 1.2 | 1.0 | 1.5 | 1.8 | 1.9 | 1.3 | -1.6 | 0.3 | 0.8 | -0.7 | -1.7 | -0.4 | 1.1 | 1.9 | 1.7 | -0.3 |
| Unemployment rate (%) | ||||||||||||||||||||
| Canada | 5.8 | 5.2 | 5.1 | 5.3 | 5.5 | 5.7 | 5.9 | 6.0 | 5.3 | 5.8 | 5.8 | 5.2 | 5.2 | 5.4 | 5.8 | 6.1 | 6.4 | 6.7 | 5.4 | 6.3 |
| U.S. | 3.8 | 3.6 | 3.5 | 3.6 | 3.7 | 3.9 | 4.1 | 4.2 | 3.6 | 4.0 | 3.8 | 3.6 | 3.6 | 3.9 | 4.2 | 4.5 | 4.9 | 5.1 | 3.7 | 4.7 |
| CANADA (rates, %) | ||||||||||||||||||||
| Overnight Target Rate | 0.50 | 1.50 | 3.00 | 3.25 | 3.25 | 3.25 | 3.25 | 3.25 | 2.05 | 3.25 | 0.50 | 1.50 | 3.00 | 3.00 | 3.00 | 2.75 | 2.25 | 1.75 | 1.95 | 2.45 |
| 3-mth T-Bill Rate | 0.60 | 2.08 | 3.13 | 3.25 | 3.25 | 3.25 | 3.25 | 3.25 | 2.25 | 3.25 | 0.60 | 2.08 | 2.75 | 3.00 | 2.80 | 2.45 | 2.10 | 1.85 | 1.90 | 2.30 |
| 2-yr Govt. Bond Yield | 2.27 | 3.10 | 3.40 | 3.50 | 3.45 | 3.30 | 3.20 | 3.05 | 3.05 | 3.25 | 2.27 | 3.10 | 2.55 | 2.40 | 2.40 | 2.30 | 2.15 | 2.00 | 2.65 | 2.20 |
| 10-yr Govt. Bond Yield | 2.40 | 3.23 | 3.60 | 3.65 | 3.60 | 3.55 | 3.45 | 3.35 | 3.20 | 3.50 | 2.40 | 3.23 | 2.50 | 2.35 | 2.40 | 2.30 | 2.25 | 2.20 | 2.70 | 2.30 |
| U.S. (rates, %) | ||||||||||||||||||||
| Fed Funds Target Rate | 0.50 | 1.75 | 3.00 | 3.25 | 3.25 | 3.25 | 3.25 | 3.25 | 2.15 | 3.25 | 0.50 | 1.75 | 3.00 | 3.00 | 3.00 | 2.50 | 2.00 | 2.00 | 2.05 | 2.40 |
| 3-mth T-Bill Rate | 0.52 | 1.72 | 3.00 | 3.15 | 3.15 | 3.15 | 3.15 | 3.15 | 2.10 | 3.15 | 0.52 | 1.72 | 2.90 | 2.90 | 2.65 | 2.15 | 1.90 | 1.90 | 2.00 | 2.15 |
| 2-yr Govt. Bond Yield | 2.28 | 2.92 | 3.30 | 3.30 | 3.25 | 3.10 | 3.00 | 2.95 | 2.95 | 3.10 | 2.28 | 2.92 | 2.55 | 2.50 | 2.40 | 2.30 | 2.30 | 2.25 | 2.55 | 2.30 |
| 10-yr Govt. Bond Yield | 2.32 | 2.98 | 3.40 | 3.50 | 3.45 | 3.40 | 3.35 | 3.30 | 3.05 | 3.40 | 2.32 | 2.98 | 2.50 | 2.45 | 2.50 | 2.55 | 2.60 | 2.65 | 2.55 | 2.60 |
There’s no guarantee that a potential recession would be shallow, but two aspects working in favor of that thesis are atypical excess savings to support spending and the ongoing shortage of workers in some industries that could limit layoffs in a recession. For instance, the retail sector tends to be cyclically sensitive and it’s commonplace to shed workers for two years with the onset of a recession irrespective of its actual duration. During this cycle, employer rehiring patterns are depressed relative to the staffing levels that existed prior to the pandemic in some of the more cyclically sensitive retail areas, like auto dealers, home furnishings and electronics. In these three sectors, employment is almost 150K lower than in February 2020. That lower starting point is already more than double all the job losses that occurred during the 2001 recession within those sectors. In the extreme and unlikely case of a deep 2008 financial crisis that saw more than a half-million jobs shed in those sectors, today’s equivalent would amount to 280K jobs to return to the same trough in employment. Another cyclically sensitive sector is manufacturing. Here too employment levels are well below those that existed ahead of prior recessions, and are just shy of pre-pandemic levels. The former captures a structural decline in the sector, but the current state also leaves less fat to trim in an economic downturn.
Of course, there are areas of vulnerability that support an overall rise in the unemployment rate. Professional and technical services experienced strong job gains at 7% above pre-pandemic levels and the prior two recessions each produced a sizeable 4% contraction in employment in an 18-month timeframe. And, although the construction sector has complained of insufficient labor access, it too is a highly cyclical sector. The interest rate environment has already thrown investment into reverse, making it a prime candidate for weaker job demand as time rolls on.
The ultimate outcome will come down to business sentiment. The more that businesses believe a recession will not be deep, the more likely it is that they show greater restraint on layoffs. The last year has been a challenging period for employers in recruiting and retaining workers. This may cause some reluctance to act aggressively on weaker demand fundamentals, and instead opt for more favorable worker hours and wages. For instance, job openings are unsustainably elevated relative to prior cycles, even in sectors that exhibited strong hiring patterns already, like professional services. Employers would likely first opt to end their hiring intentions, rather than engage in layoffs. This, along with the better household financial health metrics is why we modelled an unemployment rate in this recession scenario that rises roughly 1.5 percentage points from the trough. This would place the recession in the ‘mild’ camp of historical experiences…even though it would not feel that way to those who lose their jobs or to those employers who revisit heightened uncertainty. We are truly in the “coin toss” stage of whether a recession will unfold. The data today doesn’t support it, but the speed of deterioration in several recent metrics does raise an eyebrow and alert us to that risk.
And what about Canada? The natural default is to look at highly indebted households to suggest that Canada would be in a worse position than its neighbor to the south. Some also point to the early-1990s experience where households bore the weight of plummeting housing markets. But there are several offsetting influences to consider. First, regulations now require household mortgages to be stress tested at higher interest rates. This creates more resilience than past decades by screening borrowers for this very moment of rapidly rising interest rates. Second, government spending is not restrictive in Canada, and significant income supports continue to flow to households. In fact, a criticism has been that fiscal policy is adding to the inflation pressures that the central bank is trying to fight. Third, Canada has shown greater economic resilience relative to the United States over the past three cycles. Fourth, Canada benefits greatly from high commodity prices. In recent months, higher incomes have flowed to several provinces, as well as fattened government coffers. A recession would weigh on commodity prices, but the supply side pressures created by Russia’s war on Ukraine would limit the downside and provide a partial shield to some provinces. And finally, excess savings have not been drawn down in Canada, unlike in the U.S., leaving a plumper cushion for Canadian households.
This lady doth protest too much? Nobody knows for sure if a recession will occur, let alone the full scope of how it would play out. But the list above does make the point that it’s not a forgone conclusion that Canada would follow the U.S. footsteps. In fact, one area where we would expect some deviation is timing. Should the U.S. formally lurch into a recession this year, Canada would likely lag by one quarter given the current tailwind and deviation in consumer patterns. On the flip side, Canadian companies were quicker to rehire than their American counterparts, which could be a vulnerability if confidence sours.
More time is needed to ascertain which economic path will play out. Will the economy successfully skim the surface, or will it be a bumpy recessionary landing? Until then, perhaps Winston Churchill best summed it up by saying…now this is not the end. It is not even the beginning of the end. But it is, perhaps the end of the beginning.
Disclaimer
This report is provided by TD Economics. It is for informational and educational purposes only as of the date of writing, and may not be appropriate for other purposes. The views and opinions expressed may change at any time based on market or other conditions and may not come to pass. This material is not intended to be relied upon as investment advice or recommendations, does not constitute a solicitation to buy or sell securities and should not be considered specific legal, investment or tax advice. The report does not provide material information about the business and affairs of TD Bank Group and the members of TD Economics are not spokespersons for TD Bank Group with respect to its business and affairs. The information contained in this report has been drawn from sources believed to be reliable, but is not guaranteed to be accurate or complete. This report contains economic analysis and views, including about future economic and financial markets performance. These are based on certain assumptions and other factors, and are subject to inherent risks and uncertainties. The actual outcome may be materially different. The Toronto-Dominion Bank and its affiliates and related entities that comprise the TD Bank Group are not liable for any errors or omissions in the information, analysis or views contained in this report, or for any loss or damage suffered.
Download
Share: