The Pandemic Sprint Into Mortgages:
A Look Into The Risks That Have Tagged Along For The Ride
Ksenia Bushmeneva, Economist | 416-308-7392
Meghan Trivedi, Economist | 416-415-1028
Date Published: July 14, 2021
- Category:
- Canada
- Real Estate
Highlights
- The pandemic brought about a surge in Canadian homeownership demand and mortgage credit. The Bank of Canada flagged that household sector vulnerabilities were on the rise, pointing to increases in the share of borrowers with high loan-to-income ratios and low down payments.
- There are some mitigating factors. Households’ balance sheets have improved during the pandemic thanks to wealth gains, extra savings and lower consumer credit balances. High credit scores of mortgage borrowers and stricter stress-testing requirements also add an extra layer of safety.
- Rock-bottom interest rates have also helped to keep debt servicing costs low. But interest rates are expected to turn from tailwind to headwind relatively soon. As such, the debt service burden is projected to return to pre-pandemic levels over the next few years and mortgage servicing is expected to take on the largest share of overall servicing costs.
- Risks to household balance sheets may be further amplified by a revival in consumer spending on high-contact services, and likely higher consumer credit balances. For homeowners with large mortgage debt burdens, the transition to higher mortgage rates will raise payments, leaving less room to service consumer debt.
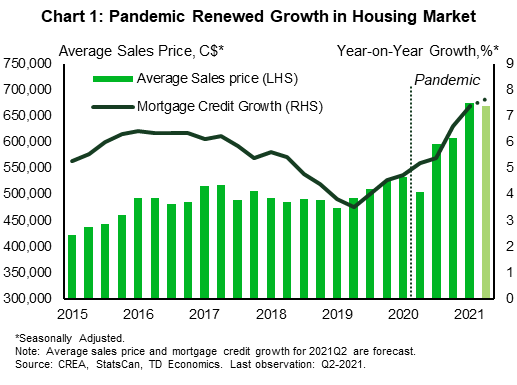
Remember the red-hot housing market back in 2016? Well, the pandemic has certainly put those times in perspective. The degree of ‘hotness’ has since been upgraded from red to white. While housing market activity has recently taken a small step back from exuberant peak levels in the spring, both home sales and prices are still hovering at unprecedented levels.1
The slew of mortgages issued during the pandemic have further added to already elevated debt levels on Canadian household balance sheets (Chart 1). Mortgage debt is up nearly 8% from a year ago, the largest increase since 2010. Rock-bottom interest rates have kept debt-service payments manageable, for now. But ultra-low rates will not last forever. The Bank of Canada flagged a rise in household debt-related vulnerability during the pandemic, specifically pointing to increased issuance of mortgages to borrowers with high loan-to-income ratios and low down-payments. In the near-term, these risks are somewhat offset by several mitigating factors, including higher household wealth, elevated household savings, and lower credit card balances. From a lending perspective, underwriting standards remain high, and the share of mortgages originated to borrowers with high credit scores has continued to rise during the pandemic.
Despite those reassuring factors, the inevitable transition to a rising interest rate environment is likely to pose risks. Of particular concern is the possibility that some households with significant mortgage debt burdens also run up their consumer debt levels. The long-awaited pandemic recovery will bring a revival in spending on high-contact services, and with it likely higher consumer credit balances. Those households would face tough decisions in a rising rate environment, especially if policy rates were to rise swifter than anticipated.
Are Canadians Taking Out Riskier Mortgages?
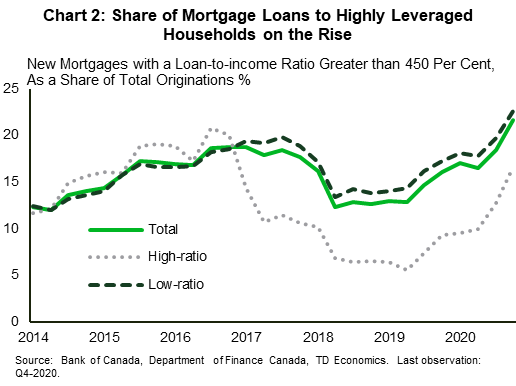
According to the Bank of Canada, Canadians are on average taking out risker mortgages. The latest Financial System Review flagged increased risk in the mortgage market through two main channels: borrowers with high loan-to-income (LTI) ratios and the rise of insured (low down payment) mortgage originations.2 The share of new mortgages with LTI ratios above 450% rose to 22% at the end of 2020, up from 16% prior to the pandemic and above the previous peak of 19% seen in 2016 (Chart 2). A portion of this increase reflects higher originations of insured mortgages – those with down payments less than 20% of the property price, also known as high-ratio mortgages – which require insurance by Canadian Mortgage and Housing Corporation (CMHC) or private providers. The Bank identified the above two metrics as the most significant factors in helping predict homeowners’ future financial distress.3 For example, based on its analysis, a homeowner with just a 5% equity stake was twice as likely to experience financial stress than a homeowner with a 20-35% stake. This suggests that a greater share of households who purchased homes last year may be financially vulnerable.
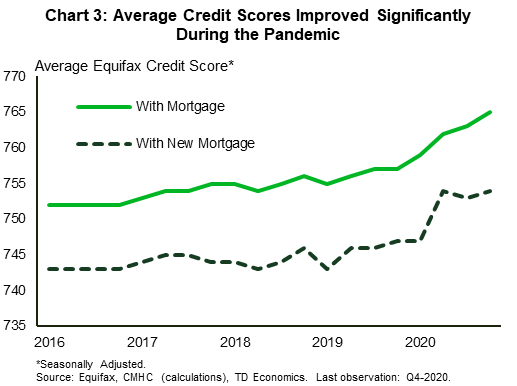
The recent rise in insured (low down payment) mortgages reflects higher home prices which increased the dollar amount needed for a down payment. It also captures higher demand for mortgages from first-time homebuyers who have accelerated plans to purchase in the “race for space” that has rallied the demand for housing worldwide. Households with a major income earner younger than 35 accounted for 36% of new mortgage borrowing in the first quarter of 2021, up from 28% in 2020.4 First-time buyers have less home equity and lower credit scores than repeat buyers, on average (Chart 3). A Statistics Canada survey reported that in 2018, slightly over 20% of first-time buyers in Canada (those that bought their homes in the five years prior) found it “difficult” or “very difficult” to meet their financial obligations.5
Long Run Trends in Canadian Mortgage Preferences Help to Ease Concerns
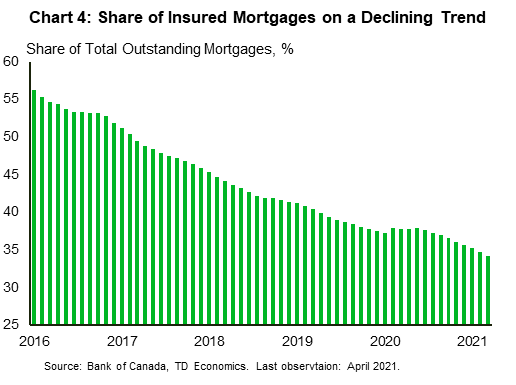
The increased popularity of insured mortgages during the pandemic will likely prove fleeting. Indeed, after rising last year, their share of originations has already fallen back to levels prior to the pandemic. Taking a longer view, insured mortgages as a share of outstanding mortgage credit have been on the decline since at least 2016 (Chart 4). This is partly in response to regulatory factors. With eligibility for insured mortgages capped at $1 million price point, the pool of homes fitting this price tag has been shrinking over time, particularly in cities like Toronto and Vancouver. Insured mortgages now account for just under 35% of all outstanding mortgages in Canada, down from more than 50% five years ago. Despite the increase in insured mortgage issuance earlier in the pandemic, the bulk of mortgages originations have remained uninsured (and therefore have a down payment of at least 20%).
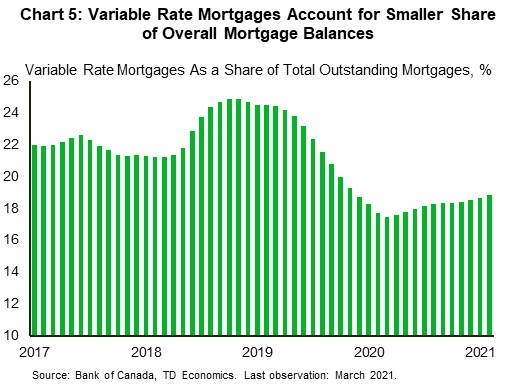
The proportion of mortgages originated with variable interest rates also increased during the health crisis. The share has further spiked most recently, reflecting a widening gap between variable and fixed-term rates as fixed-term interest rates edged higher while variable rates remained at record-low levels. Despite this increase, variable-rate mortgages currently account for 20% of the stock of mortgages, which is below the 25% share observed over the 2016-18 period (Chart 5).
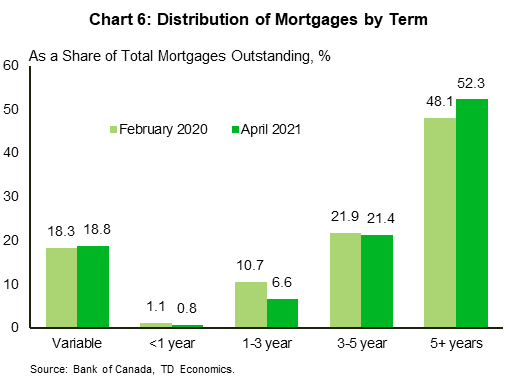
While the tenor preferences of Canadian households may have temporarily shifted in favour of variable-rate mortgages during the pandemic, most Canadians still opted for fixed-rate mortgages with longer terms. Since February 2020, fixed-rate mortgages with terms of five or more years have increased while those with less than three years declined (Chart 6). The average term for outstanding fixed-rate mortgages has increased from 4.1 years in 2016 to 4.5 years at the start of this year.
Credit Quality Remains High
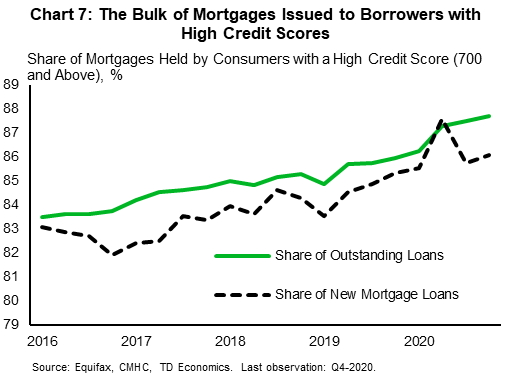
It is reassuring that the credit quality of Canadian households has improved steadily over the past five years and remained high during the pandemic. Based on Equifax data, the share of outstanding loans with a credit score of 700 or higher increased from 83.5% in early 2016 to 87.7% in 2020Q4 (Chart 7). New mortgage loans have a similar profile except for the temporary increase in 2020Q2 when mortgage lending standards tightened.
It is also encouraging that there is no evidence of risks migrating from chartered banks to non-bank lenders, which are not subjected to mandatory stress test requirements. On the contrary, the share of mortgages held by non-banks declined since early 2019, falling from 26% to 24% of outstanding mortgage credit.
How Will Canadian Households Adapt to a Rising Rate Environment?
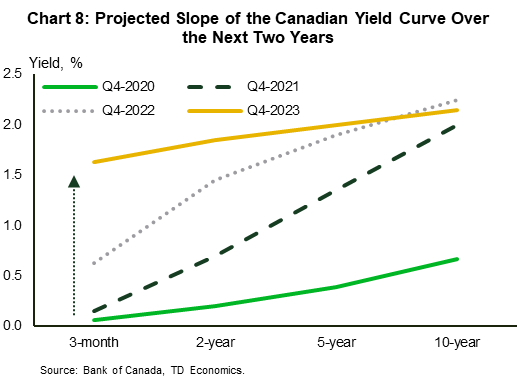
Government of Canada bond rates are a major determinant of mortgage rates. The yield curve is expected to steepen significantly as the recovery gathers momentum and then flatten by late 2023 at a higher level as policy rate hikes pick up speed (Chart 8). Households who originated in a low interest rate environment may then face higher rates upon renewal.
A standard measure for assessing the vulnerability of households to higher interest rates is their ability to service their debt, measured by the debt servicing ratio (DSR). The DSR compares debt service costs to personal disposable income at the aggregate national level. The DSR declined sharply from 15% in late 2019 to just over 12% in mid-2020 as unprecedented fiscal support programs bolstered personal disposable income (the denominator in the ratio) and loan deferrals also temporarily lowered the required debt payments (the numerator). The DSR has been on the rise in recent quarters as fiscal transfers and deferrals tapered off while mortgage debt balances continued to build up.
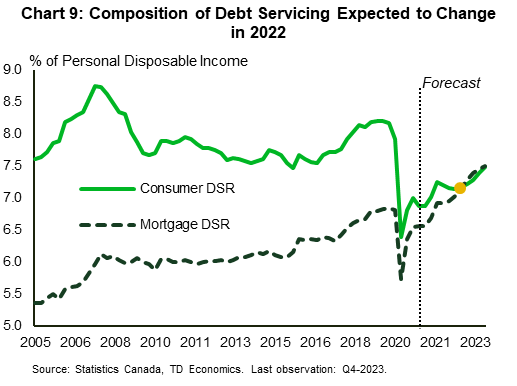
Looking ahead, the DSR is expected to rise back to pre-pandemic levels by the end of 2023. The outlook considers several factors, including a gradual transition to higher interest rates (Chart 8). Income support measures are set to expire in the near-term, bringing personal disposable income growth closer to its long run trend. Consumer spending is expected to rebound as the recovery gains momentum, reinvigorating growth in consumer credit. Despite this increase in consumer credit, debt service on mortgages are projected to exceed that on consumer debt for the first time (Chart 9). The DSR will therefore become more sensitive to changes in mortgage payments than ever before.
Higher Rates Will Impact Mortgage Holders Differently
The impact of higher borrowing costs on mortgage payments will vary across homeowners. Those who originated fixed-rate mortgages with long terms will be insulated from the transition to higher rates during this period. Those with variable-rate mortgages can expect interest payments to increase in step with policy rates, which are not expected to rise until late 2022.6 However, homeowners with mortgages coming due in 2023 are likely to face a much less favourable interest rate environment with benchmark government bond yields close to more “normal” levels.
All in all, we estimate that around 18% and 20% of overall outstanding fixed mortgages will need to be renegotiated in 2022 and 2023 due to expiring 3-5+ year tenor contracts, respectively (Table 1).7 Further, we estimate almost 17% of those outstanding mortgages in 2023 will face higher interest rates than when they were originated. The increase in the qualifying rate effective June 1 from the Bank of Canada 5-year benchmark mortgage rate to 5.25% (up from 4.79%)8 may also present an added complication for some borrowers upon renewal.
What Happens to Debt Servicing Costs if Mortgage Rates Rise More than Expected?
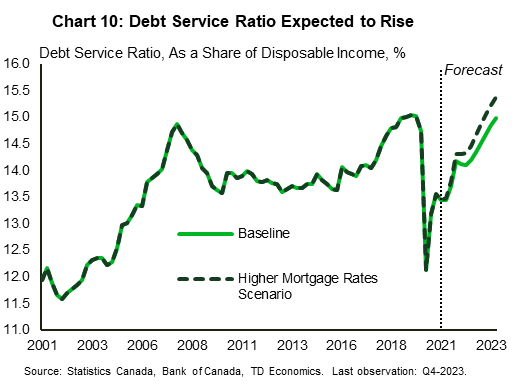
The projected DSR outlined above (Chart 9) is based on a scenario where medium- and long-term bond yields rise gradually. The benchmark 5-year fixed-term mortgage rate increases from its current level around 3.35% to 4.60% by the end of 2023.9 The DSR rises to the pre-pandemic level of 15% of personal disposable income. Consider an alternative scenario where medium- and long-term bond yields increase more rapidly in response to mounting inflationary pressures even as policy rates remain unchanged from the baseline scenario. In this “high interest rate scenario” the 5-year mortgage rate is 50-basis points (bps) above that in the baseline scenario in each quarter. Under this scenario, we estimate that the DSR reaches an unprecedented level of 15.4% by the end of 2023, 40 bps above the baseline (Chart 10).
However, if consumers exceed expectations and take on more consumer credit than anticipated, this can drive household debt-servicing costs even further. This perfect storm of rising mortgage rates and less predictable post-pandemic consumer spending habits may result in a scenario where some households find it difficult to stay afloat.
Table 1: Risks Faced by Expiring 3-5+ Tenor Mortgages
| Expressed as % of Outstanding Fixed Term Mortgages C$ | 2021 | 2022 | 2023 |
| % Mortgages coming up for renewal | 18.3 | 17.8 | 19.9 |
| % Mortgages that will be exposed to higher interest rates upon renewal | 3.3 | 12.3 | 16.6 |
Bottom Line
A sudden rush of demand for mortgages during the pandemic, particularly from the first-time buyers, came alongside an increase in financial vulnerabilities, not just due to rapid accumulation of new mortgage debt but also due to riskier characteristics of these mortgages. We find that some factors contributing to a rise in those risks are temporary in nature and should dissipate once housing demand comes off the boil.
Other mitigating factors are also important. Households’ balance sheets have improved during the pandemic thanks to significant gains in household wealth, extra savings and lower consumer credit balances, which may help to defer household debt burden concerns. High credit scores of mortgage borrowers and stricter stress-testing requirements also add an extra layer of safety.
Rock-bottom interest rates have helped to keep debt servicing costs low, despite the ramp-up in mortgage credit. This is likely to change with the transition to higher interest rates over the next few years. As a share of disposable income, the debt service burden is projected to return to pre-pandemic levels over the next few years. Since mortgages now account for a larger share of household debt than they did prior to the pandemic, mortgage servicing is expected to take on the largest share of overall servicing costs on record. Mortgage rates will therefore play a greater role in the ability of households to meet their overall debt obligations.
Risks to household balance sheets may be further amplified by a revival in consumer spending on high-contact services as the pandemic moves in the rear-view mirror. Once lockdown measures are removed there is a chance that consumers splurge on things they were not able to enjoy for a while, such as dining out, entertainment and traveling, leading to a quicker revival of growth in consumer credit. For some homebuyers, the transition to higher mortgage rates will raise payments, leaving less room to service consumer debt.
End Notes
- TD Economics. “ Canadian Existing Home Sales.” https://economics.td.com/ca-existing-home-sales
- The Bank of Canada.” Financial System Review—2021.” https://www.bankofcanada.ca/2021/05/financial-system-review-2021/#footnote-15
- Despite their significance in predicting household financial distress, neither of these two metrics are currently being reported on a regular basis, making it difficult to track the evolution of this risk over time.
- Statistics Canada. “National balance sheet and financial flow accounts, first quarter 2021”. https://www150.statcan.gc.ca/n1/daily-quotidien/210611/dq210611a-eng.htm
- Statistics Canada. “Household characteristics, by tenure including the first-time homebuyer status.” https://www150.statcan.gc.ca/t1/tbl1/en/tv.action?pid=4610004501
- Variable rate mortgages are typically set with reference with the prime rate which moves in step with the policy rate.
- For this analysis, we focus only on mortgages with 3+ year tenors for simplicity. Mortgages with tenors under 3 years and variable rate mortgages would need further assumptions made on new origination growth in 2021-2022 for the renewal/interest rate risk assessment in 2023, which is outside the scope of this paper.
- Office of the Superintendent of Financial Institutions. News Release May 2021. https://www.osfi-bsif.gc.ca/Eng/osfi-bsif/med/Pages/b20nr-0521.aspx
- Current level considered as of June 23, 2021
Disclaimer
This report is provided by TD Economics. It is for informational and educational purposes only as of the date of writing, and may not be appropriate for other purposes. The views and opinions expressed may change at any time based on market or other conditions and may not come to pass. This material is not intended to be relied upon as investment advice or recommendations, does not constitute a solicitation to buy or sell securities and should not be considered specific legal, investment or tax advice. The report does not provide material information about the business and affairs of TD Bank Group and the members of TD Economics are not spokespersons for TD Bank Group with respect to its business and affairs. The information contained in this report has been drawn from sources believed to be reliable, but is not guaranteed to be accurate or complete. This report contains economic analysis and views, including about future economic and financial markets performance. These are based on certain assumptions and other factors, and are subject to inherent risks and uncertainties. The actual outcome may be materially different. The Toronto-Dominion Bank and its affiliates and related entities that comprise the TD Bank Group are not liable for any errors or omissions in the information, analysis or views contained in this report, or for any loss or damage suffered.
Download
Share: