Provincial Inflation Outlook:
External vs. Domestic Drivers Shaping Provincial Inflation Dynamics
Rishi Sondhi, Economist | 416-983-8806
Date Published: December 6, 2022
- Category:
- Canada
- Financial Markets
Highlights
- To date, most of Canada’s year-on-year inflation has been influenced by supply-related or external factors. At the provincial level, over 80% of inflation experienced in the Atlantic Region has been shaped by these forces. They’ve also been prominent in the Prairies while in Quebec, food price inflation has been an important driver.
- The story is different in Ontario and B.C. where a comparatively large share of their inflation has been driven by factors more sensitive to domestic conditions.
- Domestically sensitive inflation generally captures price movements for a variety of services, and services inflation has historically been stickier than goods. As such, inflation will likely be more persistent in B.C. and Ontario next year.
- Conversely, the Atlantic Region and Prairies could see steeper disflation next year amid healing supply chains and less inflation in energy products. Quebec, meanwhile, should record a middle-of-the-pack performance.
Like its counterparts around the world, the Bank of Canada is navigating a complex inflation problem. A key issue is that much of Canada’s inflation has been driven, or at least supported, by factors and developments arising from beyond the country’s borders. In a paper released earlier this autumn, we estimated that as much 65% of Canada’s year-on-year inflation rate was being influenced by supply-related or externally driven factors (see report) This supply/externally driven inflation has receded modestly in recent months, partially on the back of an easing in global supply chain disruptions and lower world commodity prices. At the same time, however, pressure has been heating up within components that are more sensitive to domestic economic conditions, such as mortgage rates, rents, restaurant services, entertainment, and personal care. These inflation dynamics have manifested across provinces in different ways and have implications for how we see provincial inflation rates evolving moving forward.
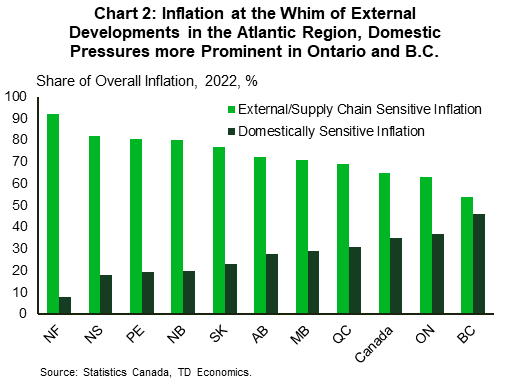
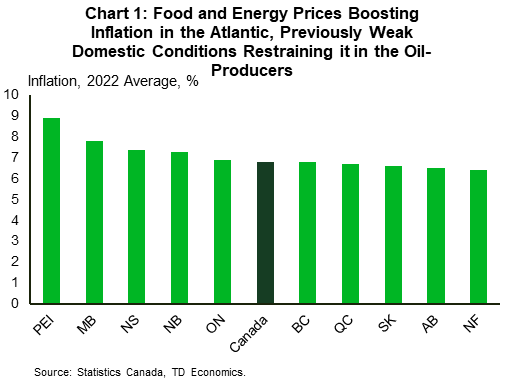
Chart 1 below ranks provinces by their 2022 average inflation rates. As can be seen, much of the Atlantic Region has led the way in terms of consumer price growth this year. Not coincidently, over 80% of inflation observed across this region this year can be chalked up to influences from supply or externally driven factors (Chart 2). At the extreme, nearly all the inflation experienced in Newfoundland and Labrador can be traced to externally sensitive components, as domestic economic activity has been exceedingly weak. Most of the externally driven inflation in the Atlantic has come via food and energy prices, as these items account for an outsized share of the region’s CPI basket. In addition, food prices have seen a relatively steep ascent across most of the Atlantic.
This same logic holds true across most of the Prairies. As Table 1 below shows, energy prices have played a huge role in boosting inflation in Saskatchewan and Manitoba this year (although inflation in the latter has also been lifted by homeowner replacement costs and a hike in vehicle insurance premiums).
Table 1. Contributions to Overall Inflation
Percentage Points
| Jursdiction | CPI Inflation Rate, 2022 Average | Globally Sensitive | Domestically Sensitive | ||||||
| Total | Food | Energy | Other* | Total | Shelter (excl. natural gas, fuel) | Other** | |||
| Canada | 6.8 | 4.4 | 1.1 | 1.8 | 1.5 | 2.4 | 1.6 | 0.8 | |
| PE | 8.9 | 7.2 | 1.3 | 4.3 | 1.6 | 1.7 | 1.2 | 0.5 | |
| MB | 7.8 | 5.2 | 1.1 | 2.4 | 1.7 | 2.6 | 1.6 | 1 | |
| NS | 7.4 | 6.1 | 1.2 | 3.3 | 1.6 | 1.3 | 0.8 | 0.5 | |
| NB | 7.3 | 5.9 | 1.2 | 2.9 | 1.8 | 1.4 | 1 | 0.4 | |
| ON | 6.9 | 4.3 | 1 | 1.8 | 1.5 | 2.6 | 1.9 | 0.7 | |
| BC | 6.8 | 3.7 | 0.9 | 1.3 | 1.5 | 3.1 | 2.3 | 0.8 | |
| QC | 6.7 | 4.6 | 1.2 | 1.9 | 1.5 | 2.1 | 1.3 | 0.8 | |
| SK | 6.6 | 5.1 | 1 | 2.5 | 1.6 | 1.5 | 0.6 | 0.9 | |
| AB | 6.5 | 4.7 | 1.1 | 1.9 | 1.7 | 1.8 | 1 | 0.8 | |
| NL | 6.4 | 5.9 | 1.3 | 2.8 | 1.8 | 0.5 | 0.3 | 0.2 | |
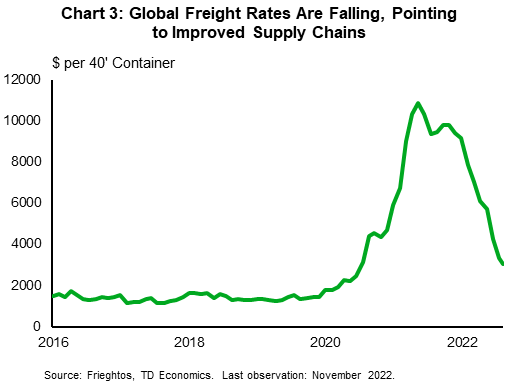
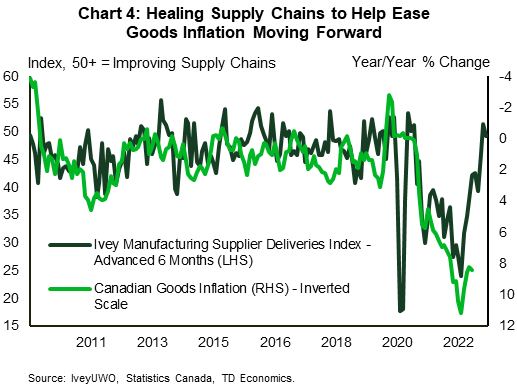
In Alberta, inflation in goods other than food and energy (such as autos, automotive parts, and household furnishings) has made more of a direct contribution to the overall rate than most other provinces. We are confident that inflation in these types of goods will face continued downward pressure from better-functioning supply chains, as mounting evidence indicates that they are healing (Chart 3). So far, the easing in goods prices has been largely contained to those tied to energy, but the cooling effect on the broader basket of goods prices from improving supply chains will likely come with a lag (Chart 4).
Oil prices hooked higher in October although have declined in November. While there are uncertainties surrounding the outlook for oil prices in 2023, we can be confident that they won’t contribute as much to overall inflation as they did during their massive runup in 2022. Less energy price inflation should pay dividends for households in the Atlantic Region and the Prairies.
Outside of the Atlantic Region, food prices have made the largest contribution to overall inflation in Quebec. This is because they’ve grown a bit faster than in the country overall and have the highest weighting of any province. How food prices evolve moving forward is perhaps the biggest wildcard in our inflation forecast. We assume that food price inflation will moderate in the coming quarters, but at a comparatively gradual rate compared to most other goods areas. Regardless, should it ease as anticipated, this will be a boon for households in La belle province.
Although supply/externally driven inflation should continue to cool moving forward, inflation tied to domestic economic factors will likely prove to be a tougher nut to crack. That said, it is also the type of inflation that the Bank of Canada has the most influence over through interest rate hikes and their cooling impact on aggregate demand.
This type of inflation generally captures price movements for a variety of services, and services inflation has historically been stickier than goods inflation. For instance, during periods in the 1970s and 1980s goods inflation was running hot, much like today. The fever in goods inflation ultimately broke then, as commodity prices declined. Unlike the dynamic in goods prices, services inflation kept rising and peaked more than a year after that of goods. What history tells us then, is that there is likely to be more stickiness to inflation in provinces like Ontario and B.C. (where services spending is a very important part of the consumption basket). And, given the high importance of services to these two provinces, it’s really no surprise that domestically driven sources have accounted for the largest share of their overall inflation in 2022 (see Chart 2).
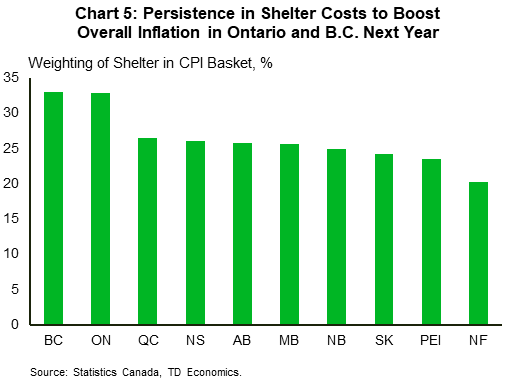
Due to its relatively rapid growth and outsized weighing in their CPI baskets, shelter inflation has also been an important part of the domestically driven inflation story in B.C. and Ontario (Chart 5). However, as a function of their overstretched housing affordability backdrop, Ontario and B.C. have seen the steepest declines in their home prices as borrowing costs have ratcheted higher. We expect this to continue filtering through into significantly slower inflation for homeowners’ replacement costs. This in turn points to a cooling in overall shelter costs, following inflation rates of around 7-7.5% in both markets this year.
Even with this downward pressure on inflation, shelter costs are likely to remain stubbornly elevated and well above historical averages in Ontario and B.C. in 2023, as the sheer magnitude of the anticipated increase in mortgage interest costs from the Bank of Canada’s rate hiking campaign provides a huge offset. In addition, rents are rising rapidly in both B.C. and Ontario. We think there will be some persistence to this trend in both regions next year, as immigration supports robust population growth.
Putting it all together, inflation should grind lower across all provinces in 2023. However, inflation rates in the Atlantic Region could experience even steeper disinflation than elsewhere in Canada, on the back of slower energy price inflation. A similar story should hold in the Prairies, who also stand to disproportionately benefit from lower goods prices via easing supply chains. One caveat is that we expect home prices to show some resilience in the Prairie region, which should keep inflation from falling by as much as in the Atlantic. In contrast, inflation is likely to be stickier in Ontario and B.C., while Quebec records a more middle-of-the-pack performance.
Disclaimer
This report is provided by TD Economics. It is for informational and educational purposes only as of the date of writing, and may not be appropriate for other purposes. The views and opinions expressed may change at any time based on market or other conditions and may not come to pass. This material is not intended to be relied upon as investment advice or recommendations, does not constitute a solicitation to buy or sell securities and should not be considered specific legal, investment or tax advice. The report does not provide material information about the business and affairs of TD Bank Group and the members of TD Economics are not spokespersons for TD Bank Group with respect to its business and affairs. The information contained in this report has been drawn from sources believed to be reliable, but is not guaranteed to be accurate or complete. This report contains economic analysis and views, including about future economic and financial markets performance. These are based on certain assumptions and other factors, and are subject to inherent risks and uncertainties. The actual outcome may be materially different. The Toronto-Dominion Bank and its affiliates and related entities that comprise the TD Bank Group are not liable for any errors or omissions in the information, analysis or views contained in this report, or for any loss or damage suffered.
Download
Share: