Zero Isn’t Zero Everywhere:
The Provincial Divide in Breakeven Job Growth
Marc Ercolao, Economist | 416-983-0686
Matt Palucci, Economic Analyst
Date Published: July 8, 2026
- Category:
- Canada Provincial & Local Analysis
Highlights
- Canada’s breakeven pace of job growth has fallen sharply alongside population and labour force growth. National employment can now be close to flat without pushing the unemployment rate higher.
- The national breakeven estimate tells only part of the story, with provincial trends differing considerably. With declining labour forces, Ontario, Quebec, and B.C. could lose jobs without adding to unemployment, while Alberta and parts of Atlantic Canada still need solid hiring to absorb new labour force entrants.
- These sharp demographic changes alter the interpretation of monthly job reports. Across provinces, similar rates of job growth may imply different unemployment rate paths.
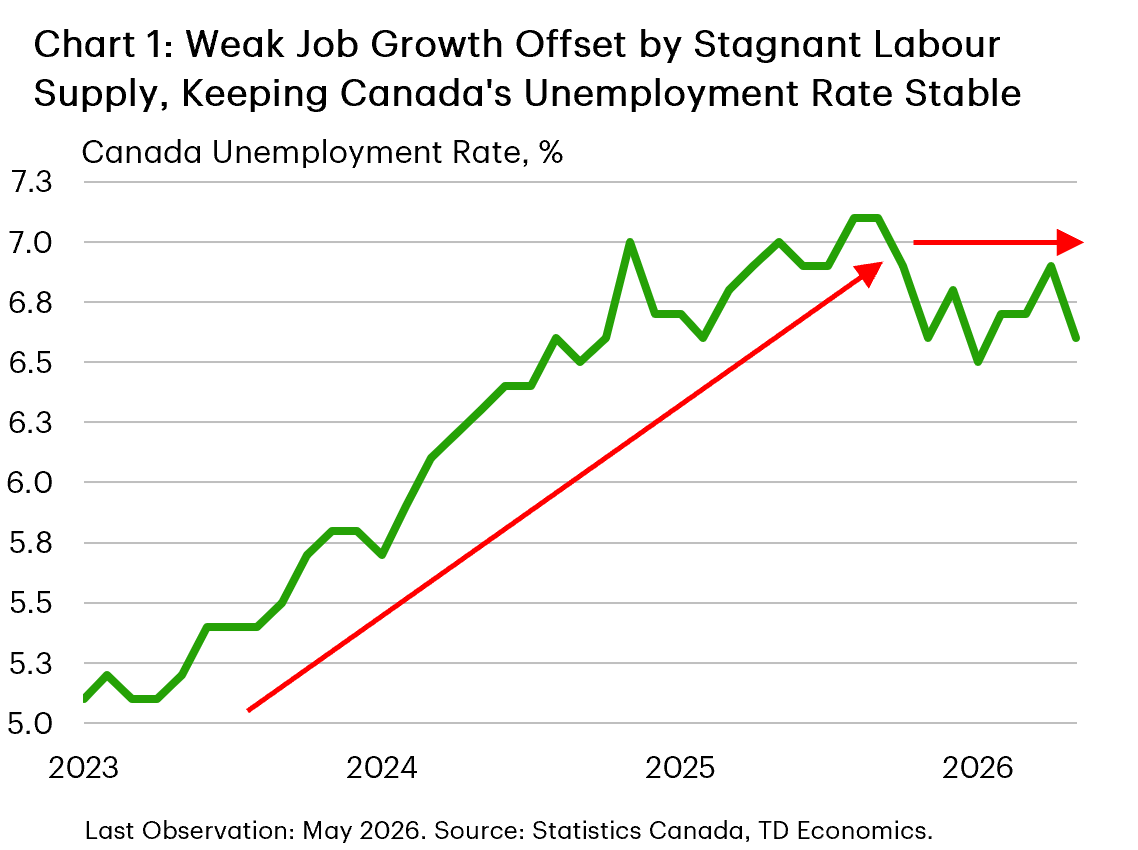
Canada’s job market is entering a new phase. During the post-pandemic population surge, even a strong pace of hiring was not enough to keep Canada's unemployment rate from drifting higher. As immigration policy has tightened over the past year, that threshold has fallen sharply. More recent discussion has centered on the idea that national “breakeven” employment growth — the monthly pace of job creation needed to hold the unemployment rate steady — is now close to zero. Indeed, net job creation was essentially flat through the first five months of the year, yet the unemployment rate held within a narrow 6.5%–6.9% range (Chart 1).
Still, Canada’s labour market is not uniform. In some provinces, labour forces are already shrinking. In others, migration and younger demographics continue to expand the pool of available workers. As a result, a national breakeven estimate near zero masks provincial differences that matter for understanding movements in unemployment and whether job markets are loosening or tightening.
Middling Population Growth Is Changing Labour Force Dynamics
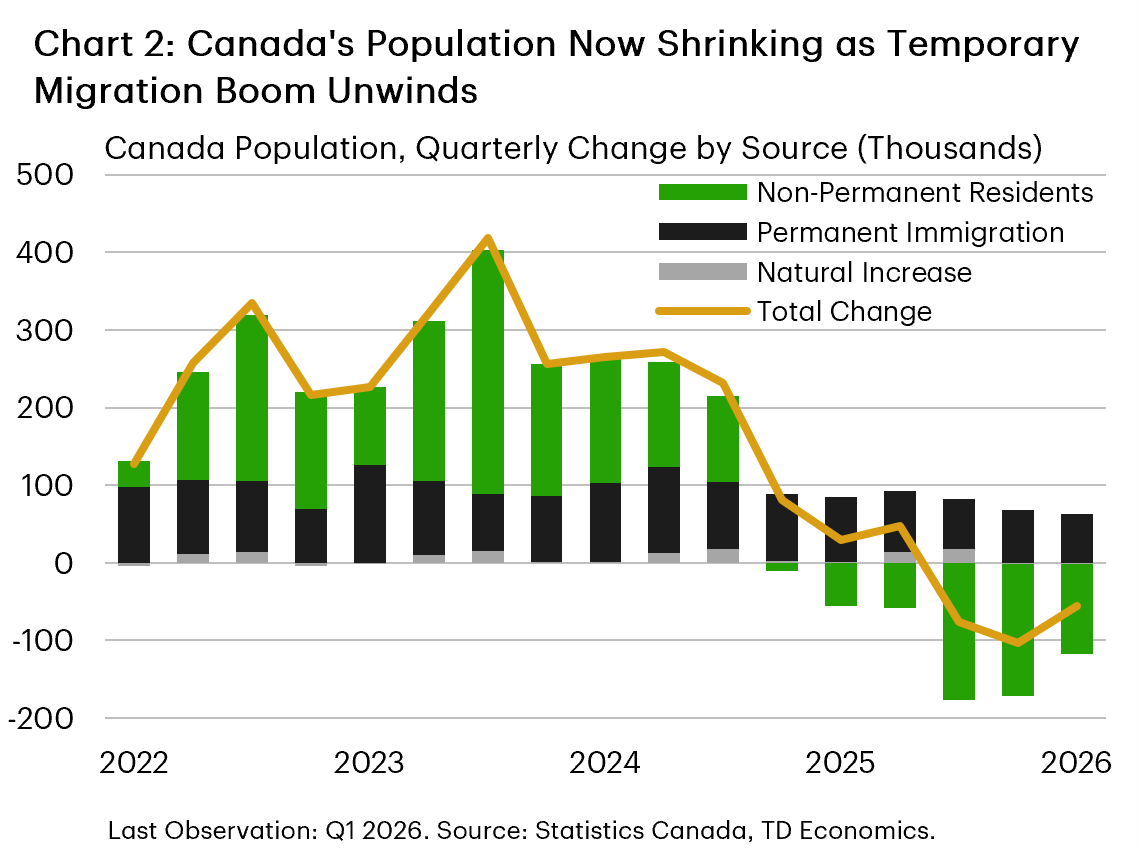
The shift in Canada’s labour market largely reflects changing demographics and immigration policy. The extraordinary population growth of 2022–2024, driven largely by non-permanent residents, is now reversing as federal immigration caps take hold1. In fact, Canada’s population has contracted outright in recent quarters for the first time on record, with the bulk of that decline coming from an almost 600k drop in non-permanent residents — mainly students and temporary foreign workers (Chart 2). The decline is evident across provinces, though to varying degrees.
Population growth and labour force growth typically move together but the relationship is not one-for-one (Chart 3). Labour force growth can run ahead of the adult population when a larger share of people are participating in the work force — that is, working or actively looking for work. It can also fall behind when participation declines. This matters more in older populations, where retirement pulls more people out of the labour force, and in jurisdictions losing more younger workers, who tend to have higher participation rates. This is where the provincial story becomes interesting.
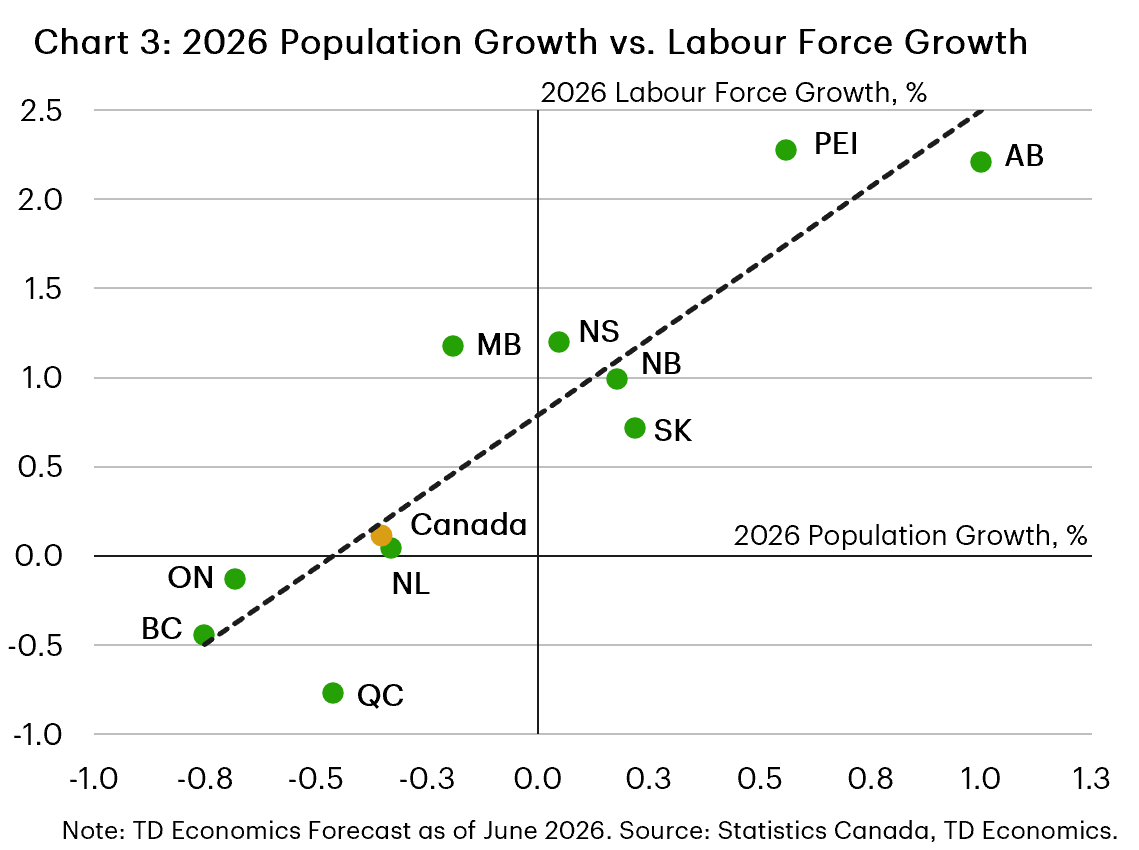
Alberta and Prince Edward Island (P.E.I.) stand apart from the current national trend. Alberta remains the fastest-growing province, supported by strong interprovincial migration and a younger population that keeps overall labour force participation among the highest in the country. P.E.I.’s population growth has slowed sharply from pandemic-era highs, but it remains one of the few provinces still posting positive year-over-year gains. Both provinces should therefore continue to see positive labour force growth.
Saskatchewan, Manitoba, Nova Stcotia, and New Brunswick sit closer to the middle. Population growth has cooled considerably, but these provinces have largely avoided stark outright declines seen elsewhere. Saskatchewan continues to post modest population gains, while Manitoba and much of Atlantic Canada have effectively flatlined. Labour force participation in the Prairies tends to exceed the national average, while Atlantic Canada continues to still benefit somewhat from migration gains accumulated during the pandemic. These factors should support modest, but still positive, labour force growth going forward.
Ontario, British Columbia (B.C.), Quebec, and Newfoundland and Labrador (N.L.) face the weakest labour force outlook. In these jurisdictions, populations are contracting the most, reflecting the sharp reversal in non-permanent resident inflows after federal immigration policy changes. The impact is especially pronounced in Ontario, B.C., and Quebec, which were among the largest beneficiaries of the post-pandemic surge in temporary migration. Because non-permanent residents are concentrated in younger prime working-age groups, slower population growth is likely to feed directly into labour force contractions this year.
Provincial Breakevens Are Moving in Different Directions
Table 1 shows our provincial breakeven job-growth estimates, based on current labour force expectations. With regional labour force trends pulling in different directions, notable divergences are emerging beneath the national figure. Some provinces can post little or no job growth without unemployment rising. Others still need steady hiring to prevent slack from building.
Table 1: 2026 Provincial Breakeven Employment Estimates
| CA | AB | SK | MB | NB | NL | NS | PEI | ON | QC | BC | |
| Average Monthly Job Growth | |||||||||||
| 2011-2019 | 19,160 | 2,410 | 330 | 490 | 50 | -20 | 160 | 110 | 8,280 | 3,080 | 4,270 |
| 2022-2024 | 39,610 | 7,080 | 1,210 | 1,350 | 900 | 420 | 1,270 | 280 | 13,710 | 7,520 | 5,860 |
| 2026 Year-to-Date* | -4,900 | 7,960 | -740 | 1,300 | 120 | -60 | 860 | 360 | 3,040 | -14,760 | -3,000 |
| 2026 Breakeven Estimates | |||||||||||
| Monthly Estimate | 1,900 | 4,800 | 400 | 700 | 300 | 0 | 500 | 200 | -900 | -3,000 | -1,100 |
| Annual Estimate** | 22,800 | 57,600 | 4,800 | 8,400 | 3,600 | 0 | 6,000 | 2,400 | -10,800 | -36,000 | -13,200 |
Canada’s three largest provinces sit at one end of the spectrum. Ontario, B.C., and Quebec together account for nearly three-quarters of national employment, but the amount of hiring needed to hold unemployment steady has fallen sharply. With labour forces expected to contract, even small job gains would push unemployment lower. Our estimates suggest these provinces could absorb modest annual job losses—roughly -11k jobs in Ontario, -13k in B.C., and -36k in Quebec—without raising unemployment rates. This marks a sharp reversal from their historical pattern of steady job growth.
Alberta and much of Atlantic Canada sit at the other end of the spectrum. They still need to hire at a sturdy pace to prevent labour markets from loosening. Alberta is the clearest case. Its breakeven estimate is 58k, almost twice its 2011–2019 pace of annual employment growth. The same dynamic holds in Saskatchewan and Manitoba, though by smaller margins. Both provinces have annual breakevens above their historical pace of job growth.
Nova Scotia, New Brunswick, and P.E.I. face similar hiring thresholds, with breakevens above their 2011–2019 norms. Labour supply is the common thread. The Prairie labour force is still expected to grow nearly 2.0% in 2026, while Atlantic Canada’s is expected to grow close to 1.0%—a sharp contrast with national stagnation. N.L. is the exception, with a flat breakeven that is close to its historical pace of job growth.
What Disparate Breakevens Mean for Unemployment Rates
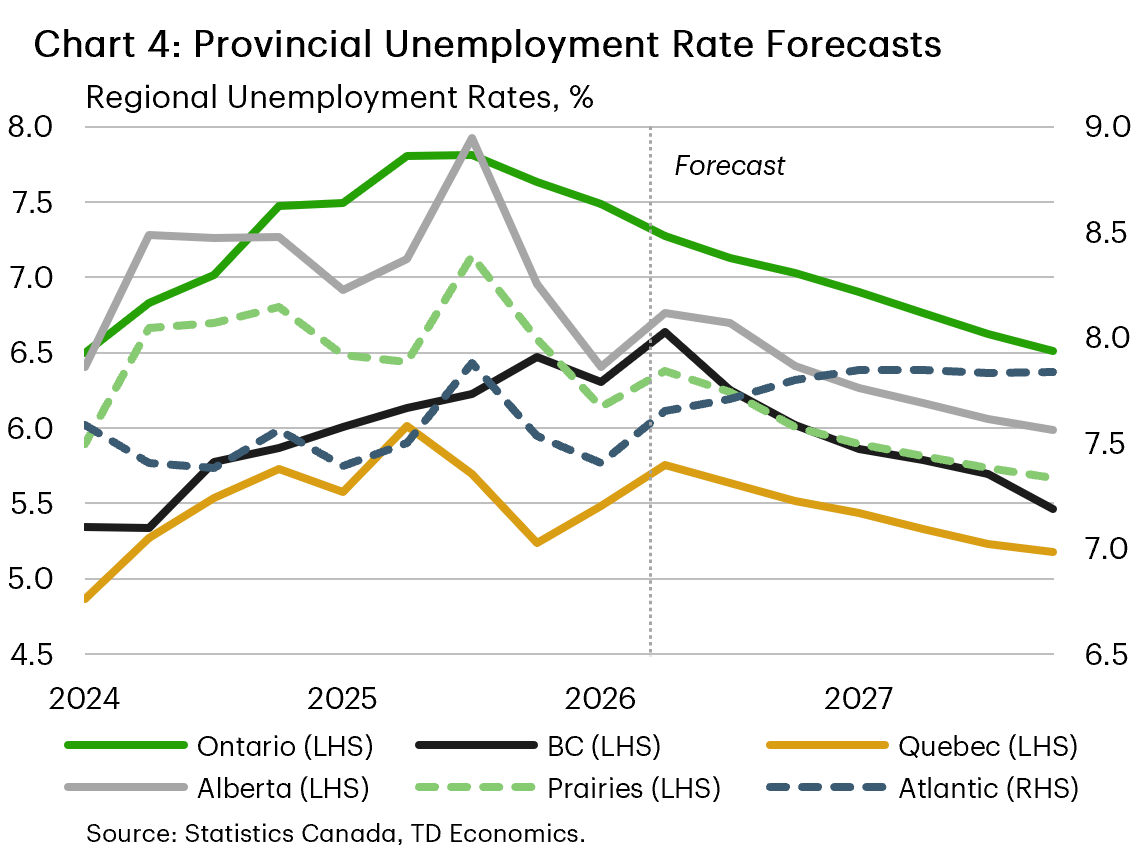
Breakeven estimates are useful in connecting labour supply assumptions to unemployment projections. They show how much hiring is needed to move the needle on unemployment. Where employment growth runs persistently below its breakeven benchmark, labour market slack builds and unemployment rates move higher. Where job creation exceeds it, labour markets tighten and unemployment rates improve. This means that similar employment outcomes imply very different unemployment paths from one province to the next.
This lens helps explain recent hiring patterns and our provincial unemployment forecasts (Chart 4). Ontario is a good example. Year-to-date job gains have averaged about 3k per month. That pace is weak by historical standards, but it sits comfortably above the province’s negative breakeven threshold. This informs our forecast for Ontario’s unemployment rate to drift lower through the rest of the year.
B.C. tells a similar story, though the mechanisms are different. We expect B.C.’s unemployment rate to edge lower in 2026, even though the province lost nearly 3k jobs per month on average through the first five months of the year. The key is that B.C.’s labour force is expected to contract more sharply than Ontario’s (in percentage terms). As labour supply shrinks, the unemployment rate can drift lower even with modest job losses.
Alberta's story is stronger, but the breakeven math is less forgiving. We expect Alberta to post the strongest job growth in the country this year. In fact, the economy has generated an average of nearly 8k jobs per month year-to-date, exceeding its breakeven threshold. But with its labour force expanding, Alberta's breakeven threshold is meaningfully higher. That limits how far its unemployment rate can fall, even with solid hiring.
Quebec is more of a stabilization story. Quebec has shed nearly 15k jobs per month on average so far this year, but its labour force has fallen by almost the same amount. We expect monthly job losses over the rest of the year to average close to the province’s breakeven estimate, keeping the unemployment rate broadly flat through 2026. Quebec also has the lowest unemployment rate among the four largest provinces, and its lack of labour force growth will keep it relatively tight. Much of Atlantic Canada shows a similar pattern. Muted labour force growth is helping stabilize unemployment rates, even as modest job creation masks softer underlying economic momentum.
There is also a broader Canada-wide message here. As labour force growth stalls, national employment reports are becoming harder to interpret. When breakeven job growth is near zero, weak monthly job gains no longer send the same signal about unemployment that they did when labour supply was growing rapidly. But that does not mean the labour market is healthy. It means national data may understate weakness in provinces where labour forces are still growing, while overstating weakness where labour supply has flatlined. The Bank of Canada has already signaled that headline labour market data need to be interpreted carefully, especially given current volatility and deeper structural shifts underway.
Bottom Line
For policymakers and forecasters, breakeven job growth argues for a more granular reading of provincial labour markets. These estimates help show where weak hiring is likely to translate into slack, and where labour markets may prove more resilient than national data suggest. That provincial lens matters more as Canada’s economy moves through a soft patch and the labour market adjusts to stalling population growth.
End Notes
- The federal government has set a target of reducing the share of non-permanent residents in Canada to 5% of the population by the end of 2026, primarily through lower temporary resident admissions and the expiration of existing study and work permits.
Disclaimer
This report is provided by TD Economics. It is for informational and educational purposes only as of the date of writing, and may not be appropriate for other purposes. The views and opinions expressed may change at any time based on market or other conditions and may not come to pass. This material is not intended to be relied upon as investment advice or recommendations, does not constitute a solicitation to buy or sell securities and should not be considered specific legal, investment or tax advice. The report does not provide material information about the business and affairs of TD Bank Group and the members of TD Economics are not spokespersons for TD Bank Group with respect to its business and affairs. The information contained in this report has been drawn from sources believed to be reliable, but is not guaranteed to be accurate or complete. This report contains economic analysis and views, including about future economic and financial markets performance. These are based on certain assumptions and other factors, and are subject to inherent risks and uncertainties. The actual outcome may be materially different. The Toronto-Dominion Bank and its affiliates and related entities that comprise the TD Bank Group are not liable for any errors or omissions in the information, analysis or views contained in this report, or for any loss or damage suffered.
Download
Share: