
Reality Bites:
Finding the Next U.S. Growth Dividend
Beata Caranci, SVP & Chief Economist | 416-982-8067
Date Published: January 29, 2025
- Category:
- Canada
- Forecasts
- Financial Markets
The executive orders have been flying fast and furious from President Trump, generating optimism that there will be an unleashing of animal spirits. This sentiment largely centers around the investment lift that might flow from deregulation, be it within finance, energy, or artificial intelligence. For economists, these ripple effects are difficult to accurately observe and quantify within a near-term forecast of one-to-two years. Forecasters have a stronger economic framework to assess changes that occur within income or corporate tax structures, or within direct government transfers.
However, we knew the delayering of regulation (and the resulting business optimism) was going to be a key pillar of the Trump administration, which is why we imparted a 30-basis point lift to our baseline GDP outlook back in mid-December. This was to mitigate against lowballing the forecast by only considering the more observable negative economic effects that flow from tariffs on producers and consumers. In the end, the two impacts cancelled each other out within our forecast that reflects a 2% expansion in each year of 2025 and 2026.
This is a step down in economic momentum from the administration years of both Biden and Trump’s first term. Those three-year periods had near identical real GDP growth, averaging 2.7%. This excludes the pandemic years for both (2020-2021), which depressed the economy in Trump’s final year of presidency, while Biden benefited from an exaggerated rebound created by a collision of forces: the elimination of mobility restrictions, pent-up demand and historic amounts of excess savings.
So why a forecast anchored towards 2%?
First, this isn’t an out-of-consensus view. Since mid-December, when our forecast was conducted, little has changed on the economic assessment despite the flurry of executive orders. This is partly because the President was transparent on policy direction long before officially taking office. It’s also partly because forecasters are waiting for greater clarity on key policy pillars, like tariffs against each country or the observable effects of deregulation on investment. Bloomberg consensus for real GDP among those submitting forecasts on January 24th averaged 2.2% for 2025, with a 2.0% prediction for 2026. This will evolve but it’s hard to ignore that forecasts are rooted to the 2% threshold instead of, say, 3%.
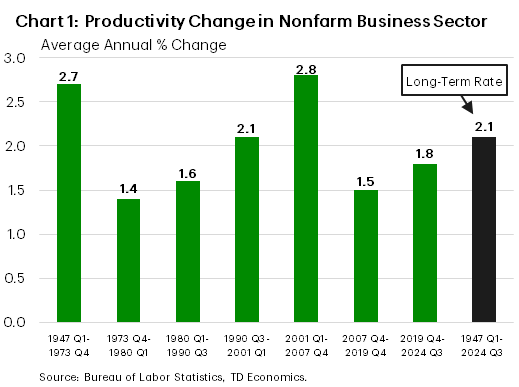
This is due to the simple arithmetic that economic momentum is driven by the combination of growth in labor productivity and the labor force. The latter has a gravitational pull towards near-zero due to aging demographics. And this condition will not be improved through the deportation of undocumented migrants who were engaged in the workplace. This places more emphasis on productivity, which historically reflects fewer periods of sustaining miracle growth near the 3% mark. However, it has certainly been done (Chart 1).
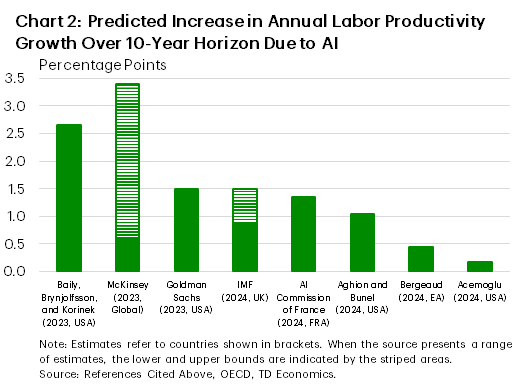
Artificial Intelligence, particularly GenerativeAI, offers the most promise in supercharging productivity growth. But here too, forecasters are cautious in jumping the gun when faced with optimism rather than hard-core evidence. Studies have shown large gains in worker performance within certain business tasks when AI is adopted, but that doesn’t mean narrow applications of success stories would apply to the economy at large, or that all sectors can equally benefit. Across those who’ve dared to estimate the potential impact, the range is wide (Chart 2).1
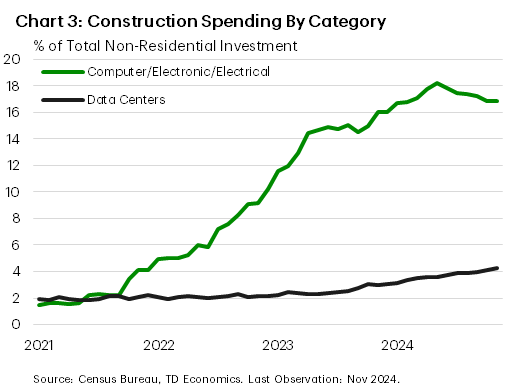
Regardless, AI won’t be a game-changer in the next 24 months given it’s in the early stages of development, let alone adoption. There will undoubtably be an economic tailwind from the development of its infrastructure, but as shown by DeepSeek developments in recent days, the prediction of the amount of AI investment will evolve. In other words, a forecast error is not necessarily skewed to the downside, and many forecasts, like ours, already embed this investment push. Growth in data centers and semiconductor facilities has dominated investment outcomes since 2021. Data centers have almost tripled in construction value in that short period. More impressive has been the astronomical growth in computer and electronics, which went from being 2% of all non-residential investment to a share of 17% today (Chart 3). So, there’s reason to maintain optimism around future investment. But that is a continuation of a story that began a few years back, already captured in the actual performance of the economy and represented in our forecast.
Turning to what’s holding back the economy
One reason the U.S. economy had ‘extraordinary’ growth relative to peer countries relates to the advantage created by growing on the back of a massive fiscal injection. This is captured by back-to-back years of Federal deficits of 6% of GDP despite a rising base of tax revenues. This size of deficits was, in fact, extraordinary, for an economy that was not in recession. Absent those deficits and the related contribution to economic growth, U.S. GDP would have expanded within a 2.0% to 2.4% range in the past two years. In other words, it would have tracked quite close to what forecasters are predicting for this year and next. The same goes for the years under Trump 1.0, when the Tax Cuts and Jobs Act (TCJA) was estimated to have boosted GDP in 2018 and 2019 by 30 basis points in each year. We are now moving to the opposite side of that fiscal growth-dividend push.
Look no further than the outline presented by House Republicans last week to find $2.5 to $3 trillion in government savings via spending cuts to an assortment of programs. This is in part to reign in run-away deficits and, importantly, to pay for the extension of the TCJA income tax cuts set to expire this year. The CBO estimates its price tag is $4.5 trillion over the next decade. Although necessary, taking away money from one segment of the population to pay for the TCJA will not provide the fiscal growth-dividend experienced in 2018 and 2019. The same goes for large savings that might come from DOGE initiatives, which we detailed in a recent report. If social security and Medicare are deemed “untouchables” then the largest savings that can be had would come from scaling back federal payments into Medicaid. But this would just shift the financial burden to either individual states or households. For the economy as a whole, there’s not a growth-dividend.
The status quo trap
Those TCJA income tax cuts are now the status quo. Households don’t view holding tax cuts in place in the same way as ‘found money’ when they are first put into place. The fiscal multiplier in paying for the extension is effectively zero. However, shifting money away from other segments of the economy to make those payments creates a negative fiscal multiplier in those areas, which creates a drag on economic growth. This is the ‘payback’ that naturally needs to happen following years of government overspending relative to its fiscal capacity.
There is a counterfactual argument to be made, however. Should all the TCJA tax cuts be allowed to expire, it would certainly create a drag to economic growth that could be larger than the effect of shifting money from other programs for its payment. That’s the art of redeploying the least efficient tax dollar and will be the source of debate among economists for years to come.
The same argument might be extended to the use of tariffs, which the administration views as an effective means to raising revenues, whether used to pay for the TCJA or other initiatives. Our baseline forecast assumes the U.S. effective tariff rate will rise from 3% to 7%. Doing so shaves 30 basis points from economic growth, which is equivalent to what we estimate the impact would be in allowing the TCJA tax cuts to expire. That tariff rate presumes in-kind retaliation from other countries. If that universal tariff rate is scaled to 10%, the economic hit rises to -50 basis points, and a 25% tariff scales it to -170 basis points.
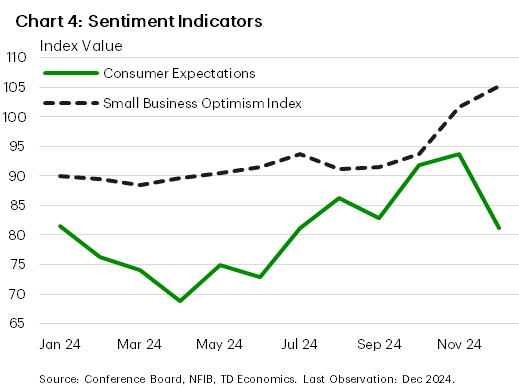
Even if the Trump administration deems tariffs to be the preferred or optimal funding solution, the government needs to tread carefully due to the high sensitivity of households to any rise in domestic prices. Since the election, businesses have conveyed enthusiasm for the new administration, but household sentiment has dropped, indicating trepidation over the prospect for higher consumer prices (Chart 4). History has shown price-sensitivity tends to be most acute or observable in areas that households purchase frequently, like gasoline and food, or where there’s an inability to easily substitute, like shelter costs. With an executive order to address the cost-of-living crisis, tariffs are likely to run afoul to that goal.
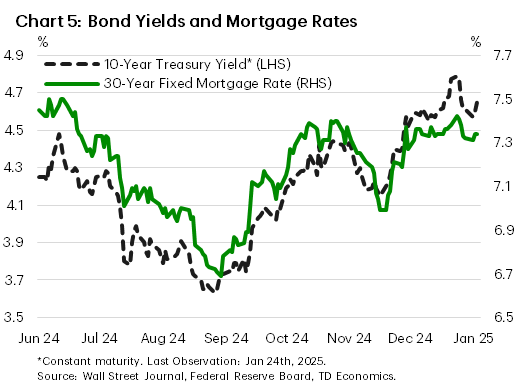
Lastly, interest rates cuts are not going to save the day. Financial markets have their own concerns on the trajectory of government policy, debt, inflation and the risk environment. Since the Federal Reserve cut interest rates by 100 basis point, bond yields have gone in the opposite direction due to a rising term premium. Today, a 30-year mortgage rate is higher than in July 2024, when the Fed policy rate was sitting at a peak of 5.50% (Chart 5). So even the central bank is failing to get a growth-dividend from its monetary policy easing, or at least a smaller one than is historically the case.
The bottom line from all of this is that a good reason why the U.S. had extraordinary GDP growth relative to peer countries was precisely related to initiatives that dug government finances into a deeper hole. Filling that hole requires a tradeoff. If AI can be the next source of extraordinary growth in the economy and productivity, then it must do so at little cost to government finances via incentives, because that dance card is already looking full.
Disclaimer
This report is provided by TD Economics. It is for informational and educational purposes only as of the date of writing, and may not be appropriate for other purposes. The views and opinions expressed may change at any time based on market or other conditions and may not come to pass. This material is not intended to be relied upon as investment advice or recommendations, does not constitute a solicitation to buy or sell securities and should not be considered specific legal, investment or tax advice. The report does not provide material information about the business and affairs of TD Bank Group and the members of TD Economics are not spokespersons for TD Bank Group with respect to its business and affairs. The information contained in this report has been drawn from sources believed to be reliable, but is not guaranteed to be accurate or complete. This report contains economic analysis and views, including about future economic and financial markets performance. These are based on certain assumptions and other factors, and are subject to inherent risks and uncertainties. The actual outcome may be materially different. The Toronto-Dominion Bank and its affiliates and related entities that comprise the TD Bank Group are not liable for any errors or omissions in the information, analysis or views contained in this report, or for any loss or damage suffered.
Download
Share: