Highlights
- Battery electric vehicles have significantly lower lifecycle emissions than gasoline vehicles. While electric vehicles start off with a higher carbon footprint due to emissions associated with battery production, fuel-related emissions of gasoline vehicles are far greater and drive the emissions gap between the two vehicle types.
- Plug-in hybrid electric vehicles also generally have lower emissions than pure gasoline vehicles, but their emissions savings are smaller than those of battery electric vehicles and depend on how much driving is done in electric versus gasoline mode.
- Emissions benefits of electric vehicles vary based on the emissions intensity of the electricity system. Even in provinces/territories dependent on fossil fuel electricity generation, battery electric vehicles still produce lower emissions as they use less energy than internal combustion engine vehicles to move the same distance.
- The lack of affordable electric vehicle models and the rollback of rebate programs could slow down the pace of the transition towards EVs and emissions reduction from wider adoption.
Electric vehicles are the main technology that countries are relying on to reduce greenhouse gas emissions from the transportation sector. While battery electric vehicles (BEVs) are known to not produce any tailpipe emissions, questions often arise over whether they are indeed better for mitigating climate change considering emissions from battery production and electricity generation. Answering this question requires looking at lifecycle emissions, which provide a more comprehensive view of direct and indirect emissions associated with different types of vehicles. This type of analysis incorporates emissions from the vehicle manufacturing process, extraction of the raw materials used as inputs, production and consumption of fuels that power the vehicle as well as maintenance and end of life disposal of the vehicle.
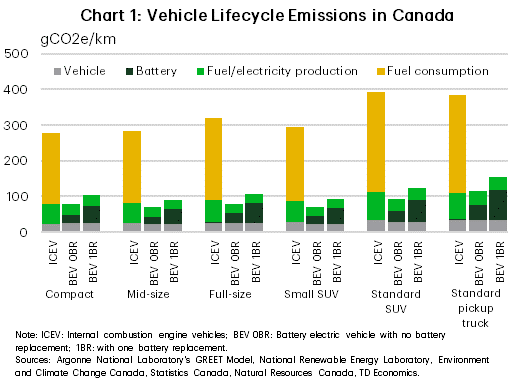
Overall, lifetime emissions are lower for BEVs relative to pure internal combustion engine vehicles (ICEVs). For the Canada-wide electricity grid mix, the average emissions savings of BEVs range from 70% to 77% across different vehicle classes. This relationship holds even in a scenario where the lithium-ion battery of the BEV is replaced before the vehicle reaches its end of life though the average emissions savings decline to 59-69% (chart 1). Plug-in hybrid electric vehicles (PHEVs) also produce less emissions than ICEVs. However, their emissions benefits are lower than those of full electric vehicles.
For both BEVs and PHEVs, fuel-related emissions vary based on the carbon intensity of the electricity grid in which the vehicle batteries are recharged. In other words, the cleaner the grid, the higher the emissions savings. This also means that the emissions benefits of BEVs and PHEVs will increase over time as electricity grids are decarbonized. Additionally for plug-in hybrids, the higher the share of electric mode driving versus gasoline mode driving, the better the emissions reduction benefits in general.
Vehicle emissions higher for BEVs but are dwarfed by the higher fuel emissions of ICEVs
Lifecycle emissions of vehicles can be roughly categorized into two major buckets. The first category are emissions related to the production of the vehicle and its components (vehicle cycle emissions). In addition, emissions from vehicle maintenance and end-of-life disposal or recycling can also be included in this category. The second bucket covers emissions that are related to the production and consumption of fuels such as electricity, gasoline or diesel that provide the energy that moves vehicles from point A to B (fuel cycle emissions).
Comparing the 2024 model year vehicles, battery electric vehicles have higher vehicle cycle emissions while fuel cycle emissions1 are greater for ICEVs. However, because fuel emissions of ICEVs significantly exceed BEV vehicle cycle emissions, the lifetime emissions of ICEVs generally exceed those of electric vehicles (chart 1).
Batteries are responsible for higher vehicle production emissions of electric vehicles
Vehicle cycle emissions of battery electric vehicles are about twice as high as those of gasoline vehicles and the difference can be largely explained by lithium-ion batteries. Based on estimates derived using the Argonne National Laboratory’s GREET model, batteries account for about half of BEV vehicle cycle emissions when the vehicle uses one lithium-ion battery over its lifetime, but this share rises to over 60% if the battery is replaced. Lithium-ion batteries require vast quantities of minerals such as lithium, nickel, copper, cobalt and graphite to manufacture. Mining and refining these minerals is energy and emissions intensive. Additionally, producing battery chemical components needs extremely high temperatures, which are normally achieved by burning fossil fuels.
However, the carbon footprint of batteries largely depends on the energy mix used in the production location of the battery and its inputs. For instance, one estimate suggests that emissions of battery cells produced in Sweden are about a quarter lower than those of cells produced in China.2 As China currently dominates the global battery supply chains, its coal-heavy energy mix is a leading determinant of battery emissions. But this also means emissions from battery manufacturing are likely to decline over time as low-emissions jurisdictions like Canada increase their market share.
Better energy efficiency plus clean electricity lead to lower fuel emissions for BEVs
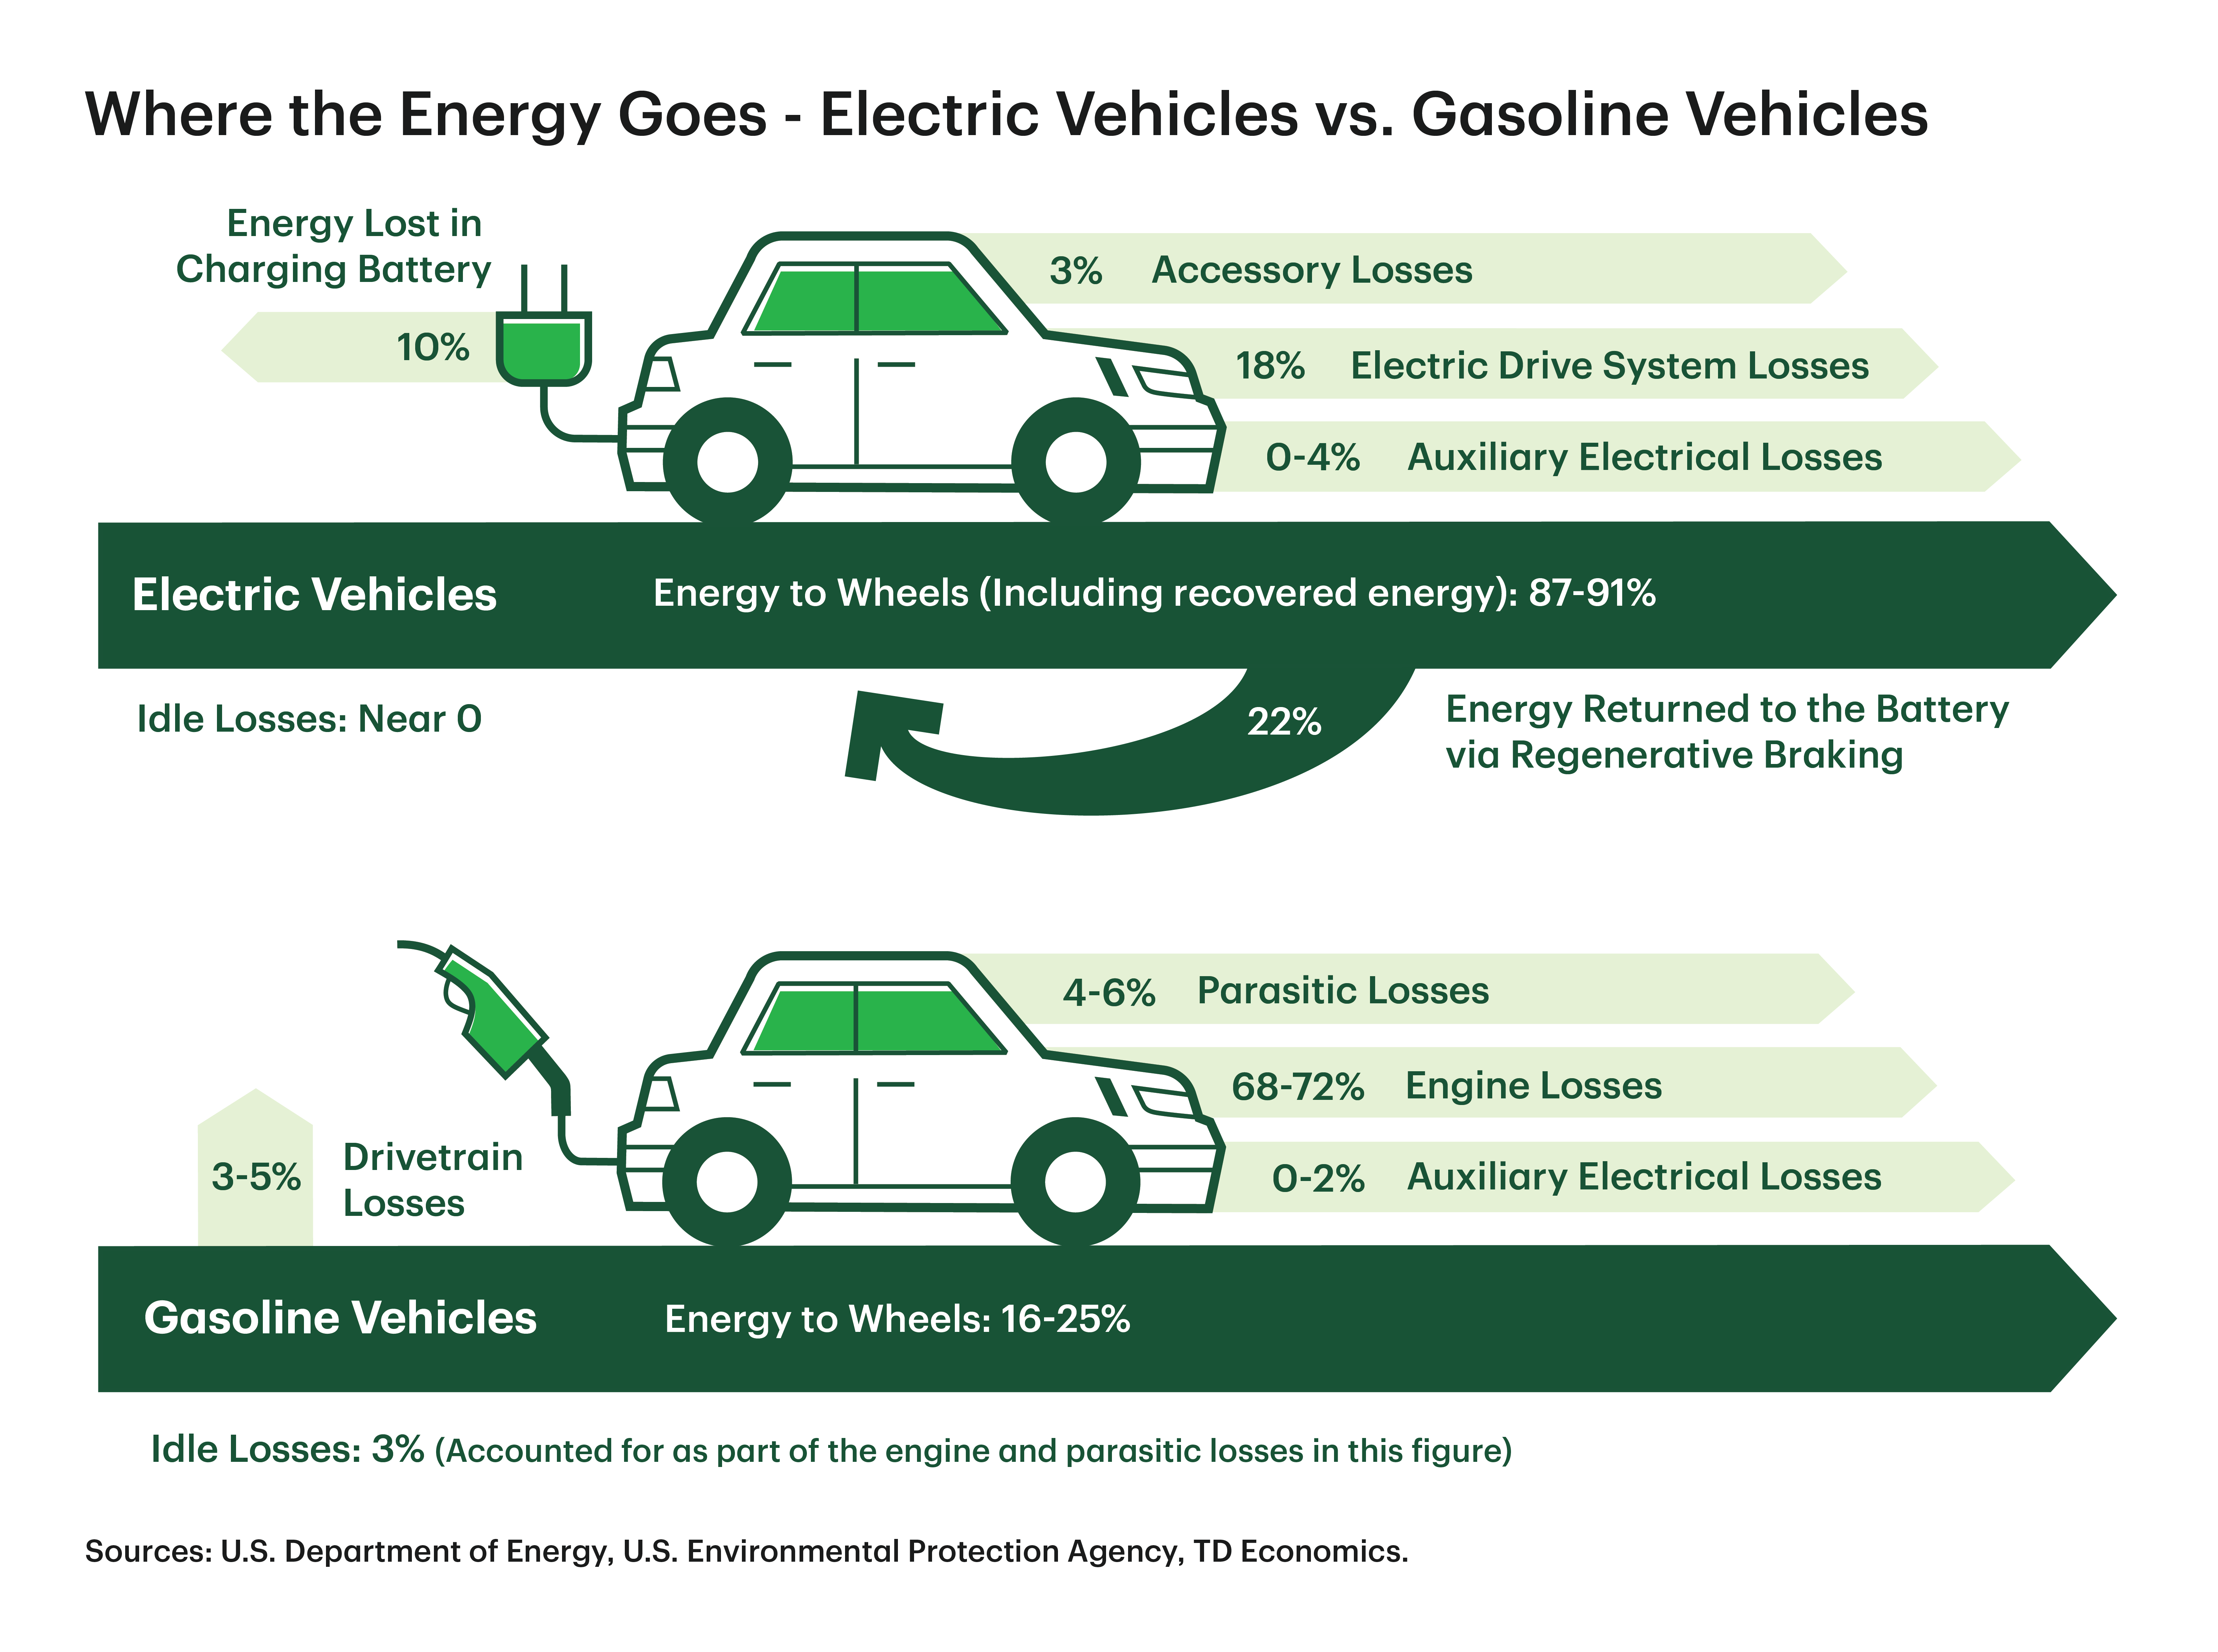
Battery electric vehicles are also more energy efficient during operation, meaning gasoline vehicles use more energy to move the same distance. The difference in energy efficiency is stark. Just 16-25% of the energy in gasoline is used to move an ICEV while 87-91% of the energy in electricity is used to move a BEV (graphic).3 So kilometer for kilometer, ICEVs consume more fuel and produce more emissions. Among 2024 standard SUV models, gasoline models consume 6.7-21.7 litres of gasoline per 100 km.4 In contrast, the electric versions use 20.9-44.6 kWh, which is equivalent to 2.3-5 litres of gasoline in terms of energy content.5 On average, a standard gasoline SUV uses around four times as much energy as the electric model per distance traveled.
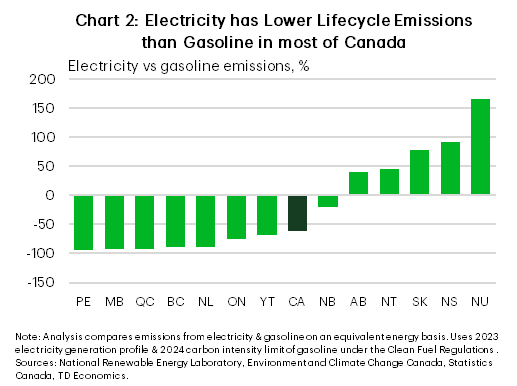
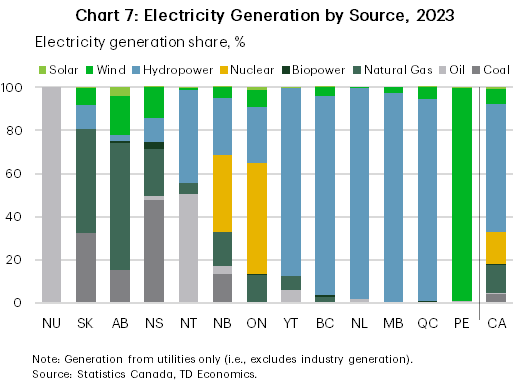
In addition, electric vehicles also benefit from the low-emissions intensity of electricity generation relative to gasoline in most parts of Canada. Comparing the lifecycle emissions of the two fuels on an equivalent energy basis, grid electricity emissions are 61% lower than those of gasoline at the national level and 20%-93% lower in the 8 provinces/territories whose grid electricity is cleaner than gasoline.6 A handful of provinces and territories have grids that are more emissions intensive than gasoline based on the 2023 domestic electricity generation profile (chart 2). That said, even in this latter group, most electric vehicles still have lower fuel-related emissions and lifetime emissions than comparable gasoline vehicles because they use less energy during operation. (See appendix for a breakdown of electricity generation by fuel type).
Emissions benefits of battery electric vehicles vary by region
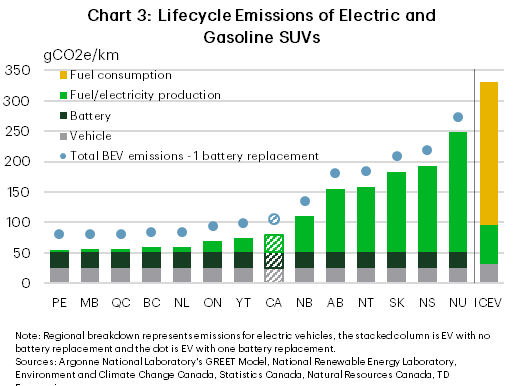
Looking at the combined vehicle cycle and fuel cycle emissions together, the emissions advantage of driving a full electric vehicle over a gasoline vehicle differ by region depending on the carbon intensity of the electricity grid (chart 3). Using SUVs as an example, BEV lifecycle emissions are 76% lower on average at the national level compared to gasoline SUVs. Regionally, the savings range from 25% in Nunavut, which generates power from petroleum, to 78-83% in the regions that generate most of their electricity from hydroelectric facilities (i.e., Quebec, Manitoba, British Columbia, Newfoundland and Labrador and Yukon). Emissions savings are also around 80% in Ontario, where nuclear, hydro and renewables account for nearly 90% of domestic electricity generation. Though wind accounts for virtually all the electricity generated in Prince Edward Island, the province imports about 70% of the electricity it consumes from New Brunswick.7 Therefore, BEV emissions in Prince Edward Island are probably closer to those estimated for New Brunswick than is suggested by domestic generation.
Although Nova Scotia, Saskatchewan, Alberta, Northwest Territories and Nunavut have electricity grids that are more emissions intensive than gasoline (chart 2), battery electric vehicles are still beneficial for reducing transportation emissions (chart 3). This is because electric vehicles on average require less energy to operate than gasoline vehicles, which offsets the higher emissions content of electricity versus gasoline in these regions.
A key factor for electric vehicle lifecycle emissions is whether battery degradation over time will require replacement. At this point, it is unclear how long lithium-ion batteries last given approximately 85% of BEVs registered in Canada since 2011 (as of Q3 2024) were sold in the last five years.8 However, even the inclusion of a battery replacement only reduces the emission savings by a small margin (Chart 3). The emissions savings for SUVs decrease to 68% at the national level while the savings range for the provinces and territories declines to 17% to 75%.
ICEV emissions are expected to decline under the current Clean Fuel Regulations, which are designed to reduce the carbon intensity of gasoline and diesel.9 However, electric vehicles still come out ahead even when comparing emissions from the current electricity supply mix to ICEV emissions that would be generated if the carbon intensity of gasoline falls to the threshold required under the regulations for 2030 and subsequent years. Under this scenario, electric SUV lifecycle emissions would still be lower by 18-81% (9-73%) in the different provinces and territories and by 74% (65%) nationally with no lithium-ion battery replacement (with one battery replacement).
PHEVs also reduce emissions but at a smaller scale than full electric vehicles
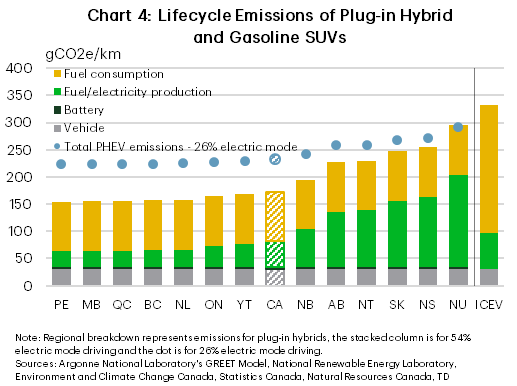
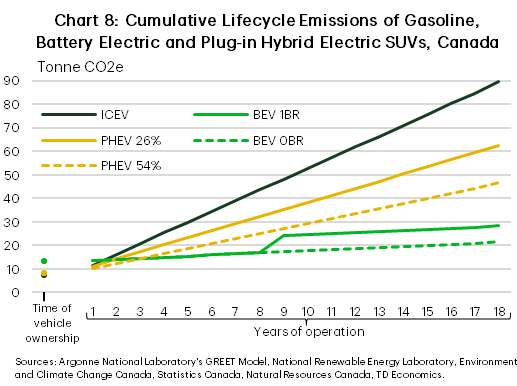
Plug-in hybrid electric vehicles have lower emissions on average compared to ICEVs, but their emissions benefits are smaller than those of battery electric vehicles (See appendix). The added consideration for emissions savings is the degree to which plug-in hybrids spend in electric-mode driving versus gasoline-mode driving. A BloombergNEF study found that private PHEVs spend 26-54% in electric mode driving, while company cars are driven in electric mode 11-24% of the time.10
Focusing on privately-owned SUVs, driving in electric mode 54% of the time reduces lifecycle emissions by 11-53% on average relative to an ICEV in different parts of the country, while driving in electric mode 26% of the time yields average emissions savings of 12-33% (chart 4). Emissions savings from higher electric mode driving are greater the cleaner the grid.
BEV emissions lower at same price levels but there is a need for more affordable models
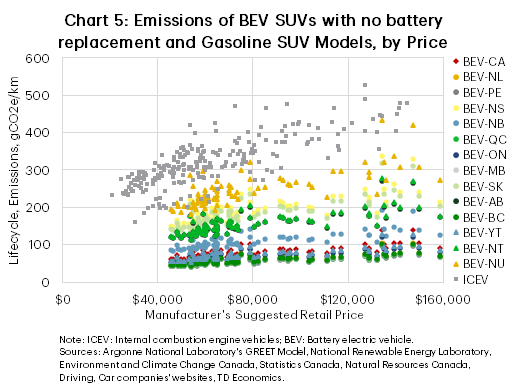
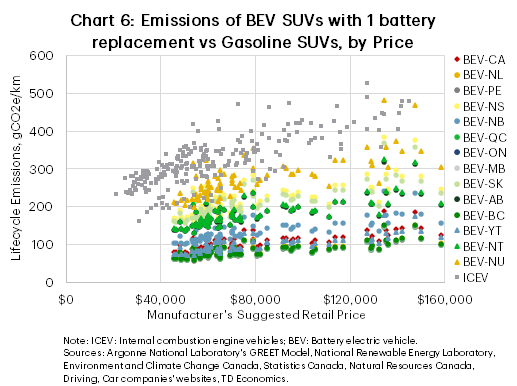
The average emissions estimates by vehicle class obscure variations across different vehicle models and price ranges. Vehicle purchase price is one of the main factors consumers consider when making a decision about which vehicle to buy and is often cited as a barrier to buying electric vehicles.
Across the price ranges where there is an overlap of electric and gasoline vehicles, most battery electric models have lower lifecycle emissions than comparable gasoline models, except for a handful of models in jurisdictions with high-emitting electricity grids (charts 5 and 6). However, among the 2024 vehicle models used in the analysis, there is a dearth of BEV models below $40,000 for both SUVs and passenger cars and below $60,000 for pickup trucks. This deficiency makes it difficult for consumers who cannot afford the more expensive models to switch to electric vehicles. The recent end of the federal zero-emission vehicles rebate program and expected rollback of the existing subnational programs is likely to worsen the affordability problem for electric vehicles and affect adoption.
Bottom line
Battery electric vehicles can play an important role in helping to decarbonize the transportation sector as they provide substantial emissions savings relative to internal combustion engine vehicles. Even in the provinces and territories that have high emitting electricity generation, full electric vehicles in general have lower lifecycle emissions. The variance in lifecycle emissions due to differences in the carbon intensity of the regional electricity supply mix points to the additional emissions savings that could be generated as the electricity sector is decarbonized.
While plug-in hybrid electric vehicles can also be beneficial for transportation sector emissions reduction, they provide lower emissions savings than fully electric vehicles. In addition, plug-in hybrids are better at reducing emissions if most of the driving is done in electric mode and they provide diminished benefits if the electric mode is used infrequently.
Finally, there is a need for more affordable electric models in the market to compete with lower-priced gasoline vehicles and expand access to consumers who purchase vehicles in the lower price ranges. As well, the lack of lower-priced electric vehicles indicates the need for extending rebate programs to help improve affordability for lower-income buyers.
Appendix
End Notes
- Fuel emissions analysis assumes annual driving distance of 15,000 km and a vehicle lifespan of 18 years. It also uses 2023 electricity generation data from Statistics Canada and lifecycle emissions factors for electricity generation technologies from the National Renewable Energy Laboratory, and the carbon intensity of gasoline from the federal Clean Fuel Regulations (2024 limit) and Environment and Climate Change Canada’s Fuel LCA Model. Data on the fuel efficiency of various vehicle models comes from Natural Resources Canada.
- Benchmark Mineral Intelligence, How low can battery emissions go? (May 2, 2024)
- U.S. Department of Energy, Where the Energy Goes: Gasoline Vehicles & Electric Cars
- Natural Resources Canada, Fuel consumption ratings
- A liter of gasoline is estimated to contain the same quantity of energy as approximately 8.9 kWh of electricity.
- This comparison uses domestic generation and ignores electricity trade between the provinces and territories and with U.S. states. Electricity trade and supply mix of the total electricity consumed would be especially relevant for a place like Prince Edward Island which imports most of the electricity consumed within the province.
- Environment and Climate Change Canada, Prince Edward Island: Clean electricity snapshot
- Statistics Canada, New motor vehicle registrations, quarterly & annual (inactive)
- Environment and Climate Change Canada, Clean Fuel Regulations
- BloombergNEF, Tracking the Revival of Plug-In Hybrids (July 9, 2024)
Disclaimer
This report is provided by TD Economics. It is for informational and educational purposes only as of the date of writing, and may not be appropriate for other purposes. The views and opinions expressed may change at any time based on market or other conditions and may not come to pass. This material is not intended to be relied upon as investment advice or recommendations, does not constitute a solicitation to buy or sell securities and should not be considered specific legal, investment or tax advice. The report does not provide material information about the business and affairs of TD Bank Group and the members of TD Economics are not spokespersons for TD Bank Group with respect to its business and affairs. The information contained in this report has been drawn from sources believed to be reliable, but is not guaranteed to be accurate or complete. This report contains economic analysis and views, including about future economic and financial markets performance. These are based on certain assumptions and other factors, and are subject to inherent risks and uncertainties. The actual outcome may be materially different. The Toronto-Dominion Bank and its affiliates and related entities that comprise the TD Bank Group are not liable for any errors or omissions in the information, analysis or views contained in this report, or for any loss or damage suffered.
Download
Share: