Highlights
- Canada’s job market will continue to cool in 2024, but it should hold up better than in previous cyclical downturns. Climbing unemployment rates across the nation will be dominantly driven by still-solid growth in labour supply as opposed to a mass deterioration in hiring.
- Pockets of public-sector industries are still notably tight. Meanwhile, private-sector hiring has slowed markedly over the past several months.
- Wage growth is still running too hot, but it is expected to moderate as employment slows, unemployment tracks higher, and job vacancies decline further. However, rising union wages may delay this moderation.
- Across the provinces, Alberta and the Atlantic region should outperform as still-decent employment growth can better keep pace with labour force gains. Ontario, Quebec, and British Columbia (B.C.) will likely suffer from a more pronounced slowdown in hiring.
Canada’s job market has been holding up well against the Bank of Canada’s (BoC) historic monetary tightening campaign. For one, employment in the nation last year managed to grow at an above-trend 2.4%, roughly equivalent to 500k net new jobs. And while private-sector job creation has ratcheted down significantly in recent months, mass job losses have failed to materialize as some forecasters had been anticipating. Instead, weaker hiring has helped to unwind some of the excess tightness in the nation’s labour market and pressure up the unemployment rate up to 5.8%–a rate firmly in line with 2019 levels.
Across the provinces last year, British Columbia (B.C.), Newfoundland & Labrador (N.L.) and Saskatchewan lagged in employment growth relative to the nation. Still, at between 1.6–1.8%, hiring in those jurisdictions advanced at a decent clip. Meanwhile, sizzling population growth in Alberta, Manitoba, and most of the Maritime provinces supported impressive job creation of more than 3.0%, fueling their economic expansions. Ontario and Quebec fell somewhere in the middle – a solid year of hiring but with unemployment rates rising at a pace quicker than most regions.
Looking ahead to 2024, a continued cooling in overall labour market conditions is to be expected, but adjustments may play out differently than in previous cyclical slowdowns. Here are a few key trends to watch for.
Increasing Labour Supply Will Remain the Driving Force for Higher Unemployment Rates
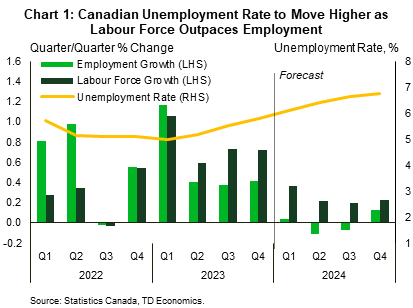
In past economic downcycles, rising unemployment rates were primarily driven by periods of prolonged and steep employment contractions. In 2024, we still see some deterioration in labour demand feeding into higher unemployment rates. But as has been the case since mid-2023, labour supply will be the dominant driver of higher unemployment across the country (Chart 1).
This supply-driven dynamic is likely to persist even as labour force gains slow sharply on the back of weaker job prospects and a moderate pull-back in immigration rates from last year’s historic pace. However, net employment gains – projected to effectively hit the wall on a Q4/Q4 basis this year – are likely to weaken to a greater degree.
Against this backdrop, we see scope for a further rise in the national unemployment rate to 6.7% by Q4-2024, before turning around and heading slightly lower in 2025. This figure is above our estimate of the longer-term jobless rate consistent with non-inflationary growth, 5.9%, but still well below peak levels of past cycles.
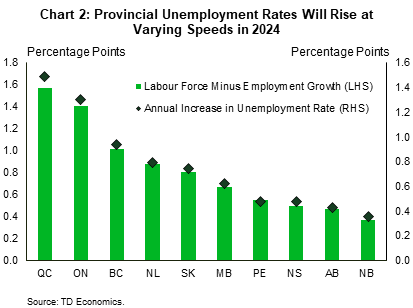
Across the provinces, unemployment rate trends will continue to play out very differently. Chart 2 highlights how the pace of rising provincial unemployment rates could shake out as a result of the dispersion between labour force growth relative to employment. It is worth noting that in 2023, employment growth in every province outpaced their respective labour force growth rates. In 2024, all provinces will see a flip to higher labour force growth rates relative to those of employment. Quebec, Ontario, and B.C. could see their average annual unemployment rates rise by around 1.0–1.6 ppts in 2024 as wedges between labour force and hiring remains comparatively large. Meanwhile, more moderate upward moves in unemployment rates are expected in Alberta and the Atlantic provinces, as the prospects for still-decent employment can better keep pace with labour force growth. For a more thorough discussion detailing the provincial divide in Canada’s job market, see our recently released report.
Some Sectors Should Hold Up Better Than Others
Similar to regions, divergences are likely to continue to play out across sectors. Relative to the 2015–2019 period, labour demand for certain industries remains elevated notwithstanding a near 40% decline in overall job vacancies from 2022 peak levels. Chart 3 shows that hiring appetite is still present in public services industries (health care, public administration, and education), as well as oil & gas, and construction sectors. This bodes particularly well for the Maritime provinces, whose job base is more centered around the public services sphere. With labour demand looking stronger in these sectors, these jurisdictions should continue to maintain an edge on hiring over the nation. Joining the ranks of Canada’s east coast is Alberta and Saskatchewan, whose oil, gas, and mining industries are still suffering from worker shortages, which should continue to prop up employment over the coming quarters.

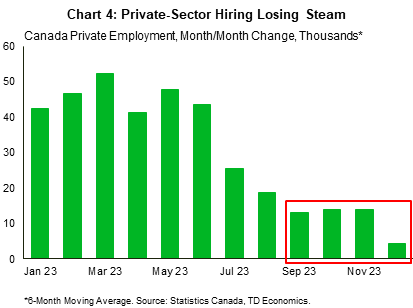
On the flip side, employers have taken their foot off the hiring accelerator in industries such as finance, insurance and real estate, professional services, and manufacturing. In these industries, vacancy rates have nearly normalized back to pre-pandemic levels, which compares to an all-industry average where vacancies remain as much as 50% above historical averages. Further, chart 4 shows the extent to which private-sector hiring has decelerated in recent months. Given Ontario, B.C., and Quebec’s exposure to these sectors, annual employment growth is likely to be weaker in these jurisdictions. We also believe these sectors are more vulnerable to net job losses this year, although our baseline still anticipates staffing to be held effectively steady on annual average basis.
Wage Growth Will Broadly Ease
Total wage growth in Canada is still running hot, printing at 5.5% year-on-year (y/y) in December, the highest rate of growth in 13-months. While this pace is down from a pandemic peak of 8% y/y, it remains more than twice as high as the 2011-19 average. Moreover, factoring in weak productivity trends, the current pace of wage growth is even more unsustainable and inconsistent with the central bank’s 2% inflation target. Declining productivity tends to add to the inflation pressures coming from higher wages via higher unit labor costs.
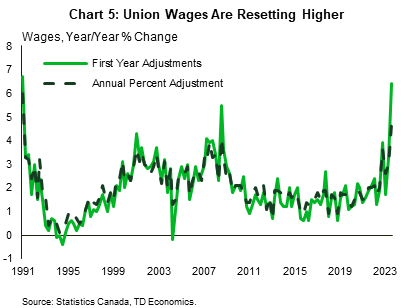
Looking ahead, we anticipate national wage growth to cool as employment slows, unemployment tracks higher, and job vacancies decline. However, rising union wages – which tends to lag the job market cycle–may delay this moderation. In Canada, the workforce is nearly 30% unionized, triple the 10% level in the United States. Quarterly data show that first-year wage adjustments of renegotiated multi-year contracts have reached 6.4% as of Q3-2023, their highest level since 1991. Further, the annual average wage adjustment over the entire duration of renegotiated agreements has pushed up to 4.7% as of Q3-2023, also the highest level since 1991 (Chart 5). For reference, union contracts are extended for 3-4 years on average. As a result, unionized workers are beginning to cement years of aggressive wage gains above the BoC’s target.
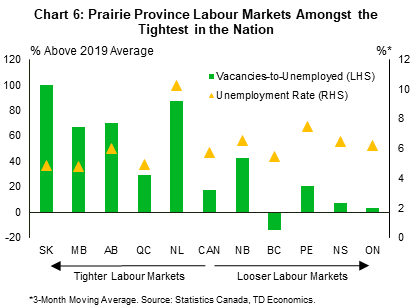
Wages pressures will likely come off the boil at different speeds across jurisdictions. Provinces with relatively tight labour markets – defined as having an elevated vacancies-to-unemployed ratio as well as low unemployment rates – will likely have wage gains that are slower to adjust back to more pedestrian levels (Chart 6). Saskatchewan, Manitoba, Quebec, and Alberta continue to boast relatively high job vacancy rates alongside low unemployment rates. This puts these provinces amongst the tightest in the nation, suggesting a potentially stickier decent for wage normalization. Aside from Alberta, which has the lowest unionization rate in the country (24.9%), these other jurisdictions sport unionization rates above the national average, also putting pressure on wage normalization. On the other hand, B.C., Ontario, Nova Scotia and PEI labour markets have been quicker to come into balance, suggesting wages in these jurisdictions could moderate more quickly over the coming quarters.
Participation Rates to be Pressured Downwards
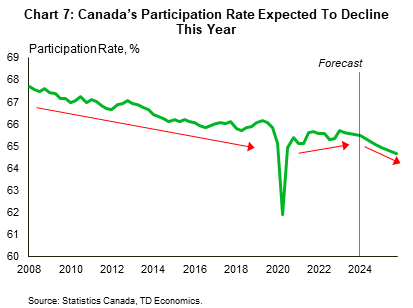
As Canada recovered from the COVID-19 pandemic, strong population growth helped meet the high demand for workers, leading to a temporary uptrend in participation rates. Historic immigration flows pushed a number of people into the core working-age population, 25–54 year olds, the cohort with highest participation rates. To meet labour force needs, temporary foreign worker, and to a lesser extent, economic-driven permanent residents accounted for most of the immigration in recent years. As Chart 7 shows, this helped the three-year period between 2020 –2023 buck the trend of the broader participation rate decline that’s been in place since the ‘08–’09 financial crisis.
Now, participation rate trends have flattened out. Population aging—principally, the aging of the large cohort of people born during the baby boom era—will begin to reassert itself as one of the dominant factors putting downward pressure on the labour force participation rate. The ageing population trend, combined with other structural factors including longer lengths to attain education and a growing base of discouraged workers, will continue to push participation rates lower over the near term.
Bottom Line
Canada’s labour market is relatively well positioned to handle the coming macroeconomic slowdown. Unlike in past downturns, and barring any major unforeseen events, continued but slowing hiring absent substantial economy-wide layoffs should remain a focal point. That said, national and provincial unemployment rates will drift higher over the year, primarily as a consequence of growing labour supply. Wages will likely be the last shoe to drop but should normalize as labour demand fades. Meanwhile, participation rates may continue on their historical downward trend.
The Prairie and Atlantic provinces are positioned to outperform the nation. Employment should be better supported in these provinces as core industries continue to suffer from acute labour shortages, while more durable population growth helps to fill gaps in their labour markets. On the other hand, Ontario, B.C. and Quebec will likely undergo more sluggish hiring trends.
Disclaimer
This report is provided by TD Economics. It is for informational and educational purposes only as of the date of writing, and may not be appropriate for other purposes. The views and opinions expressed may change at any time based on market or other conditions and may not come to pass. This material is not intended to be relied upon as investment advice or recommendations, does not constitute a solicitation to buy or sell securities and should not be considered specific legal, investment or tax advice. The report does not provide material information about the business and affairs of TD Bank Group and the members of TD Economics are not spokespersons for TD Bank Group with respect to its business and affairs. The information contained in this report has been drawn from sources believed to be reliable, but is not guaranteed to be accurate or complete. This report contains economic analysis and views, including about future economic and financial markets performance. These are based on certain assumptions and other factors, and are subject to inherent risks and uncertainties. The actual outcome may be materially different. The Toronto-Dominion Bank and its affiliates and related entities that comprise the TD Bank Group are not liable for any errors or omissions in the information, analysis or views contained in this report, or for any loss or damage suffered.
Download
Share: