Electrifying the Future: Solving the challenge of connecting new solar and wind projects
Likeleli Seitlheko, Economist
Mekdes Gebreselassie, Research Analyst
Date Published: September 14, 2023
- Category:
- Canada
- Future Ready Economy
Highlights
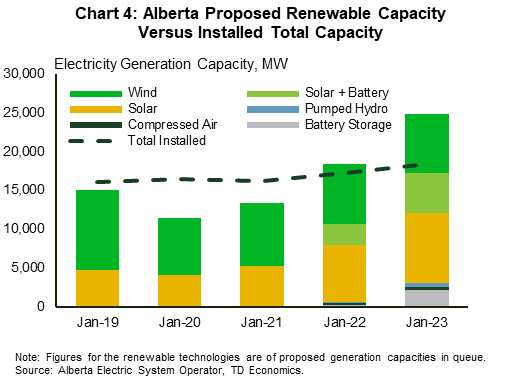
- Emissions reduction pathways are reliant on decarbonizing and expanding the electricity sector. In recent years, favorable economics and climate policy commitments have increased the demand for renewable energy, giving cause for cautious optimism. For instance, in Alberta, the proposed capacity from non-emitting resources awaiting approval to connect to the grid now exceeds installed capacity in the province.
- However, the challenges of connecting new generation projects to the grid could slow down the pace of grid decarbonization if unaddressed. Among other things, the recent surge in the number and capacity of projects applying to be connected to the grid has led to longer processing timelines, a problem that is often exacerbated by the lack of sufficient spare grid capacity.
- Limited grid infrastructure can result in high interconnection costs as it often means that extensive network upgrades are required before projects can be connected to the grid.
- In many jurisdictions, cancelled projects have higher average interconnection costs than completed projects or those with active applications, which suggests that high connection costs could be one of the factors behind projects getting cancelled.
- Connecting solar and wind capacity levels needed to reach net-zero grids by 2035 could require as much as $25-50 billion in transmission investments. This includes spending on new interconnection facilities, network upgrades to existing transmission infrastructure, new high voltage lines to connect renewable rich areas and upgrades to inter-regional transmission capacity.
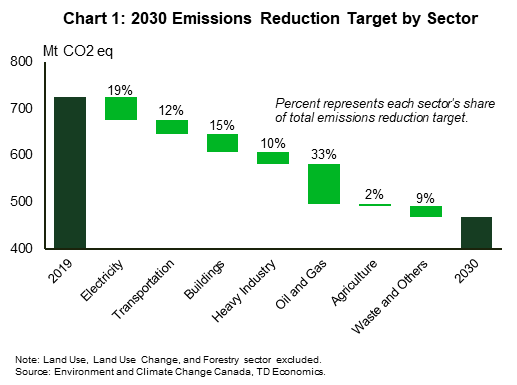
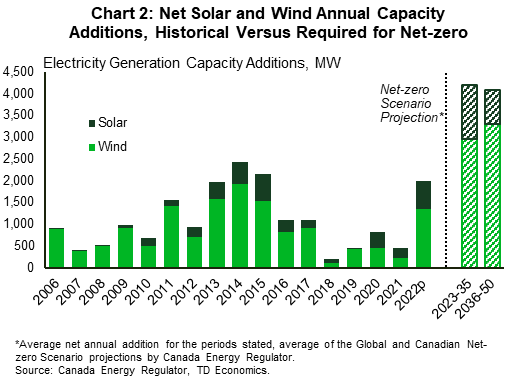
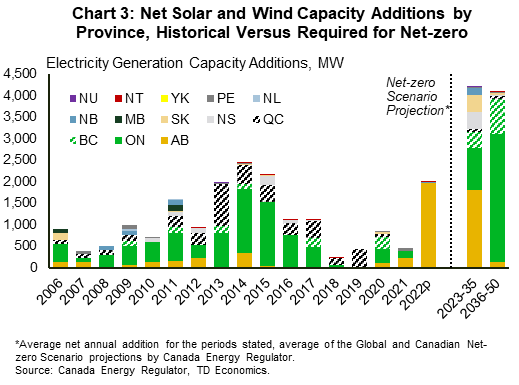
The electricity sector is expected to play a significant role in contributing to emissions reduction directly through the decarbonization of generation and indirectly through supporting the electrification of the transportation and other sectors. In Canada, around 19% of the total emissions reduction target set by the federal government for 2030 comes from the electricity sector, with an aggressive target of net zero in the sector by 2035. Meanwhile, the transportation sector contributes 12%, with the adoption of electric vehicles dependent on growing electricity generation (Chart 1). According to the Canada Energy Regulator (CER), Canada's installed capacity from low-carbon resources could increase by around 60% by 2035 and about 130% by 2050 from current levels under net-zero pathways.1 Solar and wind account for about three-quarters of the new low-carbon generating capacity to be installed. The recently released federal draft Clean Electricity Regulations are expected to drive this trend in the changing mix of generation assets once implemented, but broader regulatory certainty particularly as it pertains to federal-provincial alignment will be essential to incentivize private sector investment. Reaching capacity levels projected for 2035 under the CER's net-zero scenarios would require doubling average annual solar and wind net capacity additions from the 2022 level between now and 2035 (Chart 2 and Chart 3). However, a key factor in supporting such sizeable growth in renewable power generation will be to connect these new assets to the grid, which we estimate could require upwards of $25-50 billion in transmission investments alone by 2035. Other investments in grid infrastructure that will be required are not incorporated in this estimate. These include expenditures to support load growth, expand the distribution system and upgrade aging transmission and distribution infrastructure.
Moreover, there are underlying issues that could hamper the deployment of new renewable energy capacity. These include longer timelines for connection approvals due to the surge in the volume of projects seeking to be connected to grid. In North America, projects currently take about five years from when they submit an interconnection request to when they reach commercial operation. This is often exacerbated by the lack of sufficient spare grid capacity, which could force projects to be on hold for years while the grid infrastructure is being upgraded. In addition, data from the US suggests that limited spare grid capacity has been driving up the cost of connecting new projects to the grid in recent years as extensive and expensive system upgrades are often required before projects can be connected. Jurisdictions in Canada such as Nova Scotia are also dealing with similar problems. High interconnection costs can lead to projects getting cancelled to the extent that they affect the financial viability of proposed projects. This is because for the most part, grid connection costs are hidden from developers when projects are initially proposed since actual costs only become clearer as projects go through the various interconnection studies.
There is a need to rethink the approach to grid decarbonization including through:
- Reforming the grid connection approval process to make it more efficient;
- Publishing more current data on spare grid capacity on a regular basis to create more transparency in the application process so that developers can better plan for new developments financially;
- Providing more government support for grid investments such as upgrading existing infrastructure and building new high voltage transmission lines to connect renewable rich areas to load centers; and
- Collaborating across all levels of government to address local consultation and engagement to ensure NIMBYism does not inhibit Canada reaching its net zero goals. Solving the land use challenges is especially important as solar and wind facilities have a large footprint.
Interconnection queues are overwhelmed by the rise in the number and capacity of projects seeking approval
The first challenge the sector faces is simply that the interconnection approval process has become long and arduous. Interconnection queue wait times are currently long in many regions, which could slow down the build out of renewable energy capacity and hinder decarbonization goals. The average time from an interconnection application submission to commercial operation has increased from less than two years in 2008 and three years in 2015 to five years currently for US projects.2 In Europe, the wait time to connect to the grid is as long as eight years in parts of France and as much as fifteen years in parts of the UK.3 More recent information in Canada is available from Alberta and the timelines are comparable to those in the US. Transmission-connected solar and wind projects that went online in the province in the last couple of years also took nearly five years to reach commercial operation from when they filed an interconnection request. This is in line with the completion timelines for Ontario's feed-in tariff program (FIT 1) projects that became operational during 2013-2018 and had filed a request to build transmission lines with the province's energy sector regulator.4
The longer wait times have been caused by the surge in the number and capacity of new projects seeking to be connected to the transmission grid, as well as limited spare capacity in some regions. For example, the amount of proposed capacity from wind, solar, storage and hybrid solar-storage systems in the interconnection queue in Alberta increased by 65% to approximately 25 GW between January 2019 and January 2023. There is more proposed capacity in the queue now than there is installed capacity in the province (Chart 4). While this is a positive development, the higher number of projects in interconnection queues has overwhelmed applications systems and led to longer processing times. Before any project can connect to the grid, it needs to undergo studies to assess its impact on the reliability of the grid, determine mitigation measures for any potential material adverse impacts and estimate interconnection costs. In some jurisdictions, the problem has been compounded by insufficient grid capacity, which means that projects have to wait long periods for the grid to be upgraded or expanded before they can be connected. An extreme example of this issue occurred in the PJM Interconnection, the regional authority managing the transmission system in 13 states in the US. Last year it suspended new applications so that it can clear the current backlog of grid connection applications and reform the application process.5
In addition to the question of how to get proposed projects built faster, there is also a need to ensure that the right conditions are in place to enable more of the projects to be developed. If data from the US is any indication of what to expect in Canada, then just a fraction of proposed renewable energy projects is likely to be built. Only 14% of solar projects and 20% of wind projects that joined interconnection queues across the US between 2000 and 2017 were operational by the end of 2022.6 Factors contributing to the low completion rates include siting issues, high interconnection costs, and speculative applications whereby developers submit the same project to multiple queues to determine the best location for building the project. In Canada, issues that have hindered the development of projects include lack of sufficient transmission capacity in Ontario from the late 2000s to the mid-2010s when renewable energy installations rose to replace retiring coal power plants.7 Recent project cancellations in Alberta seem to have been driven by among other things siting issues related to environmental concerns8 and potentially high interconnection costs, which we discuss below.
High interconnection costs could impede the pace of decarbonization
The second challenge is that interconnection costs themselves could be significant. Broad policy discussions about decarbonizing power generation often focus on the costs of solar PV panels, wind turbines, etc., and rarely on the costs of connecting dispersed assets to the existing grid infrastructure. Although renewables are among the cheapest new generation installations as measured by the levelized cost of energy (LCOE), this metric does not include the cost of connecting projects to the grid, which can be a prohibiting factor for the rapid adoption of clean energy. In contrast to the LCOE of solar and wind which has plummeted from the highs of the late 2000s and early 2010s, interconnection costs have been rising in many regions. For example, for both the PJM Interconnection and the Midcontinent Independent System Operator in the US, the average connection cost for projects that completed the interconnection process in recent years (2019/2020 – 2021/2022) has doubled from earlier years (2000 – 2018/2019).9,10 Interconnection costs for active and withdrawn/cancelled projects in these regions have increased even more. In general, the increase in costs is being driven by rising network upgrade costs and not interconnection facilities costs. Additionally, renewables have higher interconnection costs than natural gas, which is likely because solar and wind generation facilities tend to be located in remote areas that have limited transmission capacity.11
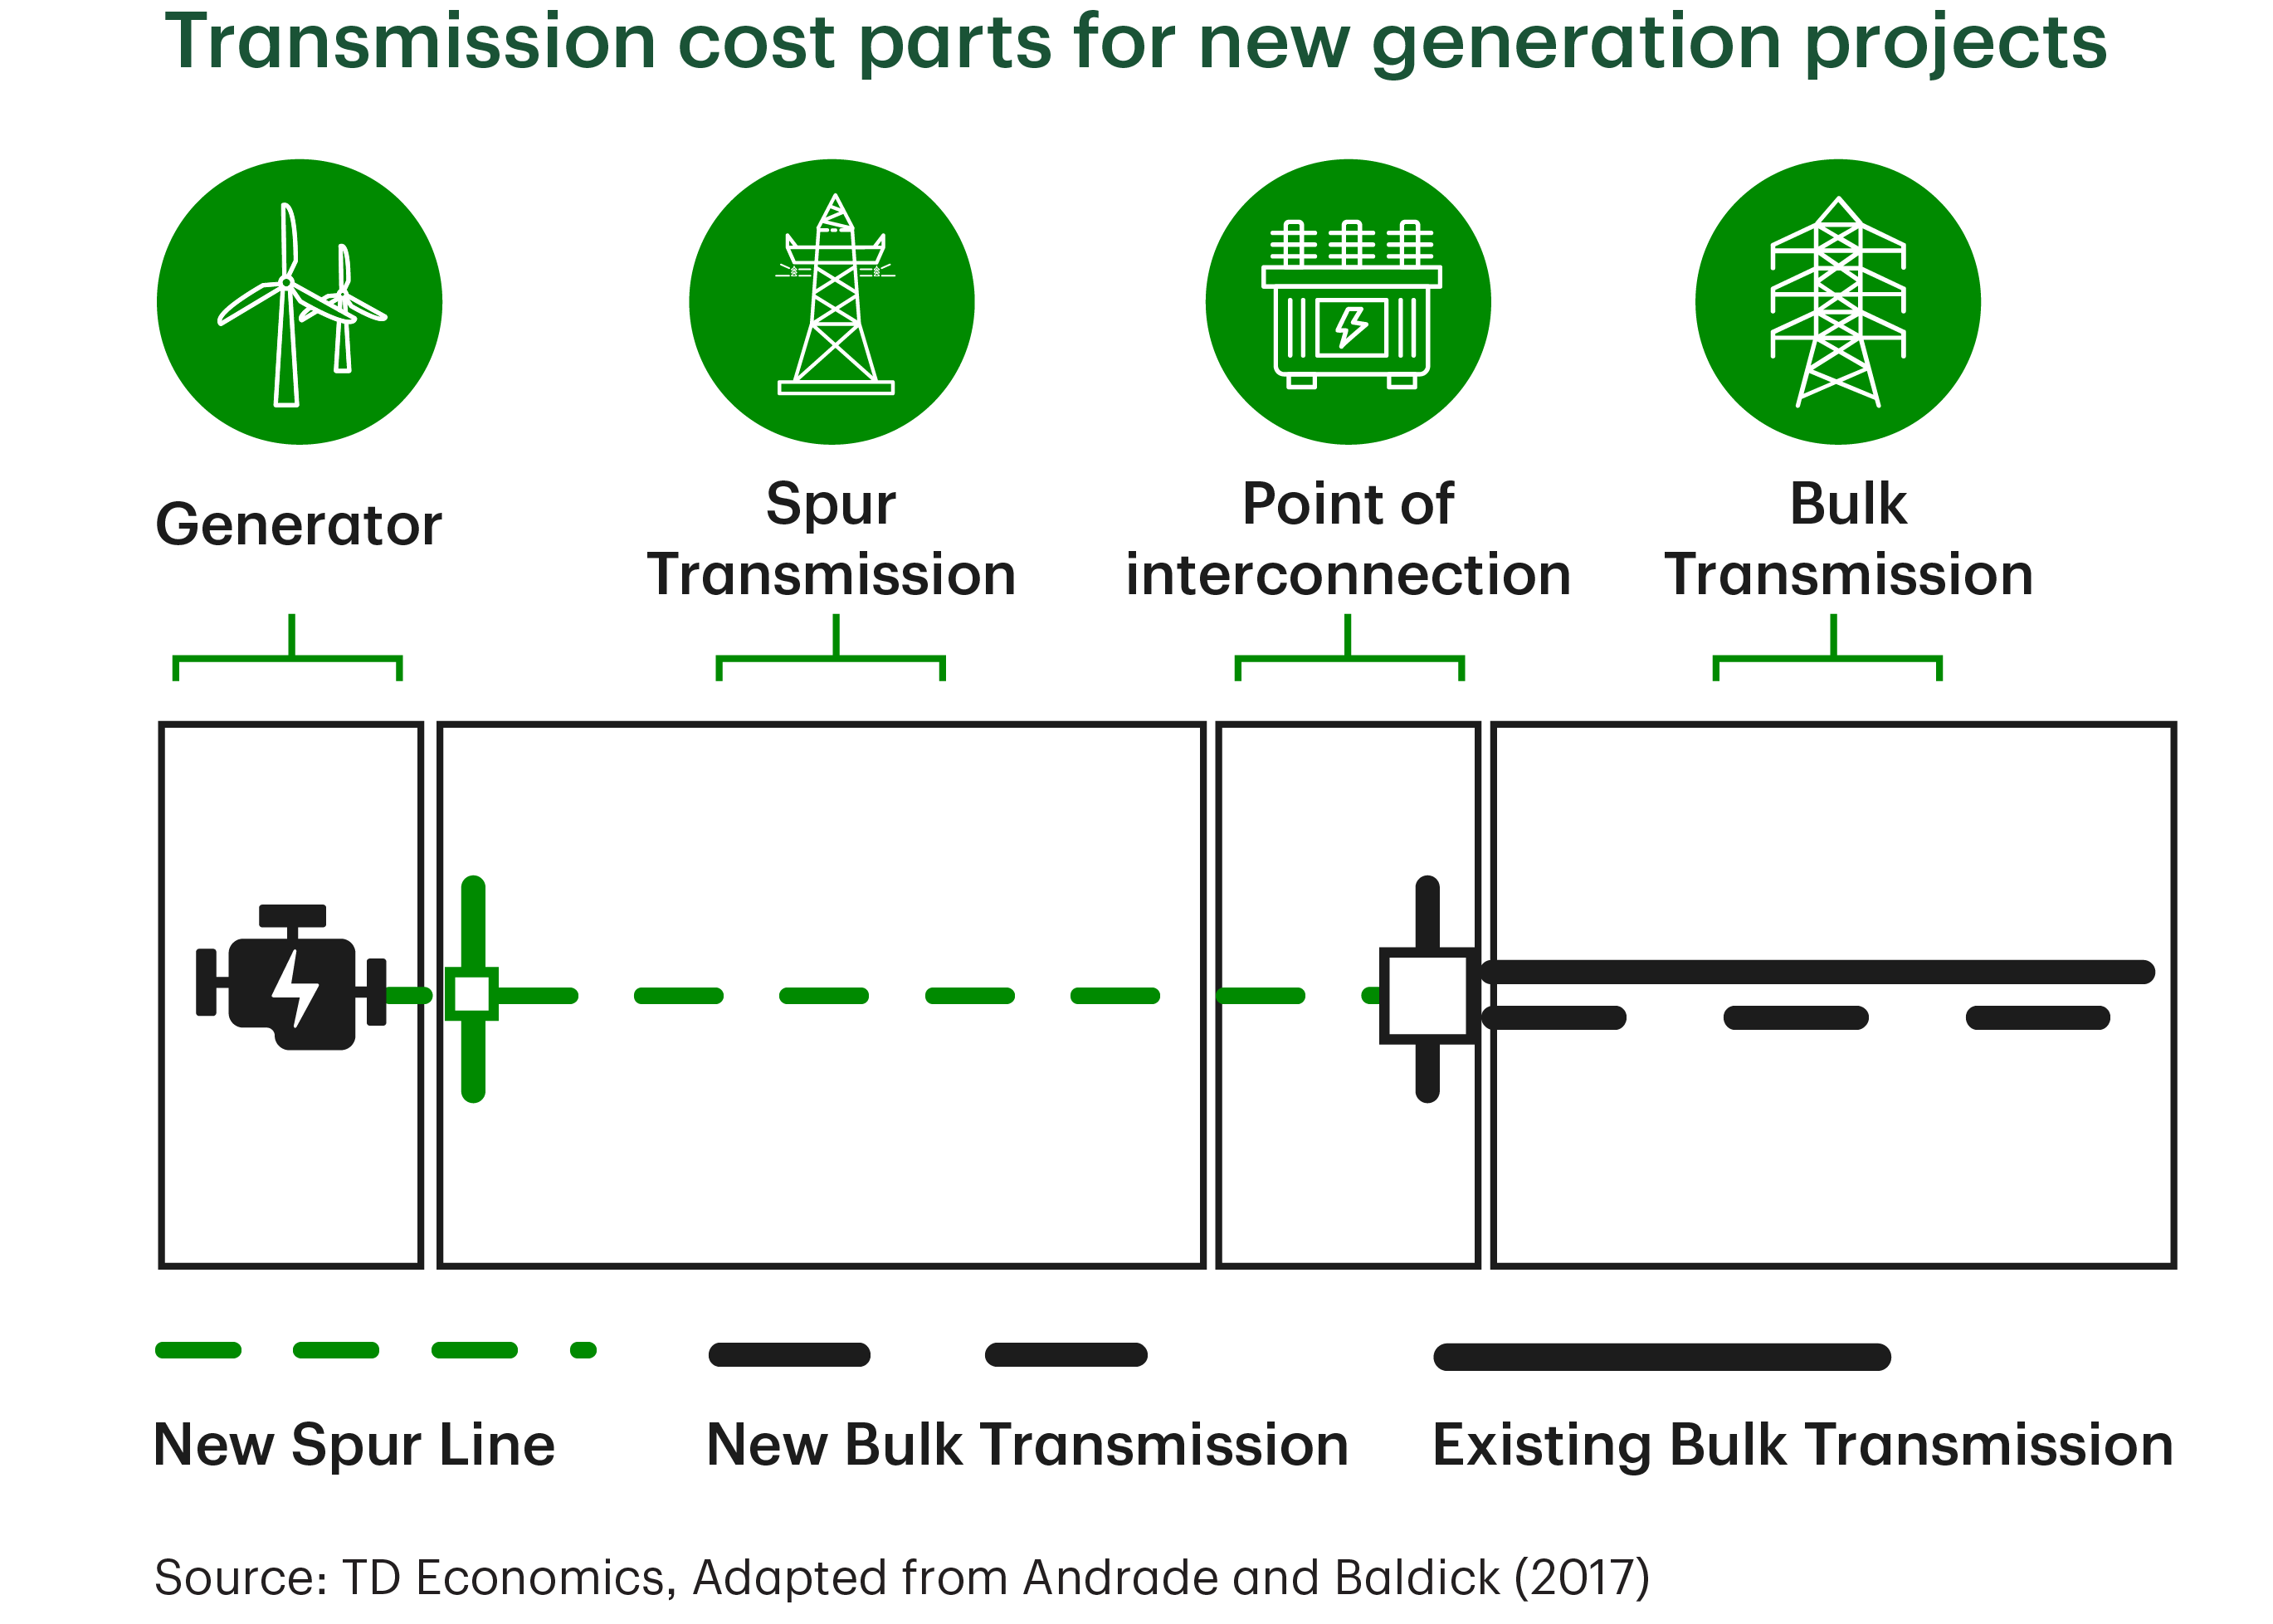
Text Box 1: Categorization of transmission investments for connecting new generation
Adding new generation and storage capacity to the transmission grid requires building new spur transmission lines and other facilities such as substations that connect individual generation facilities to the grid. In addition, it is often necessary to upgrade or expand the bulk transmission grid when the system has insufficient capacity to accommodate new generation without causing operational issues (e.g., exceeding line thermal limits). Investment in transmission infrastructure to support the integration of new generation and storage capacity can be classified into two broad categories:15
Bulk transmission: networked infrastructure that moves electricity from multiple generators and storage facilities to load centers. This includes investment to upgrade parts of the existing system and to expand the grid to new areas. For instance, building new high voltage transmission lines to connect regions experiencing or expected to have high generation growth falls under this category.
Interconnection facilities: this includes spur lines, which are transmission lines that move power from individual generators to the bulk grid, and point of interconnection facilities that connect spur lines to bulk transmission lines.
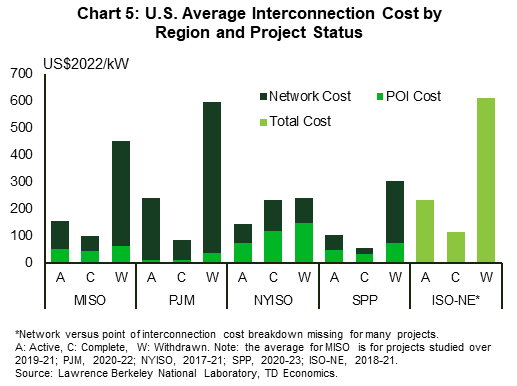
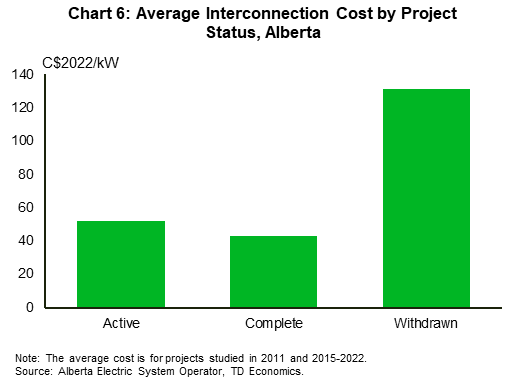
High interconnection costs are likely one of the drivers behind projects getting cancelled based on information from Alberta and the US. In Alberta, the available data indicates that the average interconnection cost is higher for cancelled projects than for active and complete projects (Chart 6). A similar result is observed for projects from the Midcontinent Independent System Operator, PJM, Southwest Power Pool and ISO-New England regions in the US (Chart 5). In the PJM for instance, interconnection costs comprise 19-38% of total project capital expenditure for cancelled solar and wind projects compared to just 4-7% for complete solar and wind projects.12 Cancelled projects are those that have been withdrawn from the queue while active projects are still undergoing interconnection studies. Complete projects on the other hand refer to those that are already in operation or if not operational, have finished the studies and the transmission facilities have been constructed and energized in the case of Alberta. For the US jurisdictions, complete projects are either already operational or have completed the studies and are negotiating or have signed an interconnection agreement.
Interconnection costs depend on many factors such as the length of the spur transmission lines, whether the lines are built overhead or underground, the terrain on which facilities are built and the complexity of the required system upgrades. Generally, developers are fully responsible for the cost of the interconnection facilities while the allocation of network upgrades costs varies by region. In some jurisdictions, though developers pay for the network upgrade costs upfront, they are eligible for a refund on a portion of the network upgrade costs that have wider system benefits. Since interconnection costs are only revealed as projects go through the interconnection queue, it can make financial planning for projects challenging, especially for small developers that may not have previous experience to draw from to estimate these costs. Moreover, in regions where information about available capacity at existing transmission line interconnection points is not published, developers submit applications unaware if the chosen points of interconnection can accommodate the proposed project capacity without triggering major costly system upgrades.
As the above suggests, finding information about interconnection costs is difficult. The information for Canada is based on preliminary cost estimates for projects in Alberta, Nova Scotia, British Columbia and Ontario for which we were able to find data. The cost estimates are usually updated as projects undergo further studies and more information becomes available. However, the final or actual interconnection cost numbers are not publicly available. The sample size for each region is too small to allow analysis of trends over time, but US data (discussed above) helps provide more context about how the surge in projects applying to connect to the grid is affecting interconnection costs.
Costs seem to vary by region and technology within the country. In Alberta, average interconnection costs are higher for wind projects than for solar projects (Table 1). This is in part due to the costs of spur transmission lines as wind projects are on average connected to the grid by significantly longer spur lines compared to solar projects. Comparing Alberta and Nova Scotia, interconnection costs for solar and wind generation facilities are on average higher in the latter than the former. Network upgrades costs especially for wind projects contribute to the higher average total interconnection costs in Nova Scotia. As well, projects in Alberta are generally larger (in terms of capacity) which explains the much lower $/kW cost. The benefits of scale are also seen within Nova Scotia for solar and wind estimates from 2022. Although the average interconnection cost per project is higher for wind projects ($8.6 million) than solar projects ($6.8 million), when the cost is normalized by the capacity of the proposed projects, costs are slightly lower for wind ($91/kW) than solar ($94/kW).
Table 1: Average Interconnection Costs, $ Million per Project & $ per kW of Proposed Generation Capacity (Estimates)
| Technology | Alberta (Interconnection Facilities) | Nova Scotia | Ontario (Interconnection Facilities)2 | British Columbia (Network Upgrades) |
||
| Interconnection Facilities | Network Upgrades1 | Total | ||||
| Solar | $4.4M | $3.4M | $3.4M | $6.8M | ||
| $22/kW | $47/kW | $48/kW | $94/kW | |||
| Wind | $13.7M | $3.9M | $9.1M | $13.0M | $24.0M | $11.3M |
| $79/kW | $50/kW | $117/kW | $167/kW | $185/kW | $235/kW | |
| Wind (2022)3 | $3.3M | $5.3M | $8.6M | |||
| $35/kW | $56/kW | $91/kW | ||||
Billions of dollars in capital spending will be required to connect new solar and wind resources
Expanding renewable energy capacity over the coming years is going to require large amounts of investment in grid infrastructure. Roughly $25-50 billion in capital investments on transmission facilities could be needed to connect new solar and wind capacity that is required to clean up Canada's grids by 2035. This amount includes expenditures on interconnection facilities, network upgrades, new high voltage transmission lines to connect renewable rich areas as well as upgrades to strengthen inter-regional transmission capacity. The estimate does not include transmission connection costs for other types of new generation. It also excludes additional grid infrastructure investments that will be required over the coming decades such as investments to support load growth, expand the distribution system and upgrade aging transmission and distribution infrastructure. Incorporating these excluded categories would bump the needed investment in grid infrastructure significantly higher.
A lot of this investment is expected in the provinces that are expected to drive renewable capacity additions in the country. Alberta accounts for about two-fifths of the solar and wind capacity projected to be installed in the years leading up to 2035 (Chart 3). Together with Ontario, British Columbia, Nova Scotia and Saskatchewan, it accounts for more than 90% of the projected solar and wind capacity additions by 2035. Post-2035, Ontario is expected to lead renewable energy installations and accounts for nearly three-quarters of the growth in solar and wind capacity projections between 2035 and 2050.
Policy Considerations
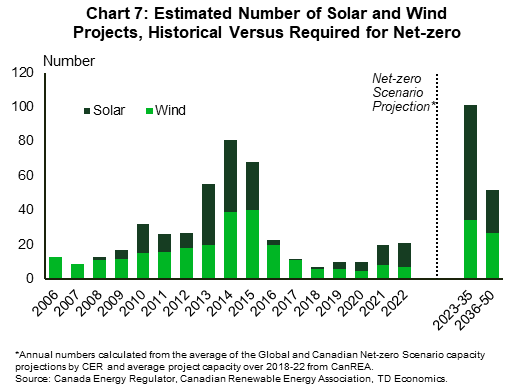
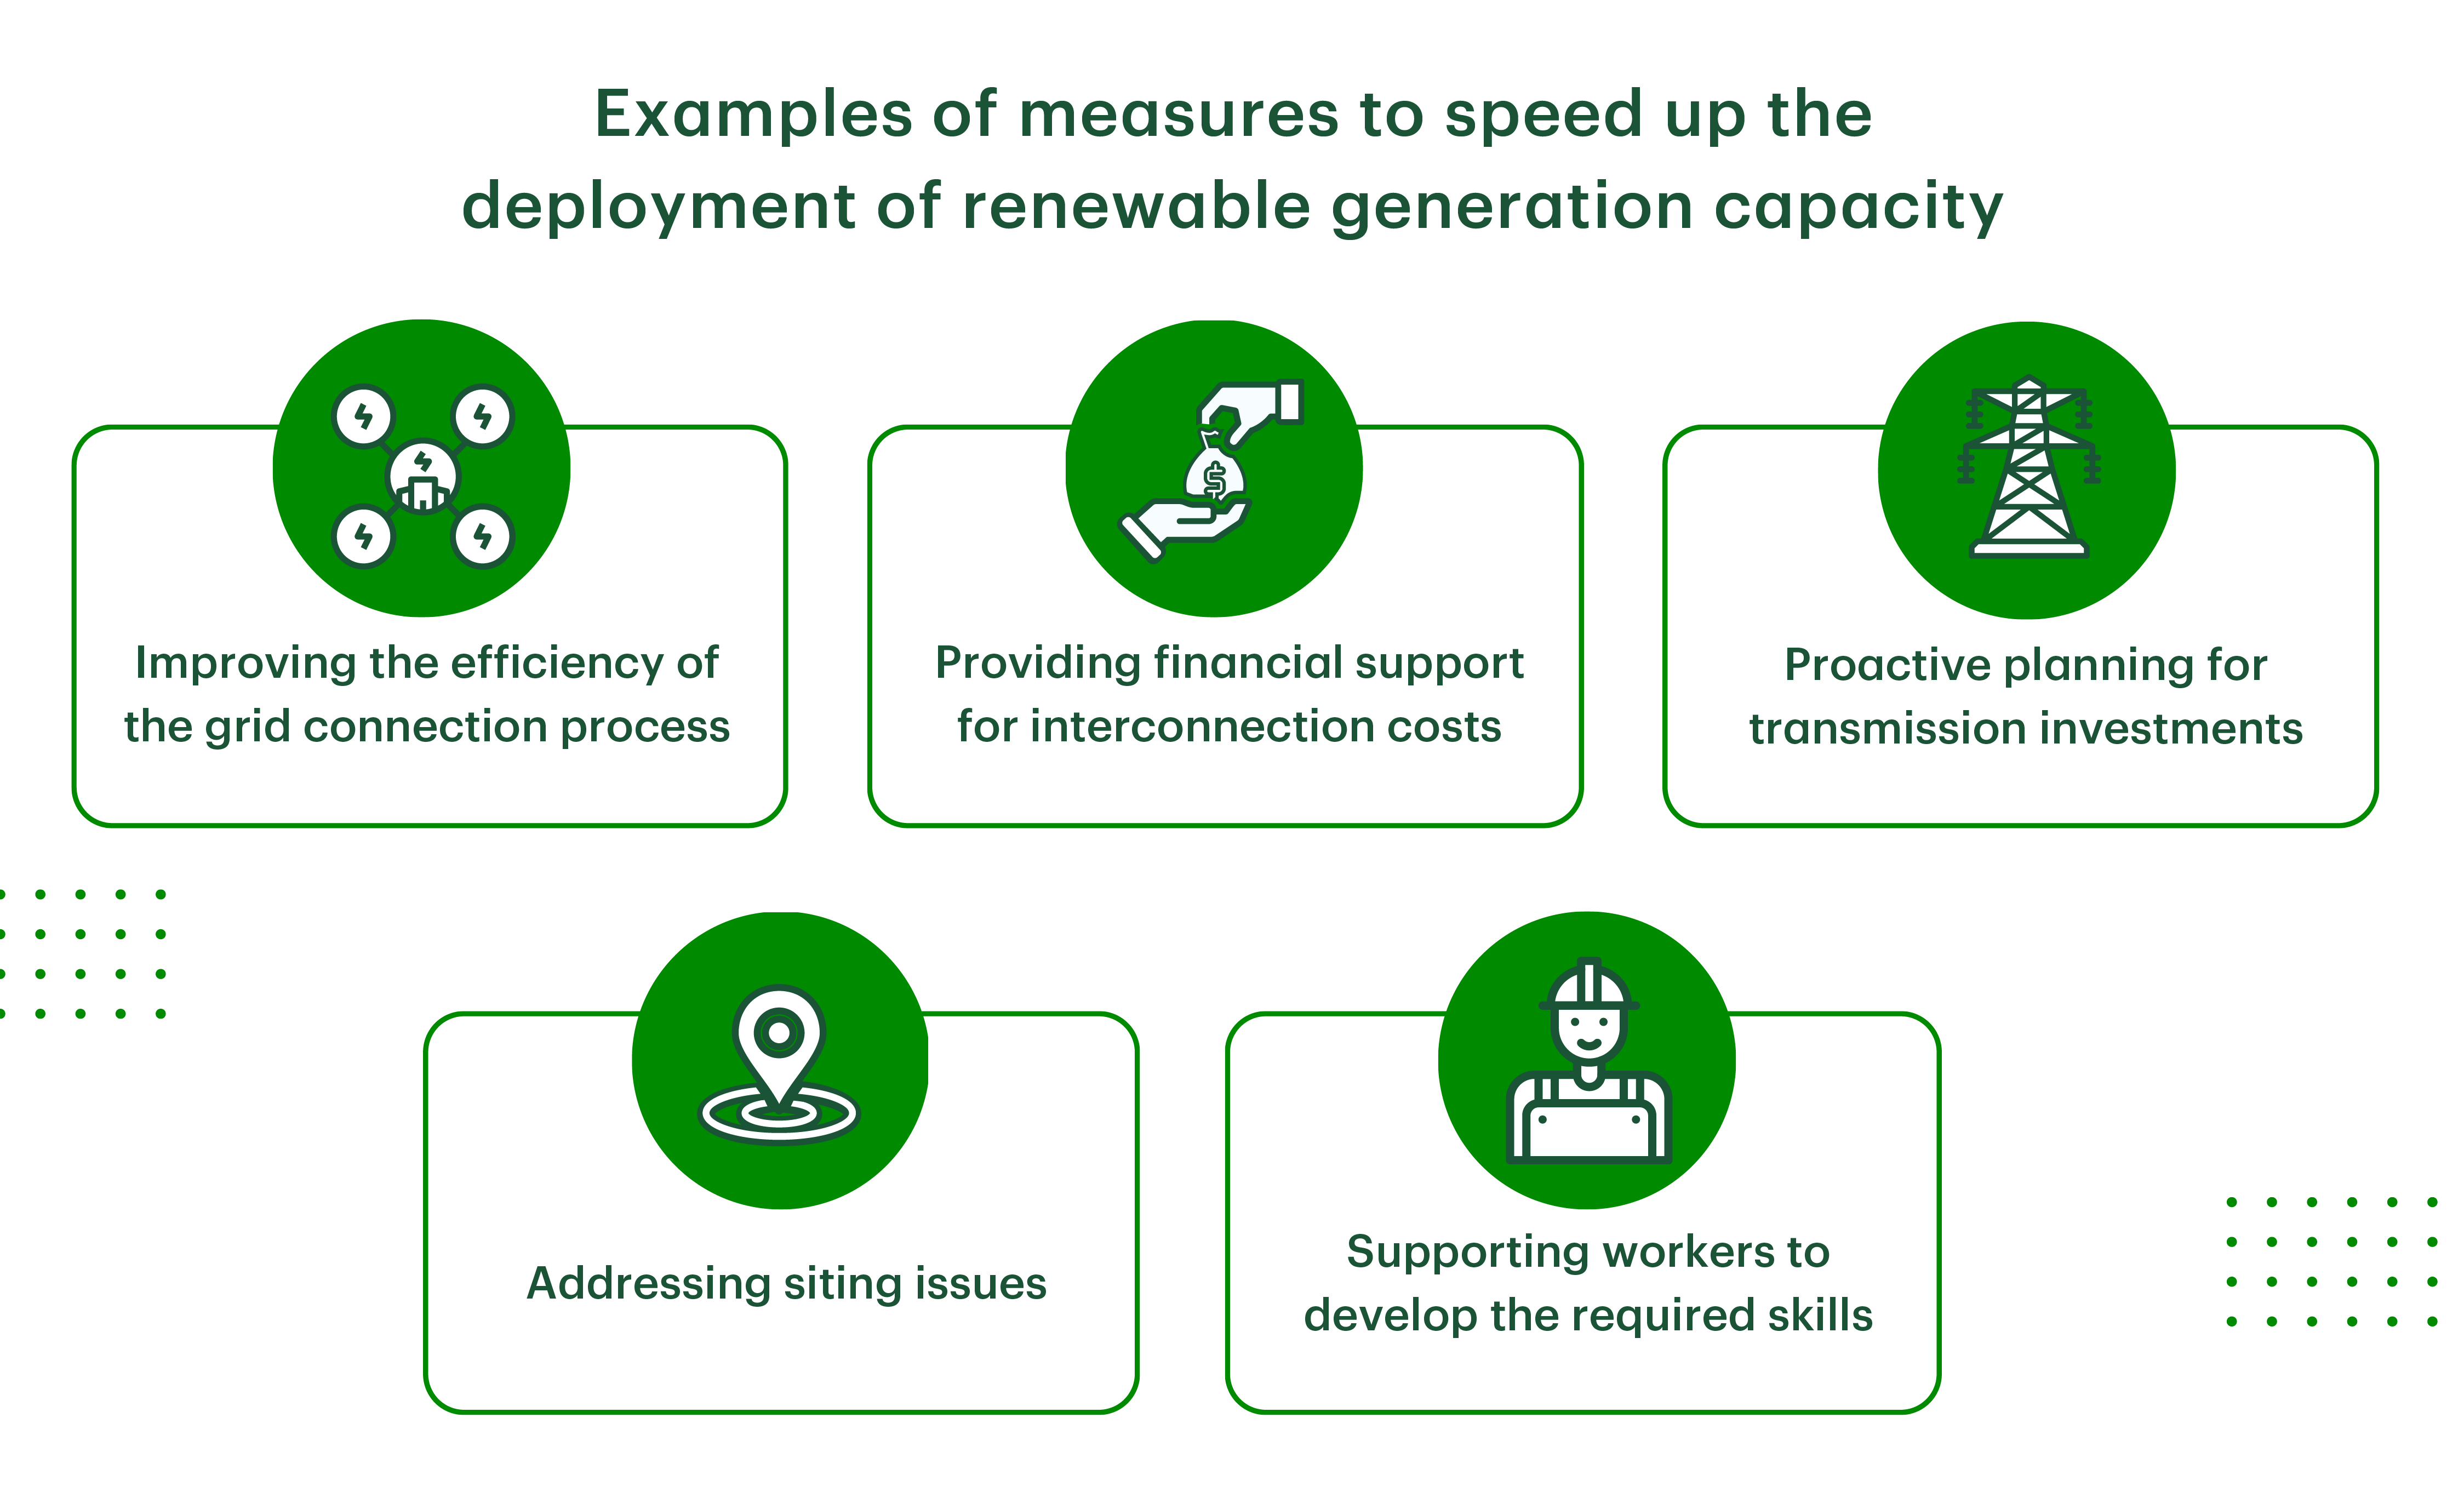
The volume of projects that have to be connected to the grid over the coming decades requires proactive planning and public support to prevent bottlenecks delaying the pace of decarbonizing the grid. To stay on track to reach net-zero grids by 2035, we need to quadruple the number of utility-scale wind and solar facilities that come online each year in Canada from recent installation levels (Chart 7). Achieving this will require changes to how grid decarbonization is approached. This should include measures to:
- Improve the efficiency of the grid connection process;
- Allow interconnection costs to be eligible for financing incentives for clean energy;
- Support the development of inter- and intra-regional high voltage transmission lines;
- Address facility siting challenges; and
- Support workers to develop the skills necessary for the clean energy sector.
Several changes have been proposed in recent years to improve interconnection processes. Among these is replacing individual serial studies of projects with cluster studies, which could reduce wait times and study costs. As an example, the recent switch from serial to cluster studies by the Alberta Electric System Operator is expected to cut study times by about three-quarters.13Additionally, publishing available capacity at interconnection points and historical connection costs could disincentivize speculative applications aimed at discovering costs. As well, prioritizing projects that are more likely to be built when assigning transmission capacity could speed up capacity additions.
Public financial support such as the federal Clean Technology and Clean Electricity investment tax credits will be essential for keeping grid decarbonization on track. While there is no mention of interconnection costs in the initial descriptions of the tax credits, it would be prudent to include them among eligible expenses in the final legislation. The US Inflation Reduction Act has a similar approach although only connection costs for small projects (up to 5 MW) qualify for the investment tax credit. One aspect of transmission investment that will justifiably be eligible for the Clean Electricity Investment Tax Credit are costs for transmission projects that connect provinces and territories. However, there is a need to also support investments to connect renewable resource rich areas to demand centers within regions. There is room for provinces to chip in to support these investments through tax credits or recovering part of the costs through the tax base.
Proactive planning for transmission investments is also critical as transmission projects tend to take longer to complete than solar and wind farms. In a way this means that jurisdictions have to be willing to invest in big transmission projects that often have high capital costs to open up renewable rich regions and get ahead of the chicken and egg problem vis-à-vis transmission and generation project development.
Addressing siting constraints for generation and transmission infrastructure is necessary too. Solar and wind facilities have a large footprint, which tends to increase local opposition to project siting and in turn this can slow the deployment of new renewable capacity. According to some estimates, these facilities use at least 10 times more land per unit of energy produced compared to fossil fuel generation.14 Moreover, solar and wind facilities being more dispersed means more transmission infrastructure requirements, proportionally increasing the land needed for electricity supply.
The availability of skilled labor is another key element for the success of decarbonizing the grid. Doubling solar and wind capacity installations from current levels as would be required to reach net-zero grids by 2035 creates the need for more workers who can install solar PV panels, wind turbines, build grid infrastructure, and operate and maintain these facilities. The demand for these skills is expected to continue post-2035 due to electrification efforts. To the extent that domestic manufacturing of renewable energy technologies and related downstream supply chain activities can pick up, then labor demand in those sectors could also rise. Overall, it is going to become increasingly important to support workers to develop the skills that are necessary for these growing sectors.
End Notes
- Canada Energy Regulator, Canada’s Energy Future 2023: Energy Supply and Demand Projections to 2050, June 2023
- Lawrence Berkeley National Lab, Queued Up: Characteristics of Power Plants Seeking Transmission Interconnection As of the End of 2022, April 2023
- Attracta Mooney, Gridlock: how a lack of power lines will delay the age of renewables, Financial Times, June 11, 2023
- Alberta and Ontario timelines estimated using information gathered from the Alberta Electric System Operator, the Ontario Energy Board and the Independent Electricity System Operator. The Ontario estimate is the number of years to commercial operation from when projects were issued a contract by the IESO.
- Brad Plumer, The U.S. Has Billions for Wind and Solar Projects. Good Luck Plugging Them In, The New York Times, February 23, 2023
- Lawrence Berkeley National Lab, Queued Up: Characteristics of Power Plants Seeking Transmission Interconnection As of the End of 2022, April 2023
- Margaret Loudermilk, Renewable Energy Policy and Wind Generation in Ontario, Ivey Business School's Energy Policy and Management Centre, Policy Brief, January 2017
- Jonathon Sharp, Concern over potential bird deaths nixes solar project in southern Alberta, CBC News, April 24, 2023
- Lawrence Berkeley National Lab, Interconnection Cost Analysis in the PJM Territory, January 2023
- Lawrence Berkeley National Lab, Generator Interconnection Cost Analysis in the Midcontinent Independent System Operator (MISO) territory, October 2022
- Lawrence Berkeley National Lab, Generator Interconnection Costs to the Transmission System - Summary Briefing, June 2023
- Lawrence Berkeley National Lab, Generator Interconnection Costs to the Transmission System - Summary Briefing, June 2023
- Alberta Electric System Operator, Connection Process Streamlining Design Session, October 18, 2022
- McKinsey & Company, Renewable-energy development in a net-zero world: Land, permits, and grids, October 2022
- Juan Andrade and Ross Baldick, Estimation of Transmission Costs for New Generation, January 2017 .
Disclaimer
This report is provided by TD Economics. It is for informational and educational purposes only as of the date of writing, and may not be appropriate for other purposes. The views and opinions expressed may change at any time based on market or other conditions and may not come to pass. This material is not intended to be relied upon as investment advice or recommendations, does not constitute a solicitation to buy or sell securities and should not be considered specific legal, investment or tax advice. The report does not provide material information about the business and affairs of TD Bank Group and the members of TD Economics are not spokespersons for TD Bank Group with respect to its business and affairs. The information contained in this report has been drawn from sources believed to be reliable, but is not guaranteed to be accurate or complete. This report contains economic analysis and views, including about future economic and financial markets performance. These are based on certain assumptions and other factors, and are subject to inherent risks and uncertainties. The actual outcome may be materially different. The Toronto-Dominion Bank and its affiliates and related entities that comprise the TD Bank Group are not liable for any errors or omissions in the information, analysis or views contained in this report, or for any loss or damage suffered.
Download
Share: