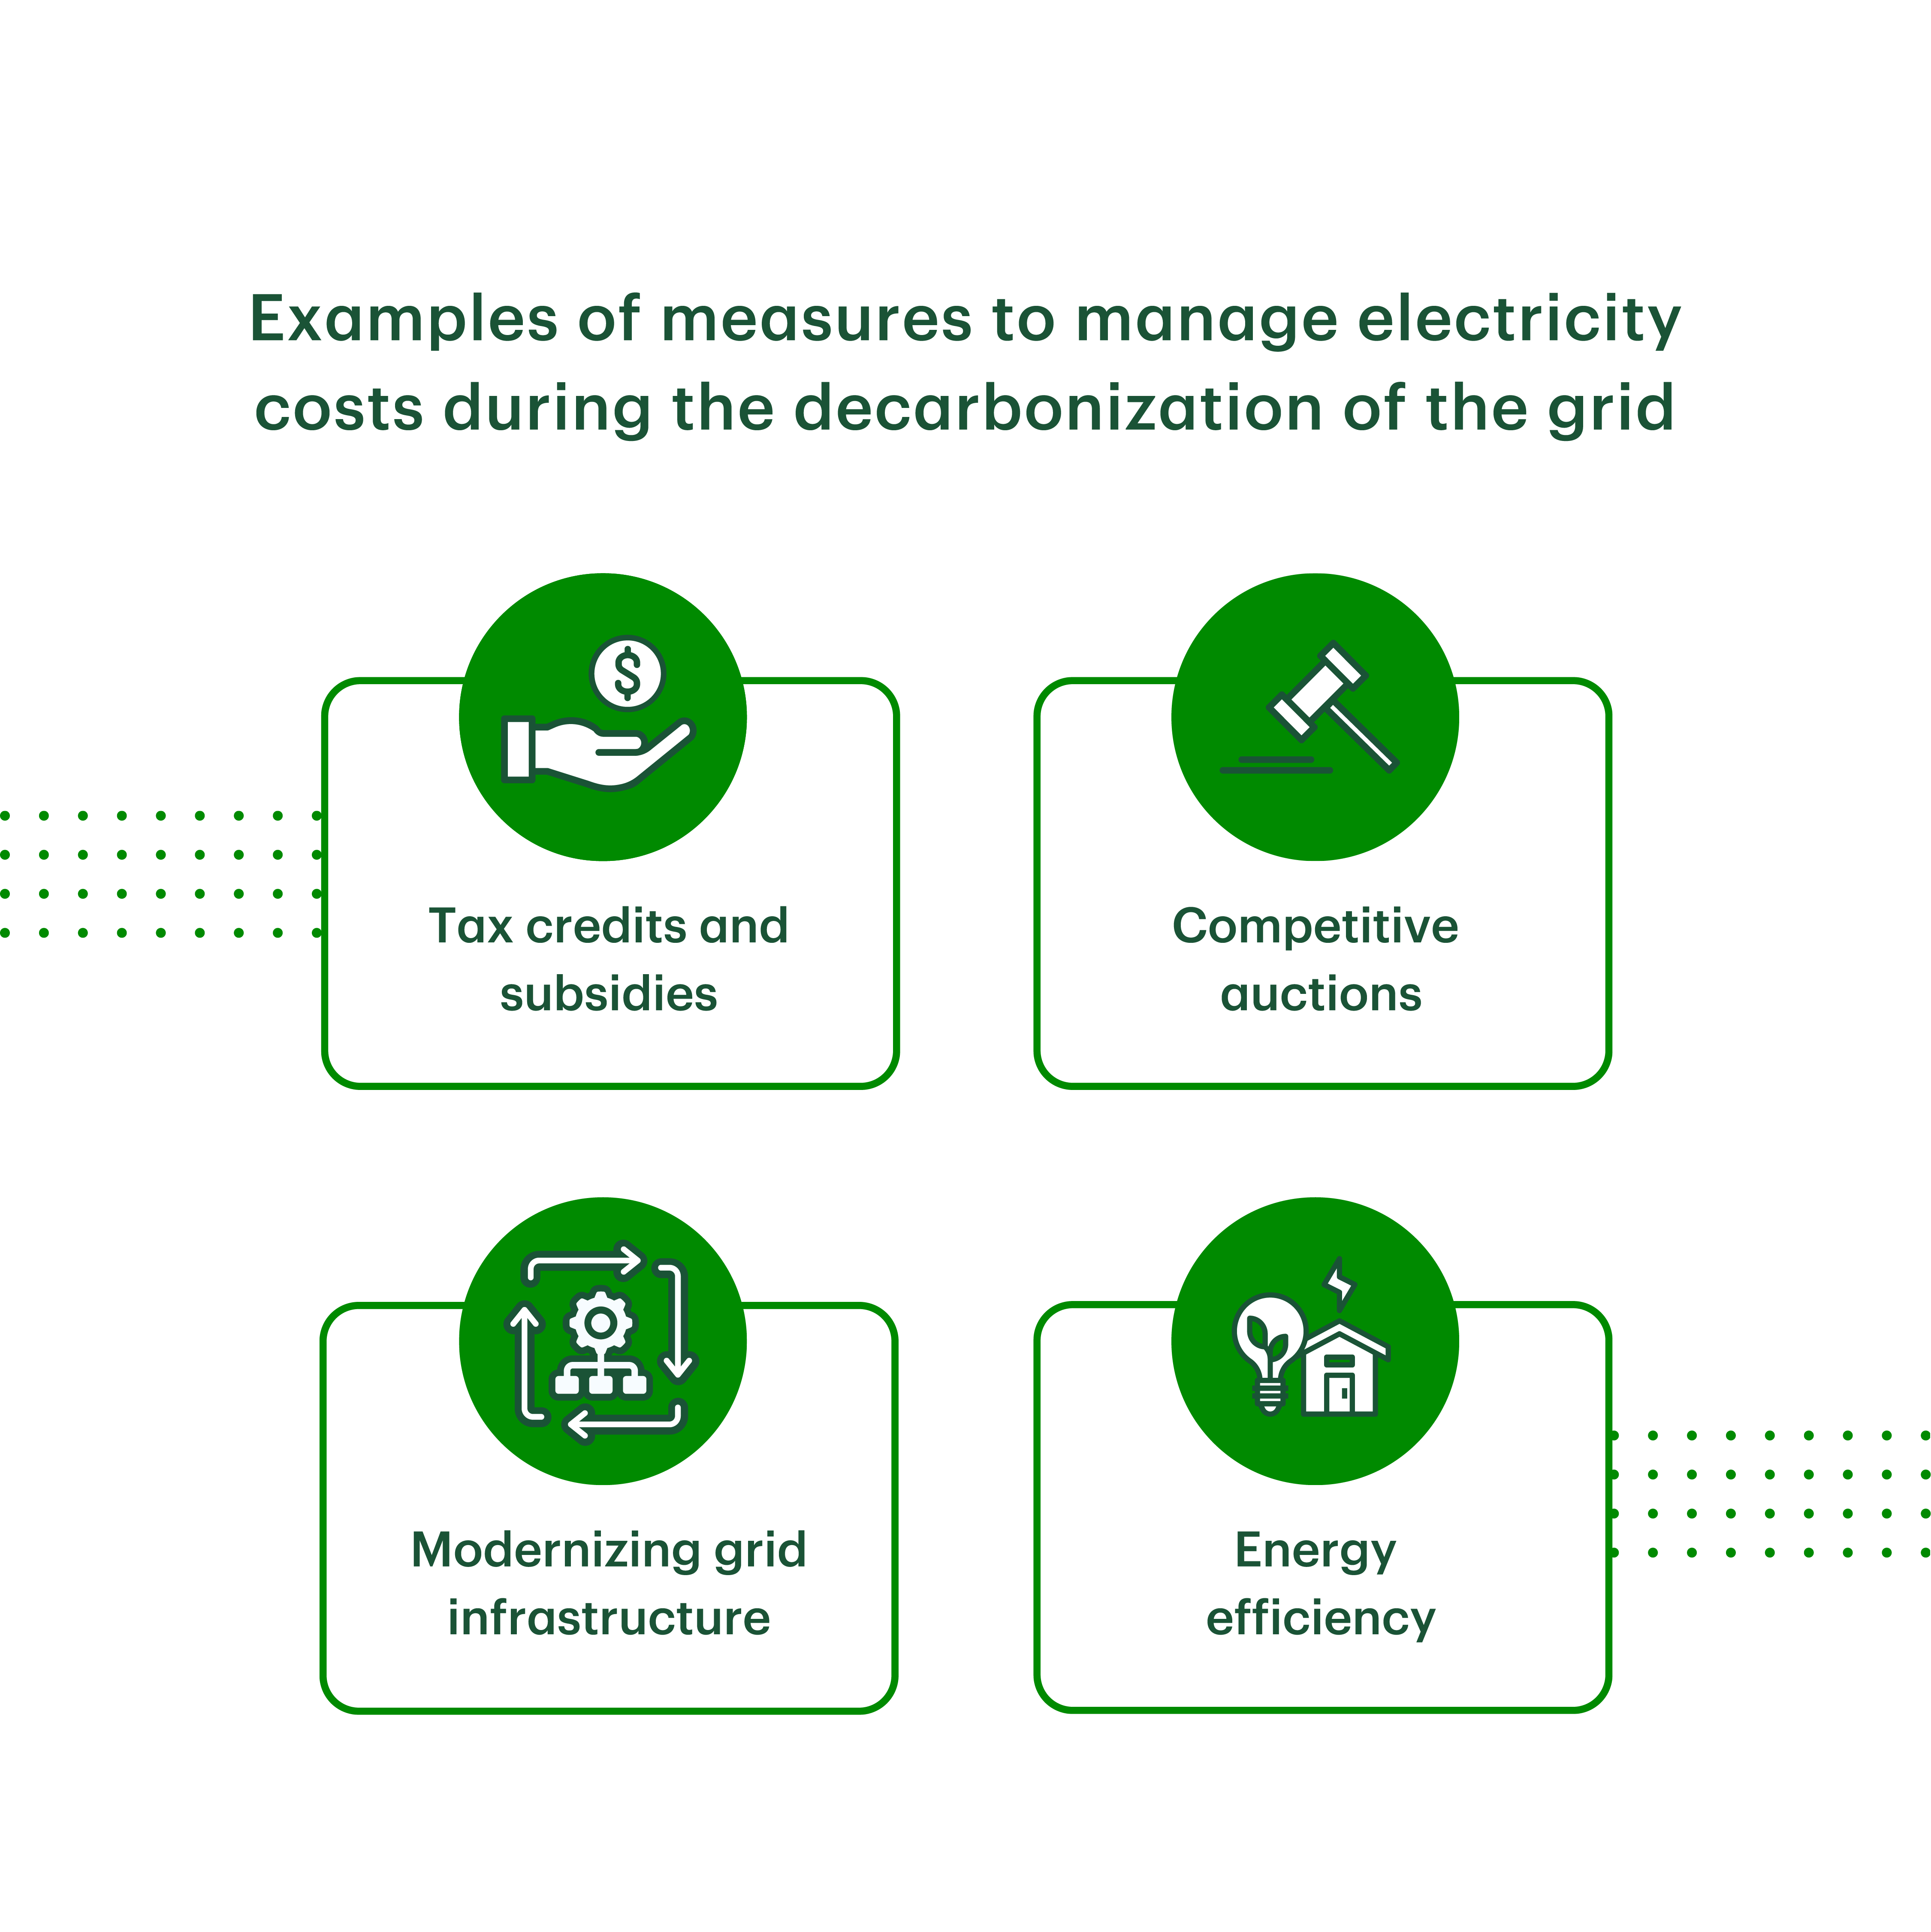
With just over a decade to go, the electricity sector in Canada will have to undergo rapid changes to reach net zero emissions by the 2035 deadline set by the federal government. The Clean Electricity Regulations, when implemented, are expected to provide the regulatory framework that will guide this process. The scale of the required effort varies across the country. Québec, British Columbia and Manitoba have ample clean generating capacity while Alberta, Saskatchewan and Nova Scotia still heavily rely on unabated fossil fuels for most of their domestic generation (chart 1). In addition to decarbonizing existing generation, capacity needs to expand to accommodate the expected increase in demand from electric vehicles, hydrogen production, increased electrification of building heating and industrial processes, etc. The Canada Energy Regulator estimated a potential increase in electricity demand of 85% between 2019 and 2050 in a net-zero by 2050 world.1
Some aspects of the journey ahead bode well for manageable electric system costs and others not so much. In particular, the steep decline in the cost of solar PV panels and wind turbines has greatly improved the prospects for increasing zero-emissions generating capacity at a lower cost than was possible a decade ago. Thus, there is less of a need for costly incentive programs to support the development and adoption of these technologies. However, support will be needed to enable the adoption of emerging technologies that are still expensive (e.g., energy storage systems). In addition, extensive investment is required to upgrade and expand the transmission and distribution infrastructure and replace aging grid assets, which will lead to higher fixed system costs. At the same time, growing customer-owned onsite generation could present challenges for recovering fixed system costs equitably.
Keeping costs under control to avoid a surge in consumer electric bills needs to be a major consideration for jurisdictions during this intensive transition period. Measures that can be used to help offset costs for consumers include electric bill subsidies for low-income households and small businesses. In addition, consumers can also benefit from actions that lower overall system costs such as modernizing grid infrastructure to make it more efficient and procuring new technologies via competitive auctions. As the increase in the use of coal in Europe over the past year has shown, decarbonization measures can become less of a priority when economies are faced with high energy prices and inflation. Affordable electricity prices in the coming decades are even more critical since electrification of transportation and other sectors is expected to serve as a major pillar for reducing emissions across the economy.
Solar and wind have become cost competitive with conventional generators, but storage remains expensive
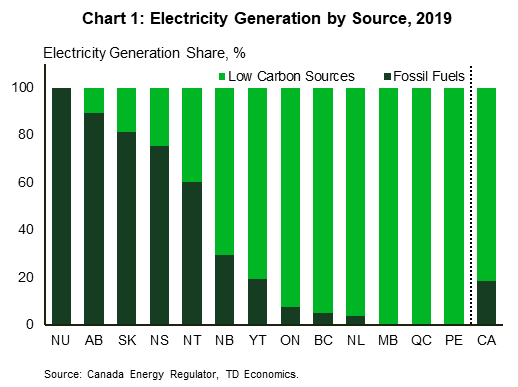
The renewable energy landscape has changed from just over a decade ago as the levelized cost of electricity (LCOE) for solar PV and wind technologies has fallen significantly. The LCOE measures lifetime costs of generation per unit of energy (e.g., per kWh) for new projects – or looked at another way, it is an estimate of the breakeven price per kWh for a generator. The metric includes capital costs, financing costs as well as fixed and variable operations and maintenance costs. It excludes transmission and distribution infrastructure costs and other system costs. Based on U.S. data, the average LCOE of unsubsidized utility-scale projects declined by 90% for solar PV and 70% for wind between 2009 and 20212, leading to lower power purchase agreement prices (chart 2). A similar trend has been observed in Canada based on renewable energy auctions in Alberta and Ontario.3,4 Despite the recent escalation in costs due to supply chain issues, high inflation and increasing interest rates, new solar PV and wind projects have maintained the competitive strides made since the early 2010s. These technologies are here to stay as economically viable alternatives to fossil fuel generators (chart 6). As a result, past costly financial incentives like the generous feed-in tariff programs used to promote renewable energy in Germany and Ontario are largely no longer needed for new large-scale solar PV and wind projects.
However, since solar PV and wind facilities produce electricity intermittently and have limited dispatchability, other low-carbon technologies and infrastructure are necessary. These include energy storage systems to shift excess energy to periods with low variable generation. Lithium-ion batteries have been the fastest growing storage technology in recent years, though they and other battery technologies are better suited for short-term backup. Options for long duration storage include compressed air energy storage, pumped hydro, hydrogen, gravitational and thermal storage. Beyond energy storage, there is a need to invest in low-carbon technologies that can provide baseload power such as hydro and nuclear. While building new large conventional nuclear plants faces many obstacles including high capital costs and long lead times, small modular reactors offer a potential alternative with smaller hurdles. Canada's first small modular reactor, which is expected to be in operation by 2028 in Ontario, could pave the way for more projects if it proves to be a success.5 Investment in carbon capture and storage technologies will also be necessary to abate remaining emissions from fossil fuel generators during the transition to a more renewables-based energy mix.
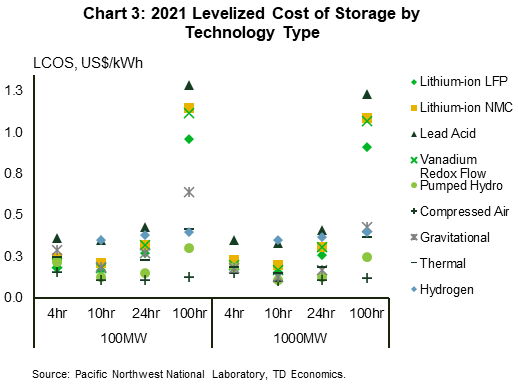
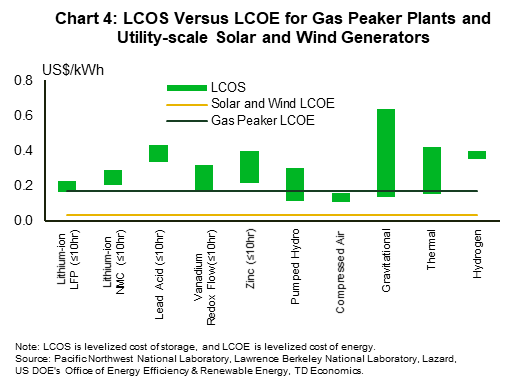
Although the levelized cost of storage (LCOS) has also fallen over the past decade, it remains relatively high. On one hand, the lowest cost compressed air, pumped hydro and lithium-ion battery systems are becoming increasingly cost competitive with natural gas peaker plants (chart 4). Peaker plants usually run only during periods of high demand and tend to command higher prices than baseload generators to compensate for their limited run time. The improving cost parity between storage technologies and peaker plants enables the former to offer a reliable and viable replacement. However, on the other hand, replacing baseload fossil fuel generation with a combination of solar, wind and storage would likely come at a higher cost as storage technologies are still comparatively expensive. This is because storage would need to supply a lot more energy for long periods to balance generation from solar and wind and make it match output from baseload generators. Therefore, the lower cost of solar and wind generation would be offset by the higher cost of supply from storage facilities.
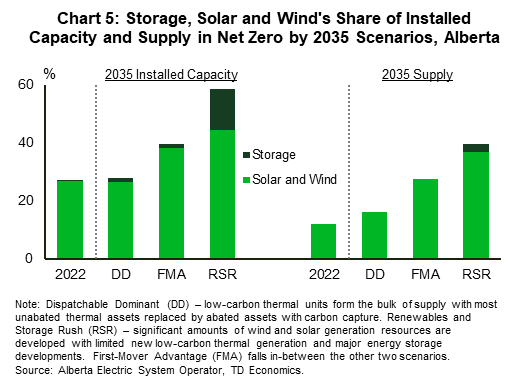
The amount of energy storage capacity needed will depend on the share of intermittent generation capacity vis-à-vis the overall technology mix. British Columbia and Québec are in a better position to add new variable generation without the immediate need for complementary storage as the existing large capacity of reservoir hydroelectric facilities can act as backup for variable generation. The same is not true in places like Alberta and Saskatchewan that have to decarbonize a large share of current generation. Ontario also falls in this latter category as most of its electricity supply comes from low-carbon facilities that have limited flexibility (e.g., nuclear, run-of-the river hydro). These provinces have a higher need for storage capabilities, though the magnitude will vary based on the set of technologies that will replace existing fossil fuel plants. As an example, in net-zero scenarios developed for Alberta, storage from batteries, pumped hydro and compressed air comprises 1% to 14% of installed capacity and up to 3% of supply by 2035 (chart 5).6
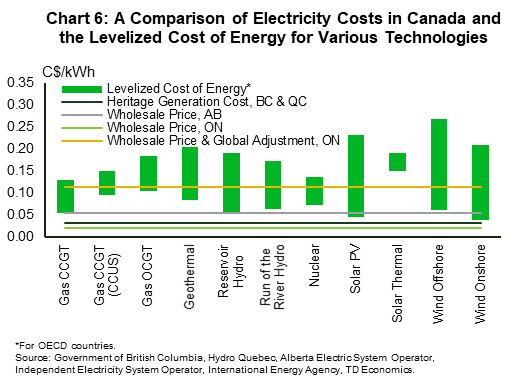
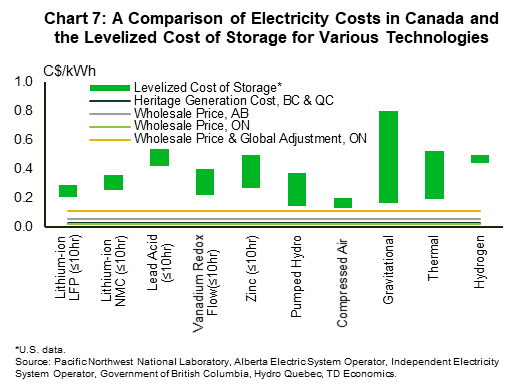
The difference between the actual levelized costs of the low-carbon technologies in Canada and the costs of existing generation technologies will determine the impact of decarbonization on current electricity supply costs. In general, the levelized cost of storage technologies appears to be higher than current electricity supply costs in Alberta, British Columbia, Ontario and Québec (chart 7). In contrast, the cost of low-carbon generation technologies is comparable to current electricity supply costs in some of the regions but higher than in other regions (chart 6). Apart from the visible costs for supplied energy that are embedded in LCOE and LCOS metrics, decarbonization could also result in higher fixed capacity payments to meet resource adequacy needs. Solar, wind and storage are generally expected to contribute a smaller share of their installed capacity during peak demand relative to fossil fuel resources because of weather dependency and downtime for recharging. Therefore, more installed capacity would be needed to achieve reliability requirements.
Despite the improvement in the cost-competitiveness of renewable and storage technologies, the growth of low-carbon electricity supply is likely to increase electricity costs. According to estimates by the Alberta Electric System Operator, the load-adjusted generation costs in 2035 could be 56-66% higher in net-zero by 2035 scenarios compared to a technology trajectory based on current policies.7,8 For Ontario, we estimate that replacing expiring gas generator contracts with a combination of solar, wind, storage and small modular reactors could increase the average generation cost by around 20% in 2035 in comparison to what it would be if the gas contracts were renewed and the current procurement plan for new resources goes ahead as planned. These estimates would be additional to the 15-20% increase in average generation costs in 2035 under the current policies trajectory compared to 2021 in both provinces. Assuming these higher costs were passed directly to consumers, their impact on consumer bills would be exacerbated by additional costs arising from increasing investment in transmission and distribution infrastructure, discussed below.
Non-generation costs are expected to increase as investment in transmission and distribution infrastructure rises
Canada's grid infrastructure will need a revamp over the coming decades to support the integration of new renewable capacity and the expected load growth from electric vehicles, expand interties across electricity markets and upgrade outdated grid infrastructure. As well, there is a need to make grid infrastructure more resilient to extreme weather using measures such as undergrounding lines in high-risk areas. A large portion of the grid infrastructure in Canada was built before the 1980s and is approaching the end of its useful life, which means investment in grid infrastructure would be high even without the energy transition. New renewable capacity often requires upgrades to the transmission or distribution infrastructure depending on the location of the projects and these costs can go into the billions. As an example, it was estimated that US$12 billion would need to be invested in California in the decade leading up to 2020 to build seven new transmission lines that could support a near quadrupling of renewable energy generation.9
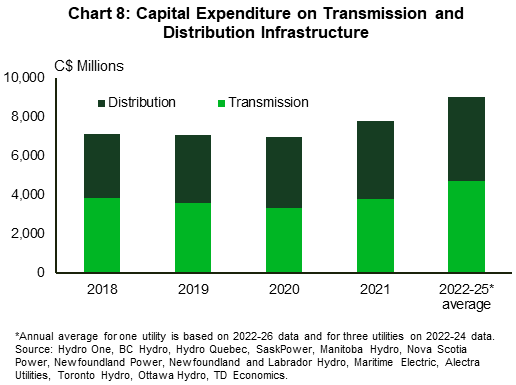
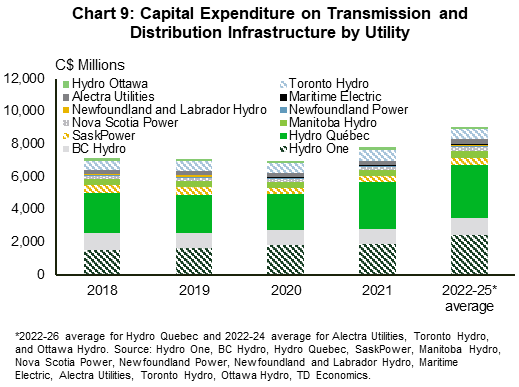
As a result of necessary upgrades, grid infrastructure investment is likely to be substantial for the foreseeable future. Publicly available information from a select number of utilities across Canada give a flavor of the amounts to be expected (charts 8 and 9). Among these companies, Hydro One expects to invest about C$2.5 billion per year between 2023 and 2027 on transmission and distribution projects. Hydro Québec plans to invest C$5 billion annually between 2022 and 2026, with C$3.3 billion likely to go towards transmission and distribution infrastructure based on our calculations using spending allocation patterns from 2011-2021.10, 11, 12 To the extent that capital additions exceed depreciation, which is usually the case, the revenue requirement for transmission and distribution infrastructure will increase when completed projects enter the rate base. This will lead to higher costs for consumers, as illustrated by Alberta's experience. From 2009 to 2020, about C$13.5 billion was spent on dozens of transmission projects, which contributed to the average transmission rate more than doubling.13,14 For a typical household, the monthly transmission charge increased from C$9 in 2011 to C$23.4 in 2021.
The growth of consumer self-generation could present challenges for the recovery of non-generation system costs
Many jurisdictions have historically recovered fixed grid costs through volumetric $/kWh rates, which means the total amount paid by consumers depends on their consumption of grid electricity. However, increasing customer-owned onsite generation, driven largely by net metering programs, reduces grid electricity demand for program participants. This could potentially shift a disproportionate portion of fixed grid costs onto non-program participants – individuals who also tend to be less affluent. Net metering programs permit consumers who generate their own electricity to export the excess to the grid and receive a credit that is applied against charges for grid electricity use. Although uptake of these programs is still low in Canada compared to California and rules vary by region, the California program sheds light on the equity issues that can arise.
In California, residential net metering customers of the three large investor-owned utilities pay for just 9-18% of what it costs the utilities to serve them due to two main factors:15
(1) the utilities recover system costs using bundled rates, around 60% of which is comprised of non-generation costs,16
(2) net metering exports to the grid are credited at the full or nearly the full bundled rate.
As such, net metering customers do not pay for non-generation costs when consuming electricity generated from their systems and when using grid electricity whose charges are covered by the credit earned from their electricity exports. While it might seem fair that these customers do not pay for non-generation system costs during periods when they are producing their own energy, they in fact still depend on the grid for backup and on services provided by system operators to maintain the reliability and stability of the grid. Therefore, these costs need to be taken into consideration in the design of programs.
Failing to ensure that complementary resources keep pace with variable generation growth can lead to curtailment and congestion costs
For the net-zero electricity grid target to be feasible, it must be ensured that the development of grid infrastructure, energy storage and demand response resources does not lag the growth of intermittent renewables. This is required to minimize incidences and costs of curtailments due to transmission line congestion or lack of demand during periods of high wind and solar generation. So far, the expansion of renewable energy capacity and generation has generally outpaced the construction of complementary infrastructure and resources.
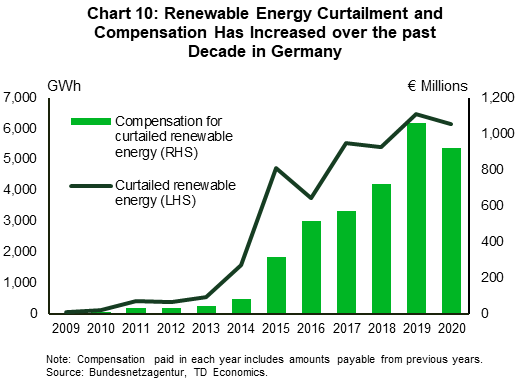
Curtailment of renewable energy represents waste on several fronts: paying for energy that is not used when contracts require such payments, loss of revenue for generators when the curtailed energy is not compensated, and not using that energy to help reduce emissions in the power sector. In Germany where there is more publicly available information, compensation for curtailed renewable generation has been rising steadily and averaged about €1 billion in 2019 and 2020, up from just €10 million in 2010 (chart 10).17 Renewable energy is largely curtailed as a last resort for dealing with congestion on transmission lines that move electricity from the north of the country, where most of the wind farms are located, to the demand centers in the south. From an emissions perspective, the curtailed renewable energy in 2020 was equivalent to 4.6% of the net generation from coal power plants, which produced 3.3% of the total power sector emissions.18
Additional costs of congestion include payments to redispatched conventional power plants (e.g., coal and gas generators). These are either required to reduce output upstream of the congestion or increase output for those located downstream of the congestion. When capacity from the redispatched downstream plants is insufficient to meet demand, reserve power plants are deployed to cover the shortfall in supply. From 2015 to 2020, the combined cost of redispatch measures and deployment of reserve plants fluctuated between €340 million and €600 million per year in Germany. It increases to €520-900 million when the fixed payments for holding the reserve plants are included.19,20
There are measures that can be employed to help control the cost of decarbonization
The fight against climate change cannot succeed without the decarbonization of the electricity sector and the broader energy system. Without Canada and the rest of the world taking meaningful action to reduce greenhouse gas emissions, the effects of climate change are forecast to be devastating. In other words, decarbonizing the electricity sector is not a question of if but of how we can do so with existing viable technologies quickly and as prudently as possible to ensure costs do not get out of control for consumers. While it is inevitable that decarbonization will entail additional costs, there are policies that jurisdictions can use to offset costs for consumers. These include providing electric bill subsidies to low-income households and small businesses and helping them to adopt more energy efficient equipment. In addition, other measures such as modernizing grid infrastructure and procuring new technologies through competitive auctions can be beneficial to consumers by helping to keep overall system costs lower.
Transmission and distribution infrastructure planning should take a long-term view with a focus on modernization
Better system planning and use of modern technology could help mitigate some of the costs of new grid infrastructure. One approach could be developing transmission infrastructure based on the expected total amount of intermittent renewable capacity in renewable energy resource-rich areas that have demonstrated developer interest. This would prevent having to upgrade the transmission infrastructure on a case-by-case basis as new solar and wind projects are added to the regions, which could increase infrastructure costs on aggregate. A proactive approach could minimize curtailment and other costs due to transmission line congestion as renewable capacity increases, especially since it usually takes longer to develop transmission infrastructure than solar and wind projects. There is also a need for more coordinated interregional planning of transmission infrastructure. Studies suggest that scenarios with more robust transmission capacity and expanded electricity trade between regions have lower system costs than those with limited transmission development. Additionally, incorporating new technologies that improve the efficiency of existing infrastructure can moderate cost increases by deferring investment on capacity upgrades or expansion. Examples include dynamic line rating systems, which generally lead to more efficient use of transmission lines than static rating approaches, and conservation voltage reduction technologies, which conserve energy through voltage reduction.
As regions seek to promote greater adoption of renewable onsite generation through net metering programs, it is important to ensure that the programs are designed to enable a fair allocation of grid infrastructure costs among consumer classes. If current fixed charge components of electric bills do not sufficiently cover the cost of service for net metering customers, it may be necessary to add a supplementary fixed fee to the bills of program participants. As well, a compensation rate for net metering exports similar to California's, which includes a large portion of non-generation costs, does not make sense. Given the current low cost of new utility-scale solar PV and wind projects, such net metering compensation designs may be unnecessarily costly for ratepayers.
New resources should be procured through competitive auctions as much as possible
Low-carbon technologies that are still relatively expensive even with current fiscal subsidies (e.g., investment tax credits) may require additional support along the lines of the high contract prices that enabled the growth of solar PV and wind. However, procurement through competitive auctions, if possible, should be the preferred option. This approach could help contract prices for new installations to be better aligned with contemporaneous trends in levelized costs of electricity/storage and prevent electric systems from incurring investment costs that are higher than necessary. As seen with the feed-in tariff (FIT) programs in Germany and Ontario, the government-set FIT rates were sometimes misaligned with market costs. This was especially the case for solar PV technologies whose costs fell much faster than anticipated. As a result, the overly generous FIT rates gave developers rates of return that were much higher than targeted by the programs.21, 22 The move towards auctions for procuring large-scale renewable energy projects resulted in lower contract prices in Germany and Ontario. For instance, the average bid prices of hydroelectric, wind and solar projects that won Ontario's 2015 Large Renewable Procurement competition were 28-43% lower than contemporaneous FIT rates of the same technologies.23,24 Similarly, single-source contracts can also result in above market costs.
Government support is needed to help moderate cost growth
Achieving the 2035 grid decarbonization target successfully will require support from governments. Financial measures announced by the federal government could help lower the realized costs of decarbonizing the grid. These include investment tax credits on the capital costs of clean energy technologies, as well as financing for infrastructure projects from the Canada Infrastructure Bank. Among non-financial supports that are critical for success is streamlining the permitting process for infrastructure projects to save time and reduce costs. Policies that provide direct support to consumers will continue to be necessary. Emphasis should be put on better shielding lower-income households and small businesses from high electricity prices through subsidies on energy bills. Additionally, there is a continuing need for programs that support improved insulation of buildings, as well as adoption of electric and more energy efficient equipment such as heat pumps and Energy Star certified appliances. This should include better promotion of these programs to raise awareness of their existence and benefits among eligible consumers. Assuming limited rebound effects, improving energy efficiency can reduce energy use from the same level of service and lower bills for consumers. It can also help defer the need for additional generation capacity and grid infrastructure expansion. As more customers make the switch to electric, increasing electric bills will be offset by a reduction in fossil fuel spending.
Partly offloading higher costs of decarbonization from ratepayers is also worth considering
There is a discussion to be had about the traditional approach of recouping most of the costs of the high-price contracts of emerging low-carbon technologies from electricity consumers, as this has contributed to increasing retail electricity prices in the past. For example, in part due to the premium paid by consumers for early high-cost renewables in Germany and Ontario, retail and wholesale prices diverged during the period leading up to the pandemic (chart 11). In both regions, the average wholesale price declined in 2009 from the 2008 peak and remained relatively flat in the subsequent years. However, that dip was not reflected in residential retail prices, which continued rising. Consequently, the gap between residential retail prices and wholesale market prices widened. In Ontario, the time-of-use regulated rates paid by households increased by 50-70% between 2010 and 2019 while the bundled residential rate in Germany increased by nearly 30%, outpacing inflation in both regions.25,26,27
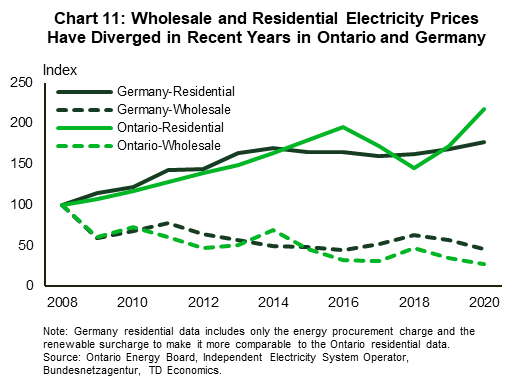
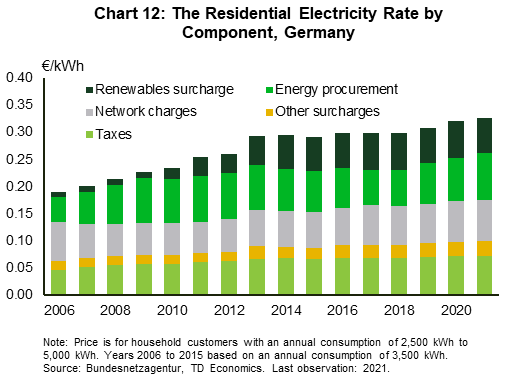
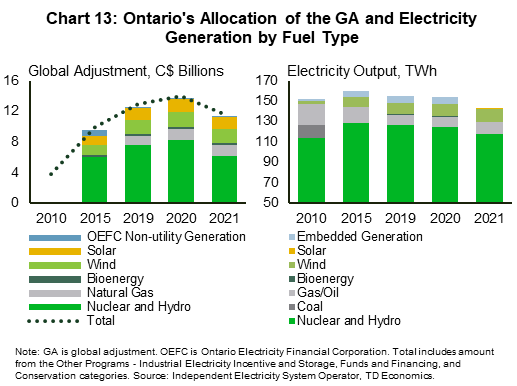
Consumers pay for the premium over wholesale revenue via the renewables surcharge in Germany and the global adjustment in Ontario, though the global adjustment is more expansive as it also covers payments to other contracted or regulated generators. From 2010 to 2019, the renewables surcharge paid by German consumers tripled and contributed more than half of the increase in residential rates (chart 12). Over the same period, the global adjustment quadrupled. This was driven partly by high contract prices from programs like FIT as well as increasing regulated rates especially for nuclear due to refurbishment costs. However, while nuclear and hydro together account for more than half of the total global adjustment amount, this share is much smaller than their share of generation. In contrast, solar and wind account for a larger share of the global adjustment than they do of generation. Natural gas also comprises a slightly larger share of the global adjustment than it does of generation although this is likely because gas generators command higher payments for the backup and flexibility services they provide to the grid. (Chart 13)
The two jurisdictions have pursued different measures for reducing electricity rates more broadly in recent years. After more than a decade in which the renewables surcharge grew from being negligible to being one of the largest components of residential electricity bills in Germany, the surcharge was reduced and eventually abolished as of July 2022. Instead, the premium for renewable energy generation will be paid for with money from the energy and climate fund, which gets part of its revenue from emissions trading. In Ontario, adopted measures include a now repealed 2017 legislation that gave consumers a rebate on the provincial sales tax and indexed the increase in rates to inflation. In addition, a 2021 legislation moved a portion of the global adjustment paid for non-hydro renewable energy to the general tax base. Though borne out of somewhat different political and economic environments, lowering retail electricity prices through policies that specifically target costs arising from renewable energy support programs highlights the sensitivities around higher energy costs for consumers due to decarbonization policies.
Bottom Line
The past decade has brought positive developments within the renewable energy cost landscape. The cost of solar PV panels and wind turbines has declined significantly, making these technologies economically viable substitutes for new fossil fuel projects. Storage technologies are also becoming increasingly cost competitive with natural gas peaker plants, which only run during periods of high demand. However, despite the positive trends, replacing baseload fossil fuel generation with a combination of solar, wind and storage will be more expensive as the cost of storage is still comparatively high. Looking at this from a different angle, the cost of new projects is generally higher than current electricity supply costs in the country. As such, the decarbonization of generation is expected to increase electricity prices for consumers. Costs arising from investment in transmission and distribution infrastructure to upgrade aging assets and support the growth of renewable energy will put further upward pressure on consumer bills.
There are measures that governments can pursue to keep costs under control for consumers. These include strengthening existing programs that promote the adoption of energy efficient equipment and provide subsidies to low-income households and small businesses. As well, modernizing grid infrastructure to make it more efficient and procuring new technologies through competitive auctions can also benefit consumers in the long-term by keeping overall system costs lower. Given the importance of greening electricity generation and electrifying end-use sectors in many net-zero pathways, affordable electricity prices are all the more relevant for nudging consumers to make the switch to electric. With time, the increase in electricity prices will be offset by declining non-electricity energy costs as consumers adopt electric vehicles and other electric equipment.
End Notes
- Canada Energy Regulator, Canada's Energy Future 2021 – Towards Net-Zero: Electricity Scenarios
- Lazard, Levelized Cost of Energy Analysis – Version 15.0, October 2021
- Alberta Electric System Operator, Renewable Electricity Program Results
- Independent Electricity System Operator, IESO Announces Results of Competitive Bids for Large Renewable Projects, March 10, 2016
- SaskPower, Énergie NB Power, Bruce Power and Ontario Power Generation, Feasibility of Small Modular Reactor Development and Deployment in Canada, March 2021
- Alberta Electric System Operator, Net-Zero Emissions Pathways
- Alberta Electric System Operator, Net-Zero Emissions Pathways
- Alberta Electric System Operator, 2021 Long-term Outlook
- California Public Utilities Commission, 33% Renewables Portfolio Standard Implementation Analysis: Preliminary Results, June 2009
- Hydro One, Powering Ontario: Hydro One's 2023-2027 Joint Rate Application Investment Plan, August 10, 2021
- Hydro Québec, Strategic Plan 2022-2026
- Hydro Québec, Form 18-K US Securities and Exchange Commission Regulatory Filings, 2015-2021
- Alberta Electric System Operator, Long-term Transmission Plan, June 2012
- Alberta Electric System Operator, 2021 Transmission Rate Projection, April 2021
- Verdant Associates, Net-energy Metering 2.0: Lookback Study, January 21, 2021
- California Public Utilities Commission, California Electric and Gas Utility Costs Report, 2016-2021 Reports
- Bundesnetzagentur, Monitoring Reports 2012-2021
- Bundesnetzagentur, Monitoring Report 2021
- Bundesnetzagentur, Monitoring Reports 2012-2021
- Bundesnetzagentur, Electricity grid reserve capacity requirements for 2020/2021 and 2024/2025, May 4, 2020
- Joern Hoppman, Joern Huenteler and Bastien Girod, Compulsive Policy-making – The evolution of the German feed-in tariff system for solar photovoltaic power, March 8, 2014
- Office of the Auditor General of Ontario, 2011 Annual Report: Chapter 3.03 Electricity Sector – Renewable Energy Initiatives
- Independent Electricity System Operator, FIT/microFIT Price Schedule
- Independent Electricity System Operator, IESO Announces Results of Competitive Bids for Large Renewable Projects, March 10, 2016
- Ontario Energy Board, Historical Electricity Rates
- Bundesnetzagentur, Monitoring Reports 2012-2021
- In contrast to Ontario's time-of-use regulated rates, the bundled retail rate for Germany includes transmission and distribution fees. Additionally, the increase in Ontario's rates was moderated by a 2017 legislation that reduced regulated rates by about 20% that year and indexed the rise to inflation for 2018 and 2019..
Disclaimer
This report is provided by TD Economics. It is for informational and educational purposes only as of the date of writing, and may not be appropriate for other purposes. The views and opinions expressed may change at any time based on market or other conditions and may not come to pass. This material is not intended to be relied upon as investment advice or recommendations, does not constitute a solicitation to buy or sell securities and should not be considered specific legal, investment or tax advice. The report does not provide material information about the business and affairs of TD Bank Group and the members of TD Economics are not spokespersons for TD Bank Group with respect to its business and affairs. The information contained in this report has been drawn from sources believed to be reliable, but is not guaranteed to be accurate or complete. This report contains economic analysis and views, including about future economic and financial markets performance. These are based on certain assumptions and other factors, and are subject to inherent risks and uncertainties. The actual outcome may be materially different. The Toronto-Dominion Bank and its affiliates and related entities that comprise the TD Bank Group are not liable for any errors or omissions in the information, analysis or views contained in this report, or for any loss or damage suffered.
Download
Share: