Higher Rates to Weigh On, not Upend, Canadian Housing Markets
Rishi Sondhi, Economist | 416-983-8806
Date Published: December 8, 2021
- Category:
- Canada
- Real Estate
Highlights
- The Bank of Canada has been sending a strong signal that short-term interest rates are poised to move higher beginning in the middle-part of 2022. This has contributed to upward pressure in bond yields across the curve in recent months.
- Given the rapid increase in home prices we've seen during the pandemic (and the attendant erosion in affordability), it's logical to wonder whether looming rate hikes will have a larger-than-normal impact on housing demand, and thus prices, moving forward.
- Our analysis of Canadian housing activity showed little evidence of increased interest rate elasticity in the years leading up to the pandemic relative to the long-run trend. Furthermore, stress tests offer ample room for rates to rise before buyers are crowded out.
- It is worth noting that the level of affordability was worse than it is now in late 1980s/early 1990s. Yet home sales managed to hold relatively stable over that period.
- In addition to affordability levels, the speed of deterioration matters. We calculate that the worsening in affordability during the pandemic has been exceeded only during the Global Financial Crisis. However, unlike back then, the macro backdrop remains supportive, which should help mitigate the impact of rising rates and keep sales well above pre-pandemic levels moving forward..
In late October, the Bank of Canada engaged in a bout of expectations management, sending a strong message to Canadians that they would do what's necessary to bring inflation under control. In doing so, it laid bare that higher rates could be in the pipeline. Our own forecast envisions three rate hikes taking place next year followed by three in 2023, bringing the overnight rate to 1.75% from its current 0.25% emergency setting. Of course, yields had been increasing even in advance of the Banks' hawkish message, with the 5-year bond yield on the rise since early September, climbing by about 60 basis points through early December.
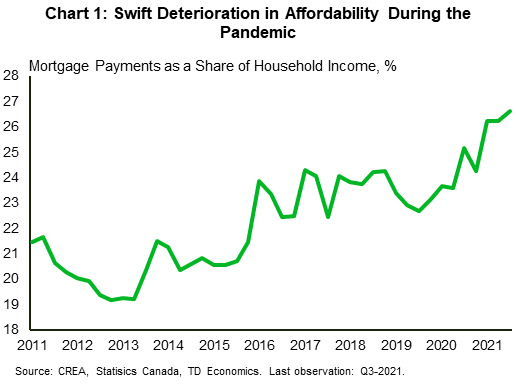
With home prices having reached astronomical levels during the pandemic – thus causing a further steep erosion in affordability from already unfavourable levels (Chart 1) – it becomes logical to wonder whether looming rate hikes will have a larger-than-normal impact on housing demand moving forward. After all, skyrocketing home prices have already made it tough for people to enter the market, and rising interest rates should make it even tougher.
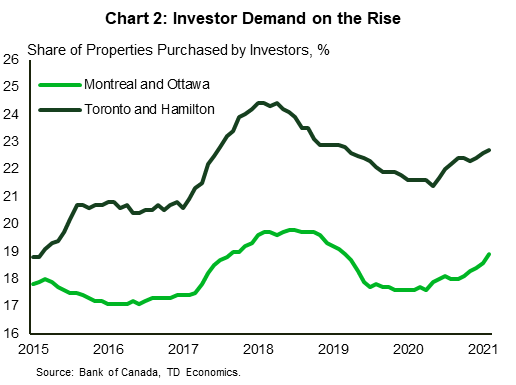
Our own view is that higher interest rates will exert a drag on demand, as they change the affordability calculus for potential owners and investors, while also reducing cash flows for the latter group. The potential impact on overall demand from investors shouldn't be overlooked, as they have formed a rising share of activity this year (Chart 2).
Only time will tell, but we are not convinced that higher rates will be enough to prevent another year of elevated sales activity and home price increases in 2022. There is a commonly held perception that higher prices equate to increased interest rate sensitivity. Yet our modelling work showed little evidence that this was the case during the several years of eroding affordability and rising yields prior to the pandemic. In addition, interest rates are not the only factor in the demand equation. Indeed, other key factors that drive demand, including savings and demographics, remain important offsets to rising borrowing costs.
Stable Negative Relationship Between Rates and Sales
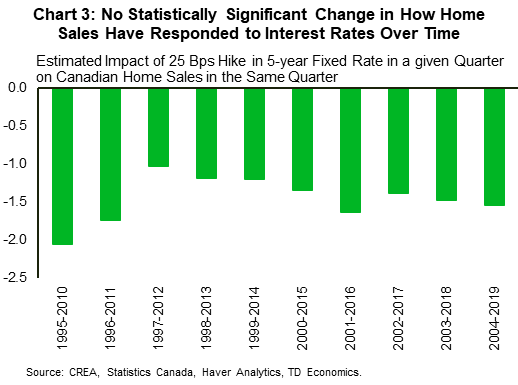
Prior to the pandemic, the negative relationship between interest rates and Canadian housing demand had been quite stable over time. Rolling regressions undertaken from 1995 through 2019 using equations relating home sales to fundamentals such as income, supply, prices, and interest rates confirm this (Chart 3).1 They also suggest that a 25 bps increase in the 5-year fixed mortgage rate in a given quarter has historically yielded around a 1.5% drop in home sales in the same quarter, all else equal.
This is an interesting result in that even in periods when Canadian home prices were advancing at (or near) double-digit rates, such as 2002-2007 (capturing a period of strong job growth, an oil price boom, falling mortgage rates and exuberance ahead of the Global Financial Crisis) or 2015 to early 2017 (when parts of Ontario were likely in a bubble), no significant change in the elasticity between interest rates and home sales is observed.
On the face of it, this historical stability would suggest that the relationship between home sales and interest rates has held through the pandemic (and should continue to hold moving forward). However, one key difference from the pre-pandemic periods and now is that the overall affordability level has turned much worse. As of the third quarter of 2021, affordability is now at its weakest point since the mid-1990s.
Now and Then
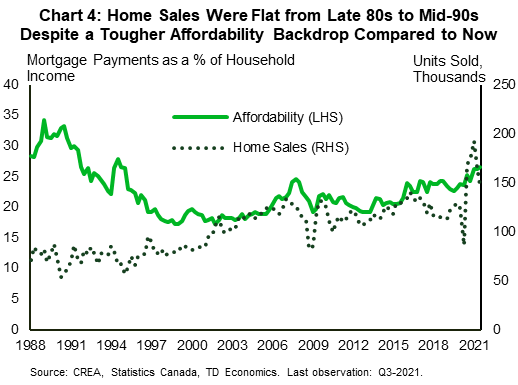
In fact, the cost of home ownership during the 1988 to mid-1994 period was even weaker than it is now owing in part to prevailing mortgage rates at the time that were running at about 10% on average, a far cry from where they stand today. Interestingly, despite extremely tough affordability conditions, home sales were able to hold essentially flat through this period (Chart 4). This could be because affordability, while strained, was improving through this period, as mortgage rates were falling, and income growth outpaced the rise in home prices. Furthermore, continued growth in nominal home prices during the late 1980s/early 1990s concealed the fact that real inflation-adjusted prices were in decline, mitigating the negative impact on demand.
Another distinction that may have increased the sensitivity in the current episode is the extent to which deterioration has taken place since the onset of the pandemic. Put another way, speed rather than just level matters. It's worth noting Canada saw an even swifter deterioration during the run-up to the Global Financial Crisis (GFC) from 2005-2007 and a similar-sized one during the dot-com bubble in the late 90s. In the GFC, affordability deteriorated by 23% while worsening by about 15% during the late 90s bubble. In comparison, affordability has worsened by about 15% since the onset of the pandemic, as the rapid rise in home prices has been offset to a degree by falling interest rates.
In the aftermath of the dot-com bubble bursting, home sales and prices still managed to increase at a modest pace. The GFC is a different story, as sales and prices fell by 40% and 10%, respectively, on a peak-to-trough basis. However, there were extenuating circumstances at play, notably a global economic recession. And, the domestic economic backdrop was weak, with Canadian GDP and employment falling by 4.5% and 2% on a peak-to-trough basis, which certainly didn't help housing demand.
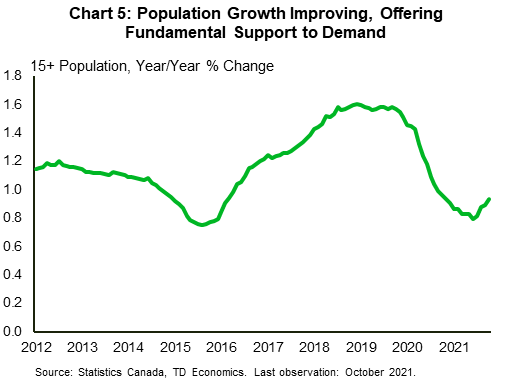
In contrast to GFC, we think that the economic backdrop will be demand-supportive as we move through next year. Indeed, we expect strong economic, employment and income growth to take place in 2022. In addition, population growth is likely to improve. We've had some positive indications on the latter front, as year-on-year population growth looks to have bottomed in June (Chart 5).
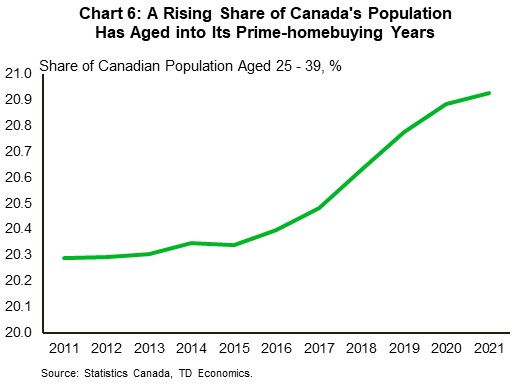
In addition to these positive drivers, households are holding significant excess savings (see report), some of which could be funneled into down payments. Indeed, past Bank of Canada surveys have pointed to 10% of these savings being used for this purpose. What's more, a large chunk of the Canadian population has aged into what has historically been prime homebuying years (Chart 6), offering demographic support to demand. Finally, expectations of future price gains may continue to stoke demand, by causing potential buyers to act now rather than later.
These factors should help keep sales elevated, offsetting the impact of higher rates. And, this healthy demand environment, coupled with the fact that markets are extremely tight, should help sustain positive Canadian average home price growth next year, even after they post what should be a near-25% annual average gain in 2021.
Stress Tests A Potential Double-Edged Sword, Although Current Backdrop Leaves Ample Room for Higher Rates
The uniqueness of the pandemic makes it difficult to econometrically assess any changes in the relationship between home sales and interest rates that may have taken place since early 2020. One way we attempt to get around this limitation is through the construction of an economy-wide gross debt service (GDS) ratio2. Note that lenders use the GDS (alongside the total debt service ratio), when qualifying potential buyers for a mortgage. The GDS considers mortgage payments, property taxes and heating costs as a share of income, with the caveat that this ratio shouldn't exceed 39% for potential borrowers. Our calculations point to this ratio hitting about 34% in the third quarter which is a significant increase from years past, but still suggests ample qualification room for buyers.
Interest rates are one of the key inputs into this analysis. What's notable here is that during the 2018-2019 period, rates associated with stress tests played a large role in the qualification process. And as interest rates plunged during the pandemic, these stress test rates became even more important for qualification. Indeed, most lenders are using this rate, as they must use the larger of it, or the contract rate plus 200 bps when qualifying, and in most cases, the stress test rate is higher.
{related-articles-row}
In June of this year, the stress test interest rate for both insured and uninsured mortgages was increased to 5.25% from 4.79%. Contract rates for variable rate mortgages were around 1.5% in September, while 5-year fixed rate mortgages were around 2.2%-2.3%. This would imply that interest rates on variable and 5-year fixed rate mortgages would have to rise by about 175 bps and 100 bps, respectively, from their September levels before they replaced the 5.25% stress test rate in the qualification process. As such, the stress tests are affording ample room for rates to rise before they start crowding out potential buyers.
As noted above, our forecasts assume 150 bps of tightening in the Bank of Canada's overnight rate through 2023. Meanwhile, 5-year bond yields (which underpin 5-year fixed rate mortgages) are expected to climb by about 50 bps over that time from their current level. In both instances, the level to which mortgage rates would be expected to climb would still fall below the current stress test qualification threshold. Key to this is our assessment on inflation, which should peak by early 2022 and then gradually roll-over. There are risks to the forecast however as, for example, the new Omicron COVID-19 variant could throw more kinks in the supply chain, putting even more upward pressure on inflation.
Another important consideration is that the stress test rate itself could increase as interest rates move higher, and policymakers have communicated their intention to review the stress test rate (at least) once a year, likely in December. This was the case during the last BoC tightening period from July 2017 to October 2018, when the stress test qualification rate increased by 70 bps, nearly matching the increase in the 5-year bond yield. If it the stress test rate were to move higher, it would make purchasing a home more difficult and could cause potential buyers to downsize or stay on the sidelines. All told, the stress tests are a double-edged sword in that they offer significant room before mortgage qualification thresholds are threatened, but the thresholds themselves may move higher.
Bottom Line
Higher interest rates are likely on the way and our rate forecasts imply that they will exert a moderate drag on housing demand. However, a supportive macro backdrop, alongside stress tests that offer ample room for rates to rise before buyers are crowded out, should keep activity holding above pre-pandemic levels next year.
Affordability has become much tougher due to the rapid escalation of prices during the pandemic. That said, Canada has in its past managed to weather a situation where the cost-of-living situation was even worse without seeing a severe retrenchment in activity. And, both new and resale markets remain drum-tight, suggesting another strong year for price growth is in the cards for 2022.
End Notes
- The analysis is done at both the monthly and quarterly frequencies, although the former involves splitting the sample into 5-year windows and comparing the interest rate coefficients in these sub-samples.
- To calculate the ratio, we use property tax and heating cost data from the Survey of Household Spending, interest rate data from the Bank of Canada, and income data from Statistics Canada.
Disclaimer
This report is provided by TD Economics. It is for informational and educational purposes only as of the date of writing, and may not be appropriate for other purposes. The views and opinions expressed may change at any time based on market or other conditions and may not come to pass. This material is not intended to be relied upon as investment advice or recommendations, does not constitute a solicitation to buy or sell securities and should not be considered specific legal, investment or tax advice. The report does not provide material information about the business and affairs of TD Bank Group and the members of TD Economics are not spokespersons for TD Bank Group with respect to its business and affairs. The information contained in this report has been drawn from sources believed to be reliable, but is not guaranteed to be accurate or complete. This report contains economic analysis and views, including about future economic and financial markets performance. These are based on certain assumptions and other factors, and are subject to inherent risks and uncertainties. The actual outcome may be materially different. The Toronto-Dominion Bank and its affiliates and related entities that comprise the TD Bank Group are not liable for any errors or omissions in the information, analysis or views contained in this report, or for any loss or damage suffered.
Download
Share this: