Canadian Regional Divergences in Household Wealth and Leverage
Maria Solovieva, CFA, Economist | 416-380-1195
Mekdes Gebreselassie, Economic Analyst
Date Published: June 9, 2026
- Category:
- Canada Consumer Provincial and Local Analysis
Highlights
- Household wealth reached record or near-record levels across provinces in 2025. However, important regional differences reveal nuances in the level of financial resilience.
- Strong gains in financial assets helped support spending in 2025, partially offsetting softer labour markets and slower income growth and acting as a financial bridge for households.
- Household leverage, as measured by debt-to-income ratios, declined across most provinces since the pandemic, except for in Ontario and PEI. Ontario now has the highest leverage in the country, leaving households more exposed to higher borrowing costs and future economic shocks.
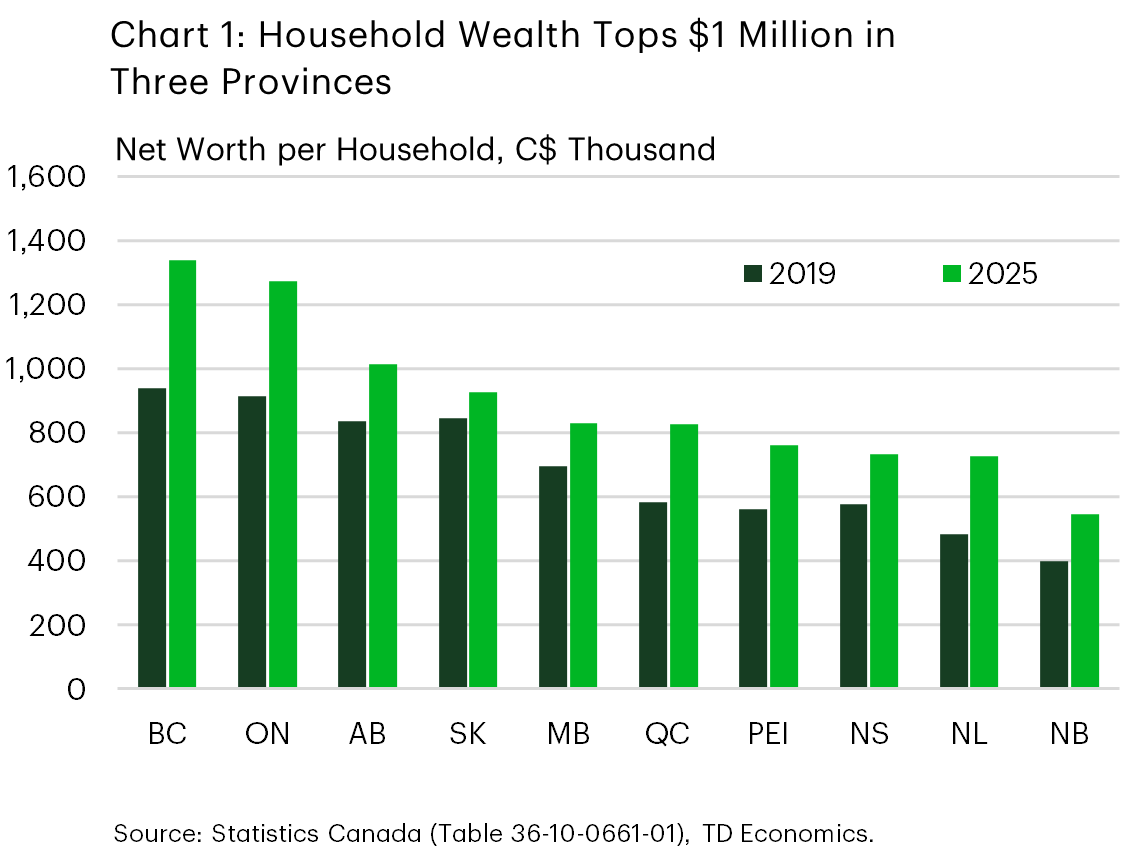
Household balance sheets often look reassuring in the aggregate – and in 2025, Canada’s headline numbers delivered. Canadians’ net worth reached a new record in 2025, rising to over $1 million per household, up 5.3% since the prior year. Across provinces, net worth is also near record levels, except for British Columbia (B.C.), where net worth peaked in early 2022. Today, three provinces – B.C., Ontario, and Alberta – have average household net worth above the $1 million mark, at $1.34 million, $1.27 million, and $1.02 million, respectively (Chart 1).
Wealth gains since the pandemic have been strong. National average net worth per household rose by 37% between 2019 and 2025 – modestly stronger than over the prior six-year period – while debt service ratios have eased from their cycle highs. Yet, beneath the surface provincial balance sheets tell a more nuanced story, with two themes standing out.
The first is the increased role of financial market gains in supporting household spending recently. Earlier in the pandemic, wealth gains were driven largely by housing, as low interest rates and shifting preferences fueled strong gains in real estate. More recently, that dynamic has reversed. Real estate values have been broadly flat to declining, while financial assets have taken over as the primary driver of wealth growth, particularly following the Bank of Canada’s easing cycle. In the latest data from Statistics Canada’s distributions of household economic accounts, financial assets per household rose by 9.9% in 2025 – a record-setting pace.
The second theme is leverage. Most provinces have deleveraged since the pandemic, but Ontario stands apart, entering the next phase of the cycle as the most indebted province in the country. Together, these two themes define where Canadian household finances are strong, where they are stretched, and what that means for the spending outlook ahead.
Financial Assets Have Been a Spending Bridge
What stands out recently is the growing role of financial wealth. This shift has proven timely. As labour markets softened across provinces, growth in personal disposable income moderated from a range of 3.2-6.8% in 2024 to 3.0-5.4% in 2025, creating headwinds for local economies. At the same time, financial asset gains have been both strong and broadly synchronized, with growth tightly clustered across provinces (8.8–10.3%). As a result, financial wealth has likely played a role as a financial bridge, supporting spending.
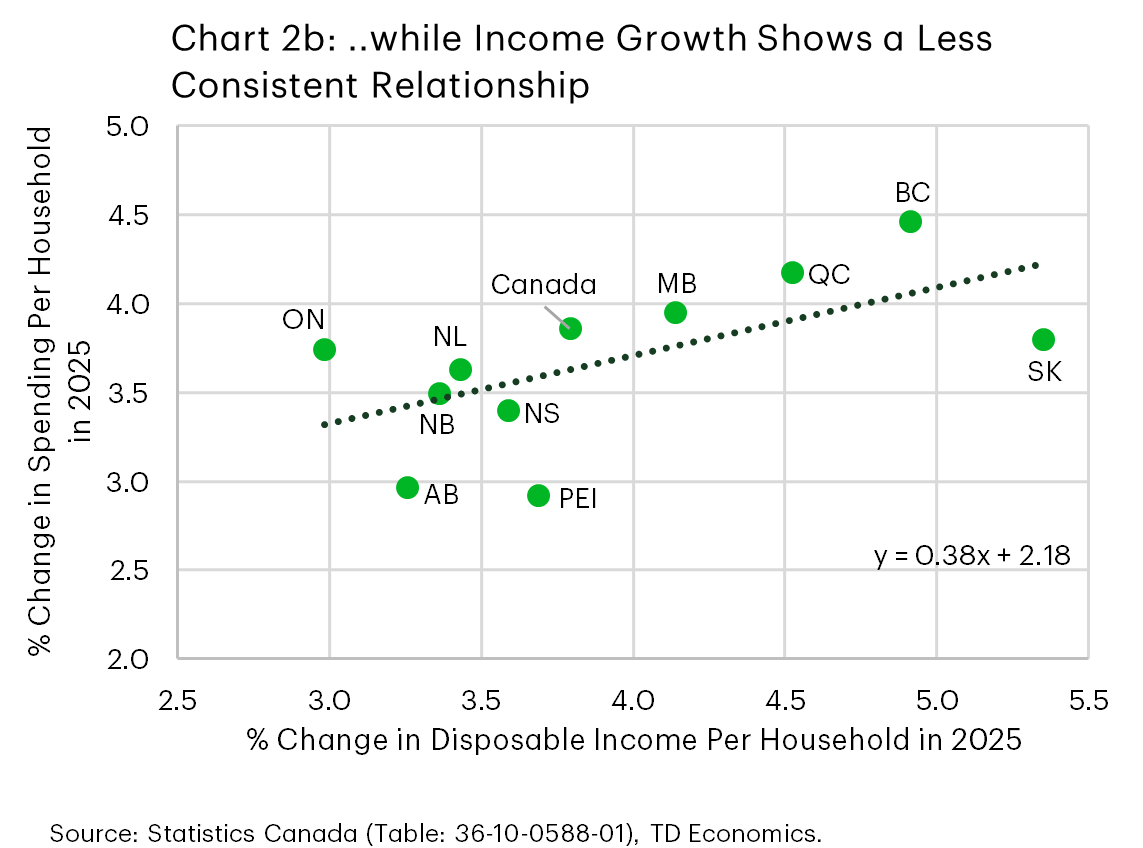
This is illustrated in Charts 2a and 2b, which compare provincial changes in per-household spending with changes in financial assets and disposable income in 2025. Across provinces, spending growth aligns more closely with financial asset gains than with income growth. While both relationships are positive, the link with income shows much greater dispersion. In other words, provinces where financial assets grew somewhat faster tended to see stronger spending outcomes, suggesting that wealth effects from financial assets played a more prominent role in shaping consumption in 2025.
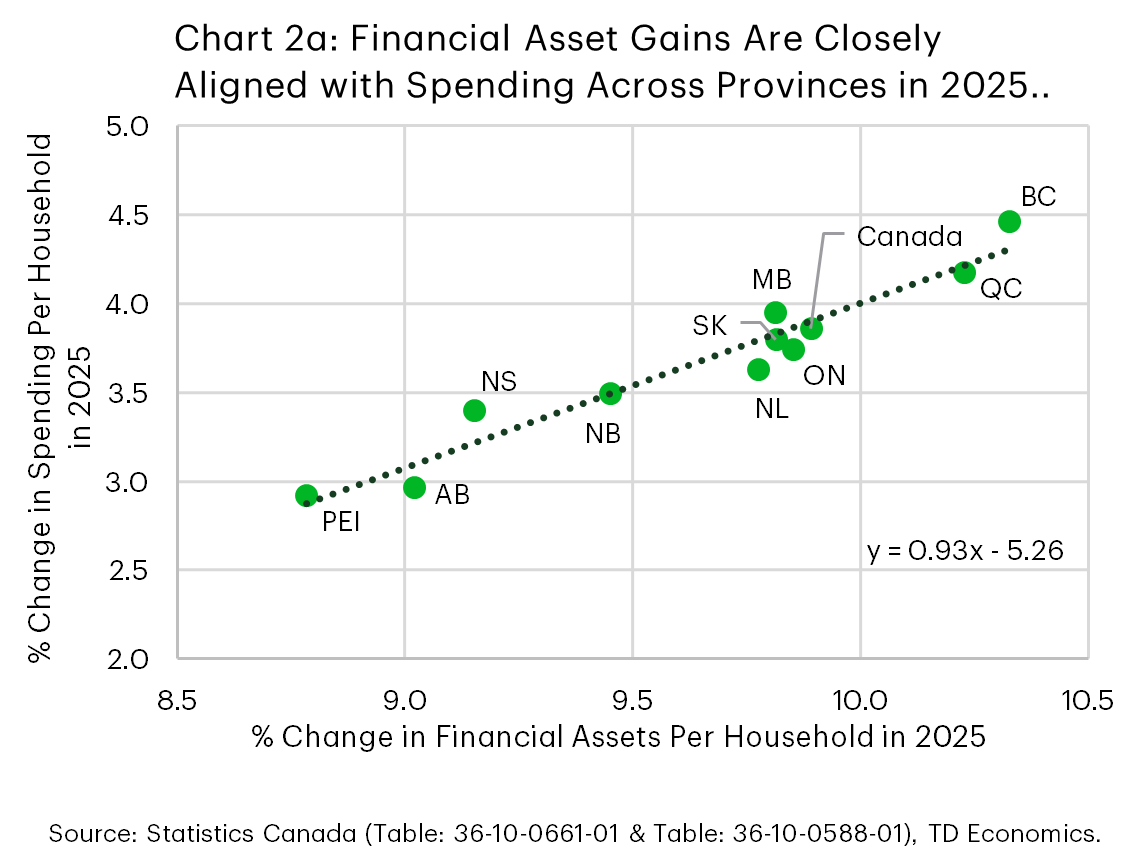
These patterns are consistent with the broader literature on wealth effects, which generally finds that increases in household wealth support higher consumption, though the effect is meaningfully smaller than that of income. Empirical estimates for Canada place the marginal propensity to consume out of wealth at roughly 3 to 8 cents per dollar – below estimates for income, which the literature typically finds to be substantially larger1. That the provincial spending pattern in 2025 aligns more closely with financial asset gains than income growth is somewhat unusual. Moreover, Canadian evidence has evolved on the composition of the wealth effect itself. Earlier work, such as Pichette and Tremblay (2003), found housing wealth to be the dominant driver, with financial assets playing a limited role2. More recent estimates by Kichian and Mihic (2018) suggest financial assets may now matter more than previously thought – and crucially, that the housing wealth effect is strongest when credit is easily accessible3. In a relatively higher rate environment and flat or declining real estate assets, that channel is constrained, leaving financial markets to do proportionally more of the work.
The provincial evidence reflects this dynamic. In Ontario, per-household disposable income grew at the slowest pace among provinces in 2025, decelerating more sharply than the national average from a year earlier, yet spending remained close to the national average. At the same time, Ontario’s financial asset gains were close to the national average, suggesting that households may be drawing on financial wealth gains to bridge the income gap.
Prince Edward Island (PEI) and Alberta present the opposite case. Both recorded relatively strong income growth, which would typically support stronger spending. However, weaker gains in financial assets appear to have limited that transmission, resulting in more subdued spending outcomes.
Saskatchewan stands out in a different way: despite solid income growth in 2025, spending has remained restrained. With a higher share of self-employment relative to other provinces, income gains tend to be more volatile and less readily translated into consumption. With the slowest cumulative growth in net worth over the past 15 years, households may perceive recent gains as less durable, reinforcing a more cautious spending response.
In B.C., spending growth outpaced all other provinces, reflecting marginally stronger gains in financial assets and above average personal income growth. Its position above the trend line suggests that higher underlying levels of household financial wealth may be amplifying the spending response – a reminder that the level of total wealth, not just its recent financial gains, shapes household behaviour.
It is worth noting, however, that this pattern may partly be due to unique characteristics of 2025, rather than an unusually powerful wealth effect. In 2025, income growth was both modest and more uniform across provinces, reducing its ability to explain differences in spending. This appears to be a 2025-specific dynamic: over the full post-pandemic period, disposable income is the dominant driver of provincial spending differences, consistent with the broader literature. Meanwhile, housing equity – historically a strong wealth channel in Canada – was flat to declining and contributed nothing to provincial spending dispersion. Financial assets, even with their relatively narrow spread across provinces, were the only measure showing meaningful co-movement with spending, which may make their influence appear larger than a marginal propensity to consume of 3 to 8 cents per dollar would ordinarily imply.
Debt Burdens Have Fallen Across Most Provinces, With Notable Exceptions
Another notable regional divergence in household balance sheets is in leverage. The debt-to-income (DTI) ratio provides a simple gauge of household leverage and financial vulnerability across provinces. Higher ratios signal greater sensitivity to interest rates and less capacity to absorb shocks, limiting households’ broader financial resilience. Most provinces have seen a decline in their DTI ratios relative to the pre-pandemic period (Chart 3).
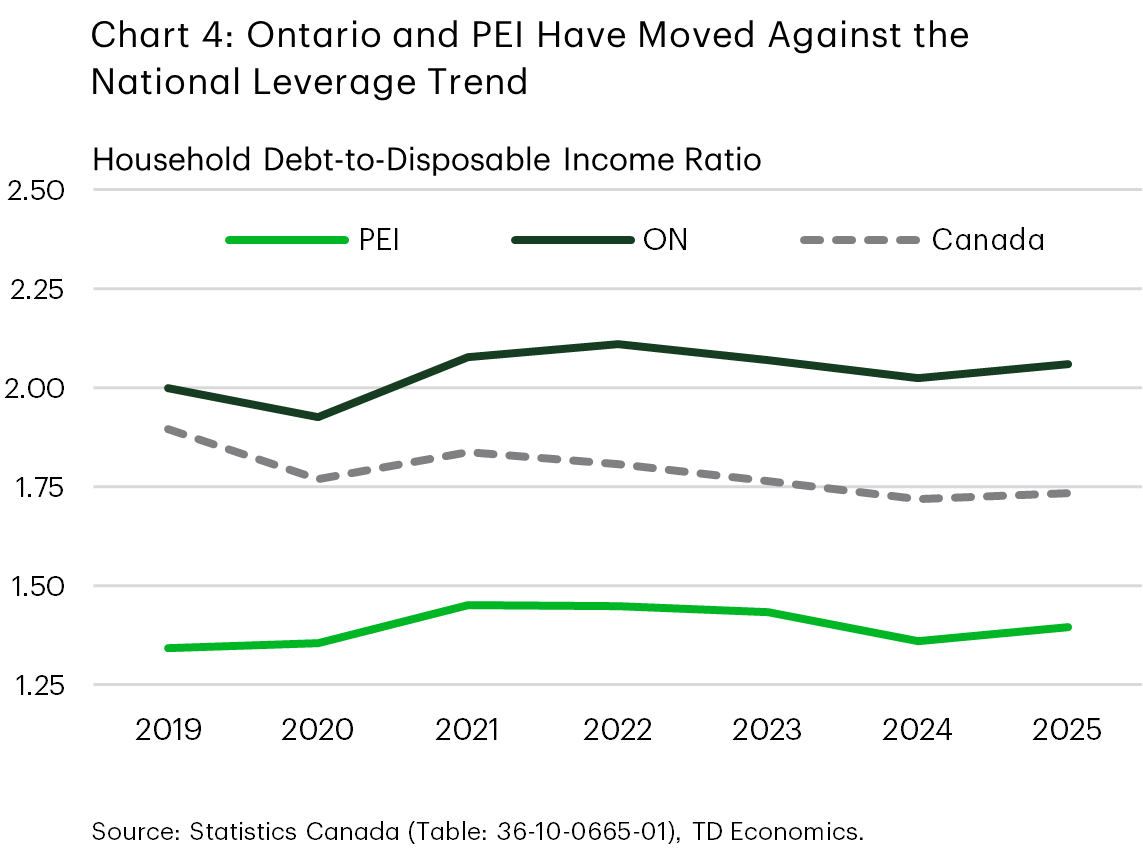
Ontario and PEI are the only two provinces where DTI ratios in 2025 remained above their pre-pandemic levels. The mechanisms in each province differ somewhat. PEI and Ontario recorded the first- and second-highest growth in total debt relative to the pre-pandemic period, but Ontario has also seen relatively soft income growth. Both Ontario and PEI have seen some modest improvement in their DTI ratios from peaks in 2022, but to a lesser extent than other provinces (Chart 4). Debt growth has slowed in Ontario in recent years in line with higher interest rates and a cooler housing market, but income growth has been weak, particularly in 2025, preventing any improvement in leverage. From a vulnerability perspective, Ontario stands out as the most leveraged province in the country, given B.C. has seen leverage decline.
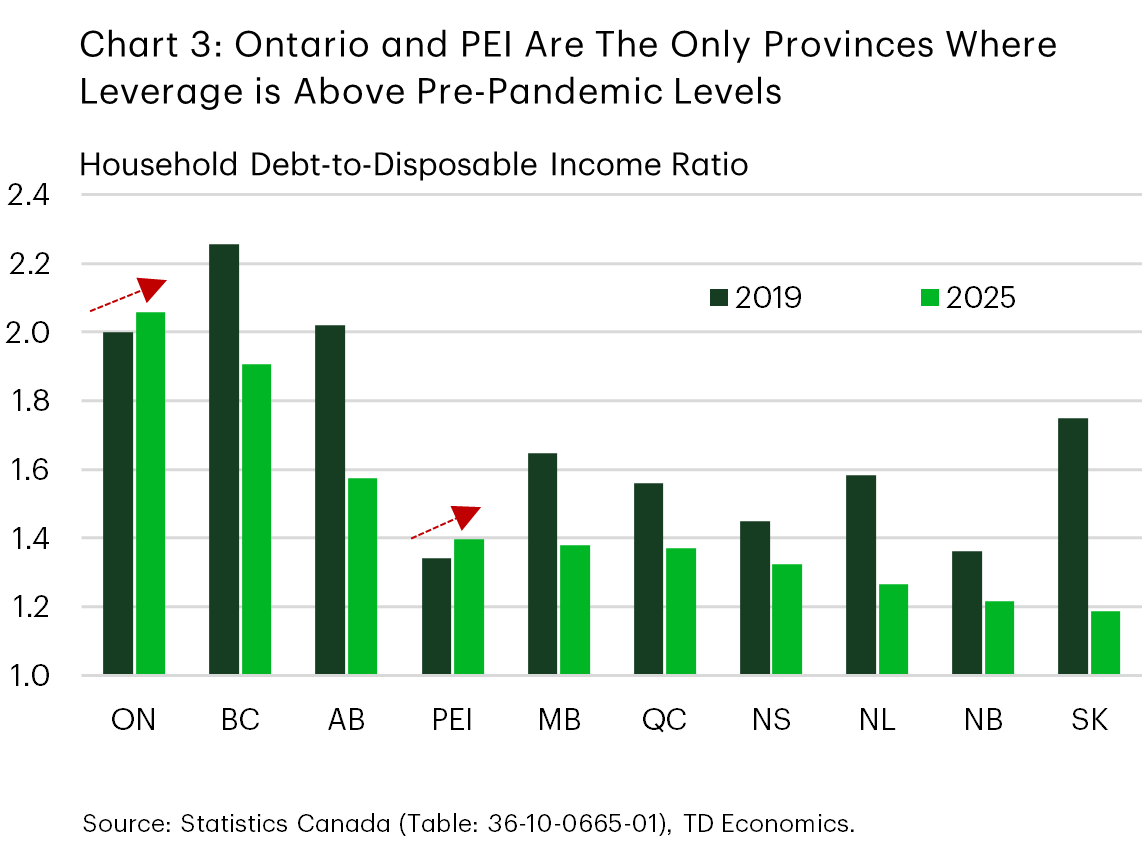
Digging a little deeper, PEI’s nation-leading debt growth coincided with the largest wave of in-migration the province had seen, as labour demand attracted international immigrants through programs such as the Atlantic Immigration Program and interprovincial migrants, mainly from Ontario. Yet, PEI’s DTI ratio remains relatively low. Nova Scotia followed a similar pattern at a lower intensity: mortgage debt growth was the second highest in the Atlantic region, but income growth kept pace, keeping leverage in check. The other two Atlantic provinces, with more affordable housing markets, saw more moderate growth in mortgage debt.
By contrast, leverage dynamics have been more contained elsewhere. In B.C. and Quebec, relatively strong income growth alongside a general moderation in borrowing in recent years have helped reduce leverage. This is especially notable in B.C., which is often mentioned alongside Ontario as a province with the least affordable housing market, and had the highest degree of leverage prior to the pandemic.
In the Prairies, more moderate housing market conditions helped limit leverage growth. Saskatchewan recorded the slowest debt growth in the country, while Alberta and Manitoba also saw borrowing increase at a pace well below the national average.
Bottom Line
Developments in household balance sheets often draw attention but scratching beneath the aggregate picture reveals provincial differences. In 2025, financial wealth gains were more closely correlated with spending than they have been over the long term, where income remains the dominant driver. This suggests that households may have been drawing on financial wealth gains to help bridge slower income growth. The growing role of financial assets may partly reflect the absence of stronger traditional drivers of spending, particularly housing and income growth.
Another commonly watched element of household balance sheets in Canada is leverage. Higher leverage makes households more sensitive to interest rates and vulnerable in the event of an income shock. Most provinces have seen leverage decline, but Ontario stands out. Ontario households are now the most leveraged in Canada and have seen the least improvement in recent years, due in part to modest income growth. Provincial differences in leverage therefore remain a key factor to watch when assessing household resilience. In provinces where debt-to-income ratios remain elevated, households are likely to remain more sensitive to higher borrowing costs and weaker housing conditions. By contrast, provinces with more contained leverage and stronger balance sheet improvement may be better positioned to sustain consumption growth even in a slower economic environment.
These differences may become increasingly important as provincial economies navigate a period of softer growth, still-elevated borrowing costs, and a housing market that remains subdued across much of the country.
End Notes
- The range draws on several Canadian and international estimates. For Canada, Macklem (1994) and Pichette (2000) estimated aggregate wealth effects in the range of 3 to 8 cents per dollar. The IMF (2011) updated these estimates using Canadian data for 1990–2011, finding the marginal propensity to consume out of permanent changes in housing wealth at approximately 5.4 cents per dollar and out of financial wealth at approximately 2.5 cents per dollar. The marginal propensity to consume out of income is consistently found to be higher across the empirical literature; see Carroll et al (2017).
- Pichette, L. and Tremblay, D. (2003). Are Wealth Effects Important for Canada? Bank of Canada Staff Working Paper 2003-30.
- Kichian, M. and Mihic, M. (2018). How Important Are Wealth Effects on Consumption in Canada? Canadian Journal of Economics, 51(3), 784–798.
Disclaimer
This report is provided by TD Economics. It is for informational and educational purposes only as of the date of writing, and may not be appropriate for other purposes. The views and opinions expressed may change at any time based on market or other conditions and may not come to pass. This material is not intended to be relied upon as investment advice or recommendations, does not constitute a solicitation to buy or sell securities and should not be considered specific legal, investment or tax advice. The report does not provide material information about the business and affairs of TD Bank Group and the members of TD Economics are not spokespersons for TD Bank Group with respect to its business and affairs. The information contained in this report has been drawn from sources believed to be reliable, but is not guaranteed to be accurate or complete. This report contains economic analysis and views, including about future economic and financial markets performance. These are based on certain assumptions and other factors, and are subject to inherent risks and uncertainties. The actual outcome may be materially different. The Toronto-Dominion Bank and its affiliates and related entities that comprise the TD Bank Group are not liable for any errors or omissions in the information, analysis or views contained in this report, or for any loss or damage suffered.
Download
Share: